




Abstract
Abstract
Recent studies have shown that regulation of many important genes is achieved with multiple transcription factor (TF) binding sites with low or no cooperativity. Additionally, noncooperative binding sites are gaining more and more importance in the field of synthetic biology. Here, we introduce a computational framework that can be applied to dynamical modeling and analysis of gene regulatory networks with multiple noncooperative TF binding sites. We propose two computational methods to be used within the framework, that is, average promoter state approximation and expression profiles based modeling. We demonstrate the application of the proposed framework on the analysis of nuclear factor kappa B (NF-κB) oscillatory response. We show that different promoter expression hypotheses in a combination with the number of TF binding sites drastically affect the dynamics of the observed system and should not be ignored in the process of quantitative dynamical modeling, as is usually the case in existent state-of-the-art computational analyses.
1. Introduction
I
On the contrary, the second group of regulatory circuits produces more analog transcriptional responses. In this case, promoters without or with very low cooperative regulation between the TF binding sites are involved (Giorgetti et al., 2010). Low cooperativity causes TFs to bind to the promoters gradually, that is, linearly proportional to their concentrations. Furthermore, promoter activity in this case depends on the exact state of its binding sites (Spitz and Furlong, 2012). Therefore, TFs not only define the activity of promoters but also may define the rate of their expression in different manners (Giorgetti et al., 2010; Spitz and Furlong, 2012).
On the one hand, gradual promoter response reflects high regulatory capacity compared with promoters with simple on/off dynamics. On the other hand, larger clusters of TF binding sites can be used to decrease the effects of intrinsic noise (Giorgetti et al., 2010), reduce the crosstalk among different operators, and enhance the efficiency of repression (Lebar et al., 2014). Large clusters of TF binding sites can be used when graded, that is, analog, transcriptional response is desired (Lorberbaum and Barolo, 2013). However, noncooperative TF binding sites are not limited to only linear behavior. Nonlinear response can be achieved with the use of different enhancer activity models (Spitz and Furlong, 2012), positive feedback loops, and competition for the same DNA operator binding sites between activators and repressors (Lebar et al., 2014). Large numbers of noncooperarive monomeric TF binding sites thus allow us to design tunable biological systems, which reflect robust behavior, and can provide higher regulatory capacity with respect to cooperative binding, which typically results in a digital (nonlinear) on/off response.
The development of different artificially engineered monomeric TFs such as Zinc fingers (Gommans et al., 2005), TAL effectors (Garg et al., 2012), or CRIPSR/Cas-based repressors (Cong et al., 2013; Qi et al., 2013) has recently enabled us to design biological networks with a scalable number of noncooperative TF binding sites. These platforms have already been applied to the design of boolean logic gates (Gaber et al., 2014) and a toggle switch (Lebar et al., 2014). In these examples, multiple noncooperative TF binding sites are used to decrease the intrinsic noise and thus to increase the robustness of designed circuits and achieve the desired response with the use of only monomeric TFs. Although the analysis of promoters with multiple noncooperative TF binding sites is important from the perspective of synthetic biology, it may also shed light on the analysis of similar regulatory mechanisms observed in natural systems. For example, the Epstein–Barr virus latency switch is regulated by a promoter with 20 noncooperative TF binding sites (Werner et al., 2007). Moreover, TF nuclear factor kappa B (NF-κB), controlling inflammation and immunity processes in different eukaryotes (Giorgetti et al., 2010), and TF Msn2, regulating the general stress response in yeast (Stewart-Ornstein et al., 2013), also follow similar behavior.
In this article, we present a computational framework that can be used to efficiently model the dynamics of gene regulatory networks (GRNs) with multiple noncooperative TF binding sites. The framework consists of three levels, that is, (1) promoter state evaluation, (2) evaluation of transcriptional activity, and (3) updating the concentrations. We introduce a methodology that can be used on the first level, namely average promoter state approximation (APSA). APSA reduces computational complexity of existing approaches that are commonly used to evaluate the promoter state. We additionally propose a compact way of presenting different promoter states’ transcriptional activity, namely expression profiles based modeling (EPBM), which can be used on the second level of the modeling framework. We then demonstrate the application of the framework on a case study of NF-κB oscillatory response analysis, where we observe how different numbers of observed binding sites affect the oscillatory dynamics of the system together with different promoter expression hypotheses and other parameters describing the system under study.
The remainder of this article is organized as follows: Computational Modeling Framework section introduces the modeling framework. Its application on the analysis of the NF-κB oscillatory response is described in Case Study: Analysis of NF-κ B Oscillatory Response section. Conclusion section discusses the generality of the described approaches, their potential in practical applications, and it provides some guidelines for future work.
2. Computational Modeling Framework
Quantitative models describing the dynamics of GRNs are usually composed of a set of ordinary differential equations (ODEs) or of a stoichiometric matrix presentation (Le Novere, 2015). Both presentations are derived from a set of chemical reactions describing the changes in the observed system. The size of this set is proportional to the number of observed chemical species, which presents a major obstacle when dealing with more complex systems. For example, let us assume a GRN where promoters have n noncooperative TF binding sites with m different types of competing TFs. In this case, the number of species that derive from only one promoter equals (m + 1) n . Since each promoter state is represented as a separate chemical species, the number of differential equations in a conventional ODE model coincides with the number of different promoter states.
When we are dealing with cooperative binding, these numbers can be drastically reduced with Hill equations (Alon, 2007). These presume that the promoter state is either unbound or fully occupied. Although restriction to only two possible promoter states seems reasonable and also significantly lowers the computational load, there are several drawbacks of these models (Weiss, 1997). Moreover, they cannot be applied to noncooperative binding.
Consequently, accurate quantitative modeling of multiple noncooperative binding sites is, without further presumptions, only possible for very small systems, for example, for a single promoter with only a few binding sites (Murphy et al., 2007). We can usually simplify the model by ignoring the arrangements of bound TFs, which means we only consider their quantities (Bintu et al., 2005a,b; Werner et al., 2007; Giorgetti et al., 2010; Sauro, 2012). This results in 1. Promoter state evaluation: Evaluate current promoter states or their probabilities on the basis of TF concentrations and binding affinities. 2. Evaluation of transcriptional activity: Evaluate the transcriptional activity of promoters based on their states and their expression profiles. 3. Updating concentrations: Update concentrations of observed chemical species according to slow reactions, that is, degradation, transcription, and translation.
2.1. Promoter state evaluation
Promoter states are evaluated in dependence on corresponding TF concentrations and their binding/dissociation constants. Two approaches that have already been applied to the modeling of GRNs with multiple TF binding sites are fractional occupancy (FO) (Sauro, 2012) and thermodynamic modeling (TDM) (Bintu et al., 2005a,b; Werner et al., 2007; Giorgetti et al., 2010).
2.1.1. FO and TDM
Both FO and TDM are based on the estimation of probabilities of different promoter states and can be integrated into the proposed computational framework in a straightforward manner. Probabilities of promoter state sx can be calculated as follows:
where W(sj) describes the weight of promoter state j. FO defines the weights asfollows:
where [Ai] is the concentration of TF i, ni indicates the number of binding sites occupied by TF i in state sx, and KAi,ni is the binding constant of ni TFs Ai to the promoter region. Nx is the number of arrangements that define the observed state and can be expressed as follows:
TDM is essentially the same method as FO, but uses different data, that is, binding free energies of each promoter state (Bintu et al., 2005a,b), to evaluate promoter state weights. These are evaluated as follows:
where ΔGni is the free energy change between the ni-bound TFs of type i and the reference promoter state (i.e., fully unbound promoter), T is the absolute system temperature, and R is the gas constant. The free energy change of the reference state equals 0 (ΔG0 = 0). Note that the weight of the unbound promoter s0 equals 1 in both FO and TDM approaches.
The described equations presume that no cooperativity among different TFs exists. If there is also no cooperativity among TFs of the same type, it follows that KAi,ni = KniAi in FO and ΔGni = ni·ΔGi in TDM, where KAi is the binding constant of a single TF Ai to the promoter, and ΔGi presents the free energy change between the reference state and the state in which one binding site is occupied by TF Ai. Both approaches presume monomeric TF binding, but they can be adjusted to fit multimeric binding by raising Hill coefficients. Another presumption they make is that all TF binding sites have the same binding affinity for the same TF type on the same promoter. If the latter does not hold, one needs to regard each binding site independently, which again leads to exponential growth of the number of observed chemical species. However, the biological plausibility of this presumption has been justified thoroughly in the literature (Bintu et al., 2005a; Werner et al., 2007; Zeiser et al., 2007; Giorgetti et al., 2010; Lebar et al., 2014).
2.1.2. Average promoter state approximation
Although FO and TDM significantly decrease the computational effort, both still perform a significant number of calculations that are necessary to determine the weights of promoter states in each time step of the simulation. We propose a simplified approach, that is, APSA, which is able to accurately simulate the dynamics of more complex GRNs. APSA reduces the time complexity of promoter state approximation from
Note that TF binding sites can be regarded independently when there is no competition between the TFs. Finally, we can describe the average promoter state as a set of average numbers of bound TFs of each type, that is,
2.2. Evaluation of transcriptional activity
Once the promoter states or their probabilities are evaluated, we can use them to determine the transcriptional activity of the observed promoter. We propose a compact way of presenting different promoter states’ transcriptional activity, namely EPBM, which derives from the matrix presentation. The dimensionality of the EPBM matrix is defined by the number of different TF types that bind to their corresponding binding sites. If m is the number of different TFs, the promoter with n binding sites would require an m-dimensional matrix with n + 1 being the size of each dimension. For example, a promoter with n binding sites regulated by both activator and repressor yields an expression profile matrix
Alternatively, we can describe expression profiles with the m-dimensional interpolation function corresponding to the EPBM matrix presentation. It is necessary to have such a presentation when using APSA, since it generally yields noninteger numbers corresponding to the average numbers of bound TFs. To determine the promoter activity in this case, we have to interpolate values between different promoter states’ expression profiles. This can be achieved, for example, with the weighted sum of all valid nearest promoter states. Another option is to define an m-dimensional interpolation function, that is, ρ(·), that presents the promoter expression profiles and substitutes the matrix presentation. In both cases, we evaluate promoter activity as ρ = ρ(
2.3. Updating concentrations
After promoter activity has been evaluated, it can be used to update concentrations of the observed species with respect to slow reactions, that is, transcription, translation, and degradation. This can be achieved with the application of ODE solvers or variations of the stochastic simulation algorithm (Gillespie, 1977). For example, when using ODE solvers, the selected mRNA dynamics can be described as follows:
where P1, …, Pk and ρ1, …, ρk denote concentrations and evaluated transcriptional activity of promoters expressing mRNA species m, and γ denotes the degradation rate of m. Equations governing the dynamics of mRNA species can be integrated into the system of ODEs together with the description of other slow reactions to obtain a functional model of the observed GRN.
3. Case Study: Analysis of NF-κB Oscillatory Response
We demonstrate the application of the proposed computational framework on the analysis of NF-κB oscillatory response. In the light of recent progress, indicating the noncooperative nature of the NFKBIA gene TF binding sites (Giorgetti et al., 2010), we were interested in how different numbers of the observed TF binding sites in a combination with different expression hypotheses affect the dynamics of the analyzed system.
3.1. Model description
NF-κB is a TF that is crucial for the induction of genes in response to inflammatory stimuli, thus regulating inflammation and immune response in mammalian cells (Cheong et al., 2008). In certain conditions, NF-κB may exhibit oscillatory behavior in response to sufficient concentrations of a stimulant tumor necrosis factor-alpha (TNF-α). However, it has only recently been shown that many of NF-κB's target genes contain clustered DNA binding sites with negligible cooperativity, resulting in an analog inflammatory response, where a graded increase in TNF-α concentration results in a graded increase in nuclear NF-κB concentration (Giorgetti et al., 2010). The inhibitor of NF-κB activity, IκBα, is encoded by the NFKBIA gene, one of the most common of NF-κB's target genes. NF-κB and IκBα are thus connected via a negative feedback loop, a necessary prerequisite for the oscillatory response. Production of IκBα is triggered by the presence of IκB kinase (IKK) that is induced by TNF-α, which phosphorylates IκBα, resulting in its saturated degradation (Basak et al., 2012). Saturated degradation of IκBα induced at a constant level of IKK concentration introduces a time delay, which is a necessary requirement that can lead to sustained oscillations in combination with the core negative feedback loop (Mengel et al., 2010). Note, however, that our model ignores the presence of two other IκB isoforms, namely IκBβ and IκBε, which are otherwise responsible for dampening the oscillations on larger time scales (Cheong et al., 2008).
We adopted a three-dimensional model presented in Krishna et al. (2006) to account for different numbers of TF binding sites. We observed the time course of nuclear NF-κB concentrations, cytoplasmic concentrations of IκBα and its transcript using the following model:
where x, y, and z are proportional to NF-κB, IκBα transcript, and I κ B α concentrations, respectively. Parameters A, B, C,
With the additive hypothesis, the transcriptional response is proportional to the number of occupied binding sites. With the all-or-none hypothesis, the promoter is active if all of the n binding sites are occupied. Finally, with the singular hypothesis, transcriptional response is triggered by the binding of an arbitrary (>0) number of TFs. Because we are dealing with a single TF, the dimensionality of the EPBM matrix is (n + 1) × 1 and has the following forms:
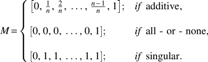
As described in Evaluation of Transcriptional Activity section, it is necessary to interpolate these matrices to use them when modeling with the APSA method.
3.2. Analysis
We analyzed the features of oscillations in terms of their periods, amplitudes, and spikiness, a common phenomenon caused by the saturated degradation of a regulator (Mengel et al., 2010). Spikiness was evaluated according to the measure
First, we compared the results of different promoter state evaluation methods, namely FO (which outputs identical results such as TDM) and APSA, on our case study with different expression hypotheses on promoters with five TF binding sites (Fig. 1). Note that for one binding site all hypotheses yield equal results.
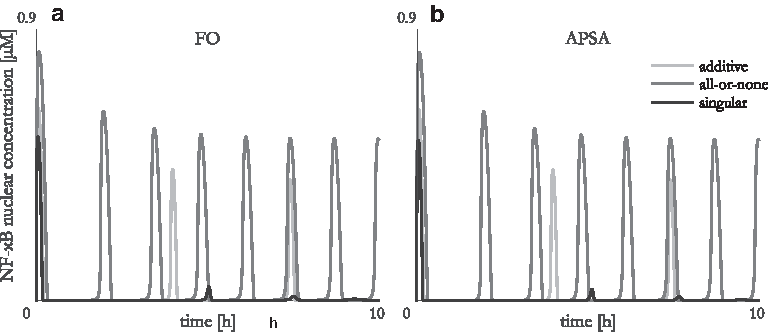
Comparison of results obtained with fractional occupancy (FO)
As there is no difference in the results obtained with the additive and all-or-none expression hypotheses and no significant difference in the results obtained with the singular hypothesis, our further analyses were based only on the APSA method, due to its computing speed. The reader can refer to additional results in Supplementary Material that justify the suitability of APSA with respect to FO.
Next, we analyzed the effects of IKK concentrations on the oscillatory dynamics in dependence on the number of modeled TF binding sites (Fig. 2), with the tuning of model parameter C (see NF-κB Model Derivation section in Supplementary Material). Results indicate that the number of TF binding sites does not affect the dynamics of the system with the additive hypothesis. However, with the all-or-none and singular hypotheses, the increase in the number of TF binding sites has an opposing effect. Although it increases the oscillatory region with the all-or-none hypothesis, it decreases the region with the singular hypothesis. Moreover, the all-or-none hypothesis increases the maximal amplitudes of oscillations in the middle of the oscillatory region and drastically increases periods of oscillations in the close proximity of the bifurcation point. The values remain more or less pertained in other regions and with the singular hypothesis. The all-or-none hypothesis, however, decreases the spikiness of obtained oscillations with at least four binding TF sites and larger IKK concentrations, that is, far from the bifurcation point. Spikiness is pertained within the remaining oscillatory region with the singular expression hypothesis.
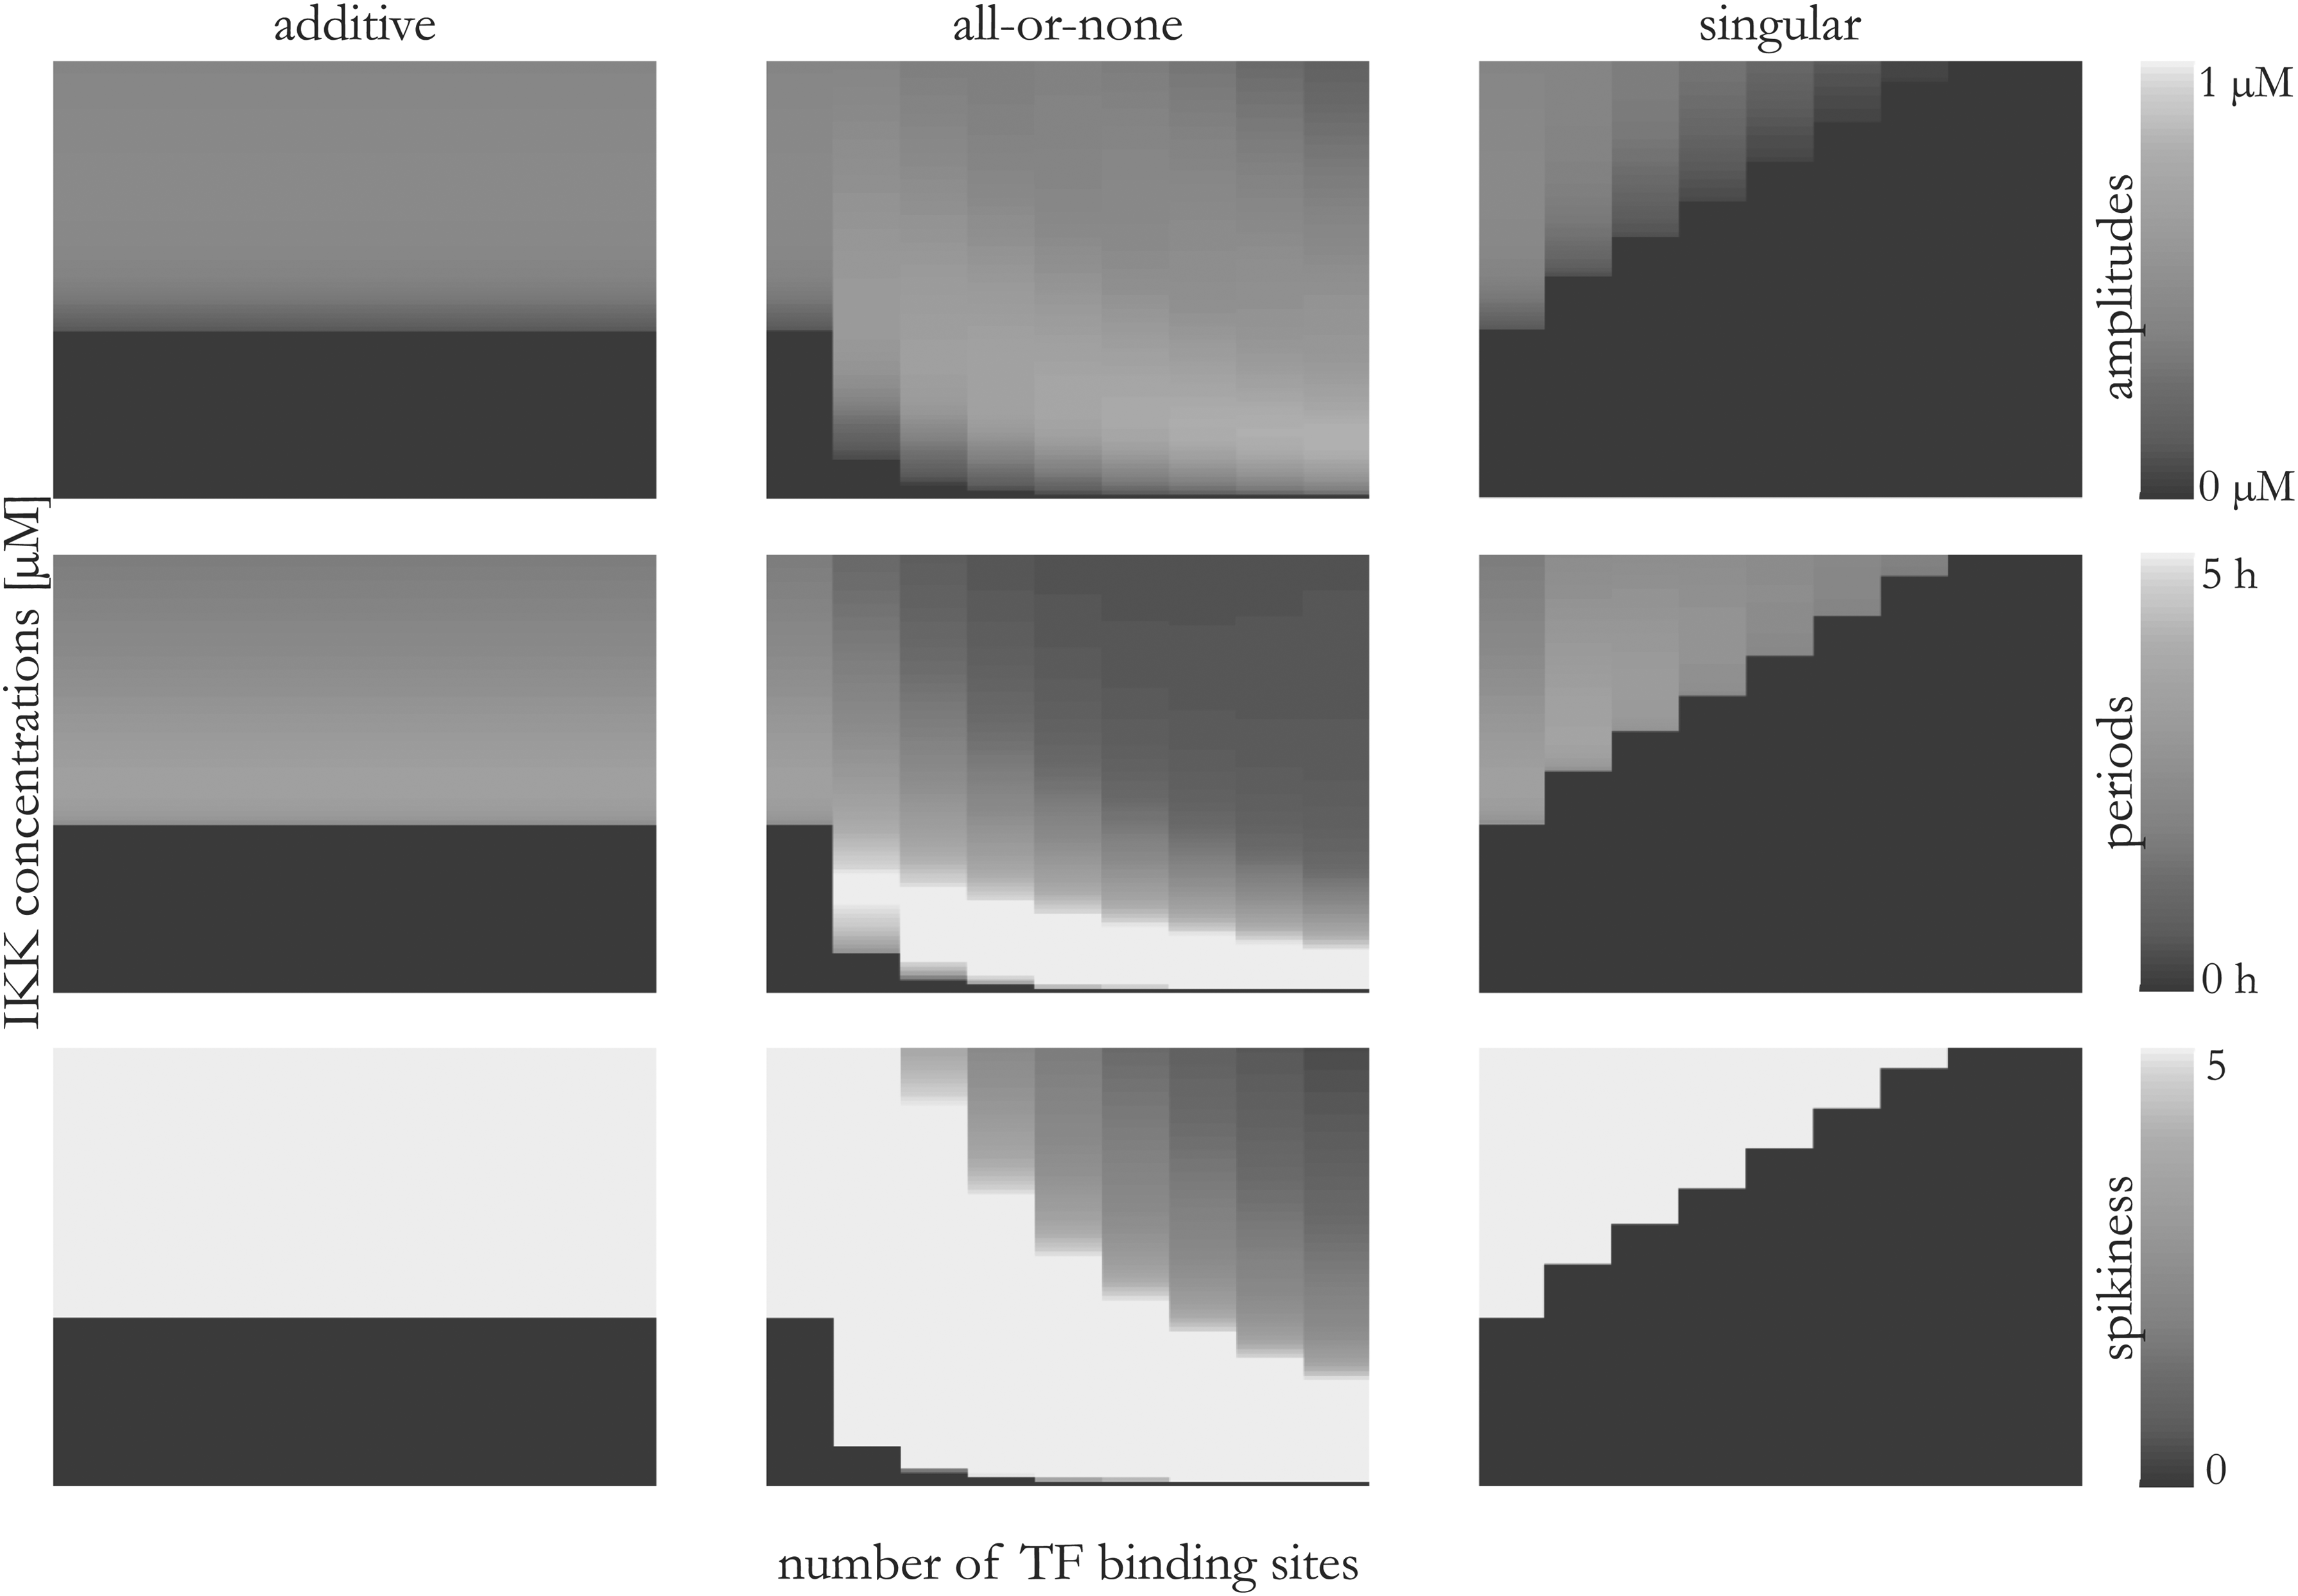
Effects of IκB kinase (IKK) concentrations (linear range from 0 to 1 μM) in a combination with number of TF binding sites (linear range from 1 to 10) on nuclear nuclear factor kappa B (NF-κB) oscillation amplitudes (top row), periods (middle row), and spikiness (bottom row) with the additive (left column), all-or-none (middle column), and singular (right column) expression hypothesis. Amplitude values are measured in μM, and period values are measured in hours. Black color represents stationary behavior (no oscillations).
At last, we analyzed the oscillatory dynamics around the nominal values of kinetic parameters describing the model with perturbations of two parameters at the same time and again with the variations of the number of TF binding sites. We presumed that the IKK concentration is constant during the course of each simulation, since we only observed the system response for a limited amount of time. According to IKK degradation rates used in Zambrano et al. (2014), IKK concentrations do not change significantly within the observed time interval. We perturbed other parameter values by multiplying them with logarithmically spaced values from an interval [10−2, 102]. Results of our analysis are presented in Figures 3–5 with the additive, all-or-none, and singular expression hypothesis, respectively, and for perturbations of parameters A and B (additional results obtained with FO and results for variations of different parameters are presented in Supplementary Material).

Effects of A (y axis) and B (x axis) parameter perturbations on nuclear NF-κB oscillation amplitudes (top row), periods (middle row), and spikiness (bottom row) for different numbers of TF binding sites ranging from one (first column) to five (last column) with the additive expression hypothesis. Amplitude values are measured in μM, and period values are measured in hours. Perturbations were performed by multiplying the parameters with logarithmically spaced values from an interval [10−2, 102]. Black color represents stationary behavior (no oscillations).
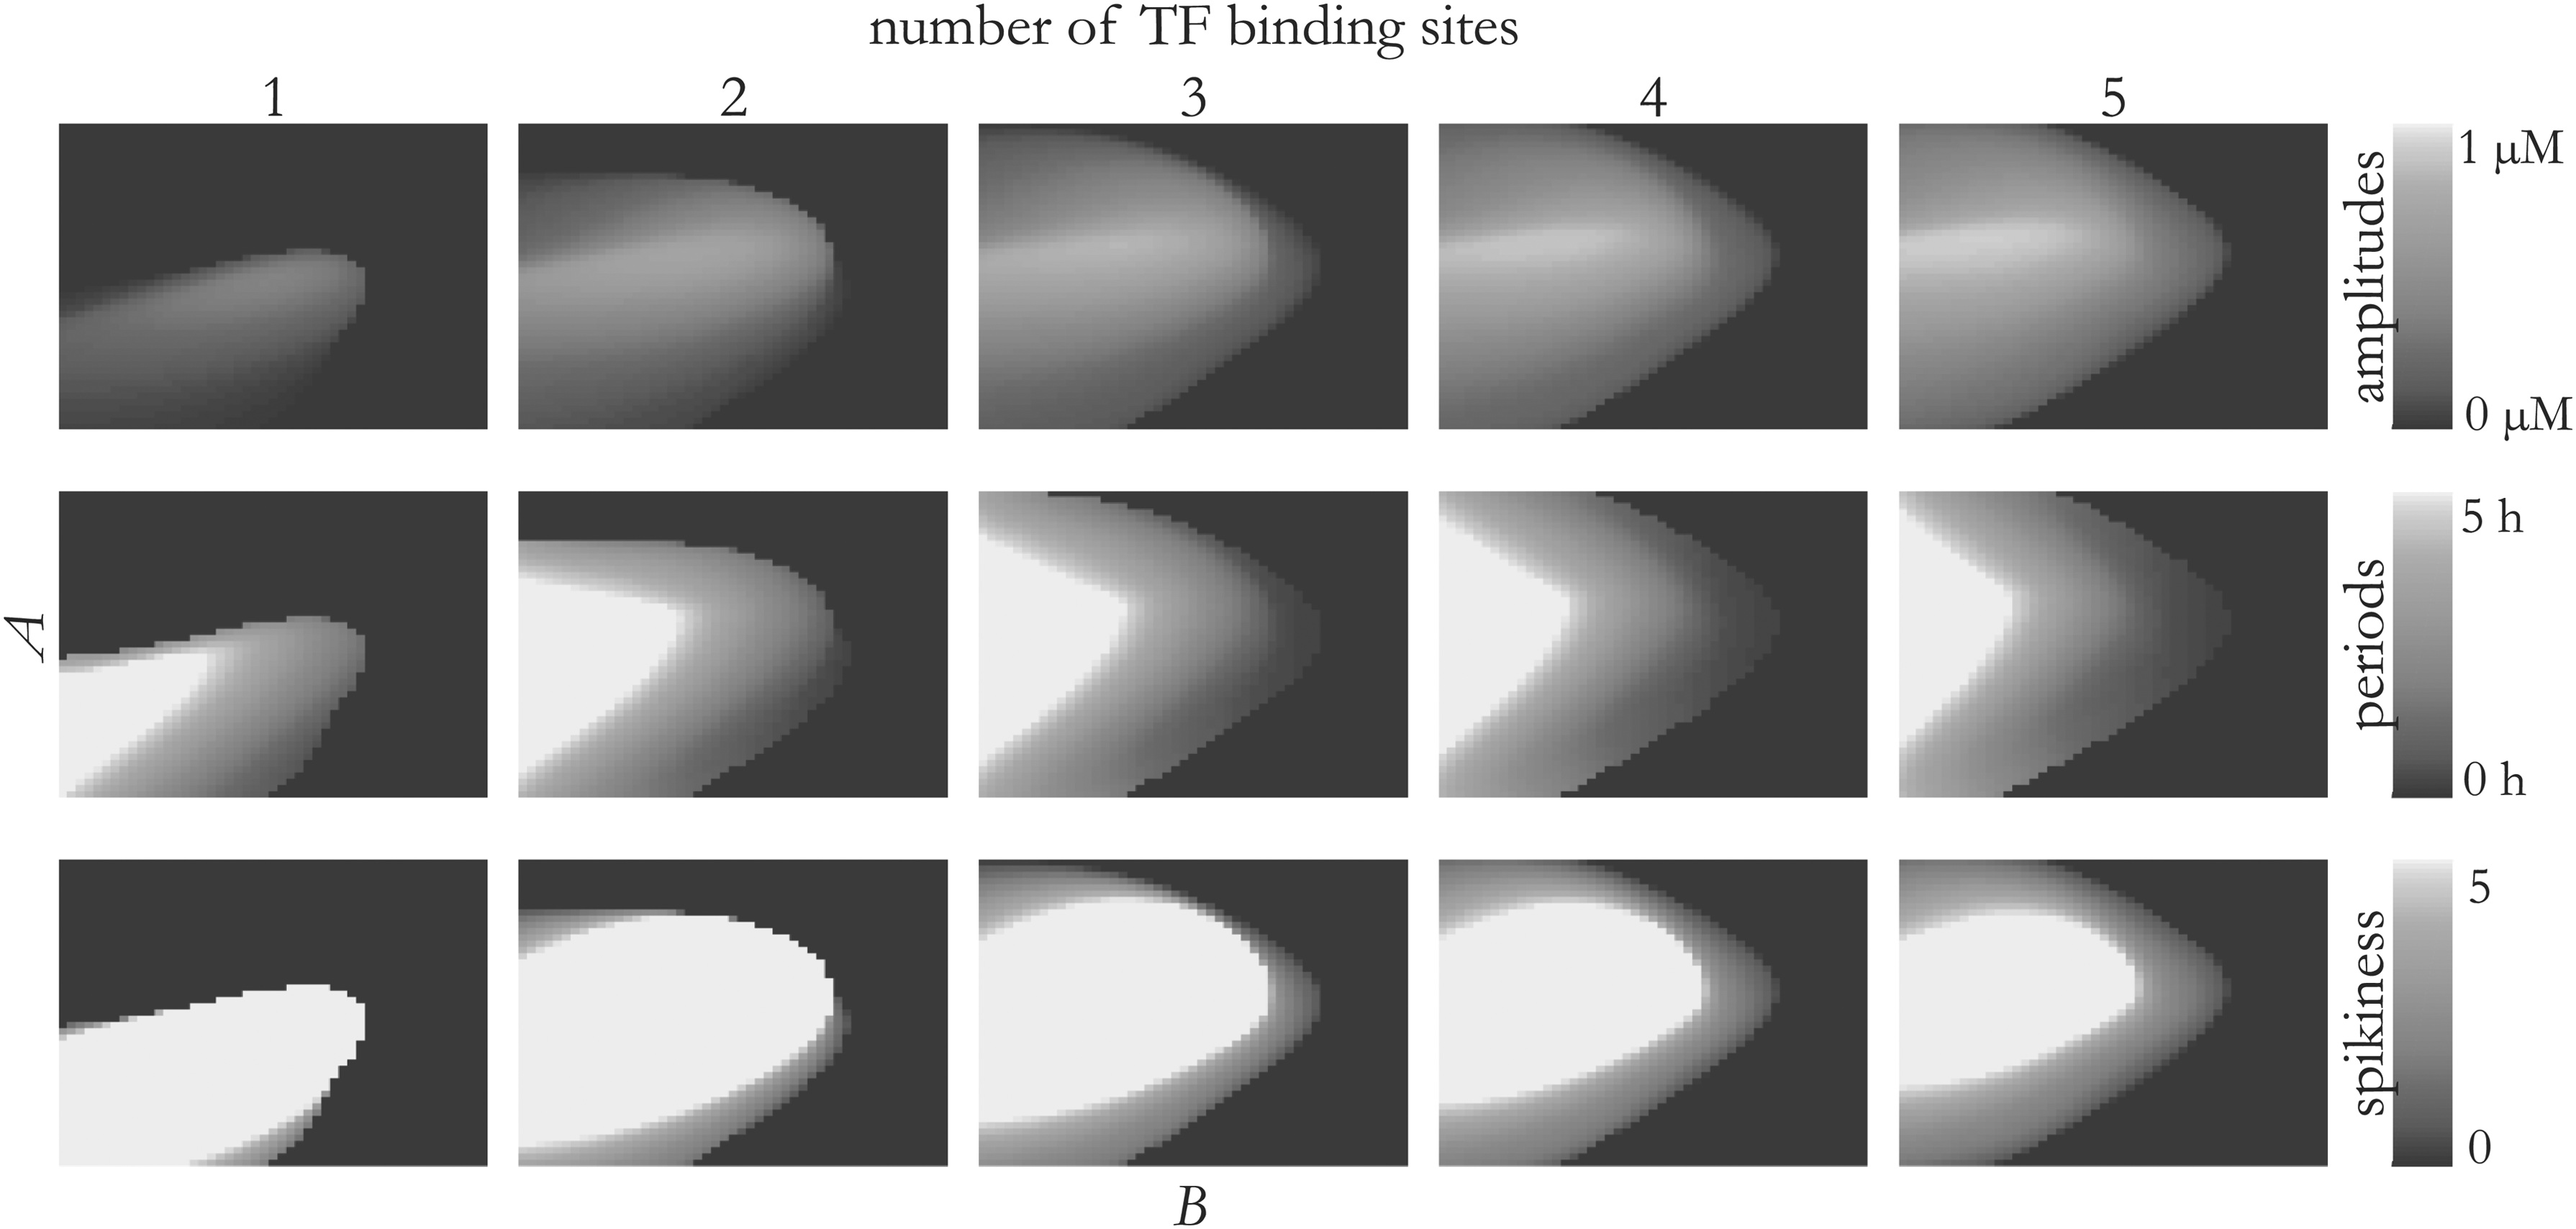
Effects of A (y axis) and B (x axis) parameter perturbations on nuclear NF-κB oscillation amplitudes (top row), periods (middle row) and spikiness (bottom row) for different numbers of TF binding sites ranging from one (first column) to five (last column) with the all-or-none expression hypothesis. Amplitude values are measured in μM, and period values are measured in hours. Perturbations were performed by multiplying the parameters with logarithmically spaced values from an interval [10−2, 102]. Black color represents stationary behavior (no oscillations).
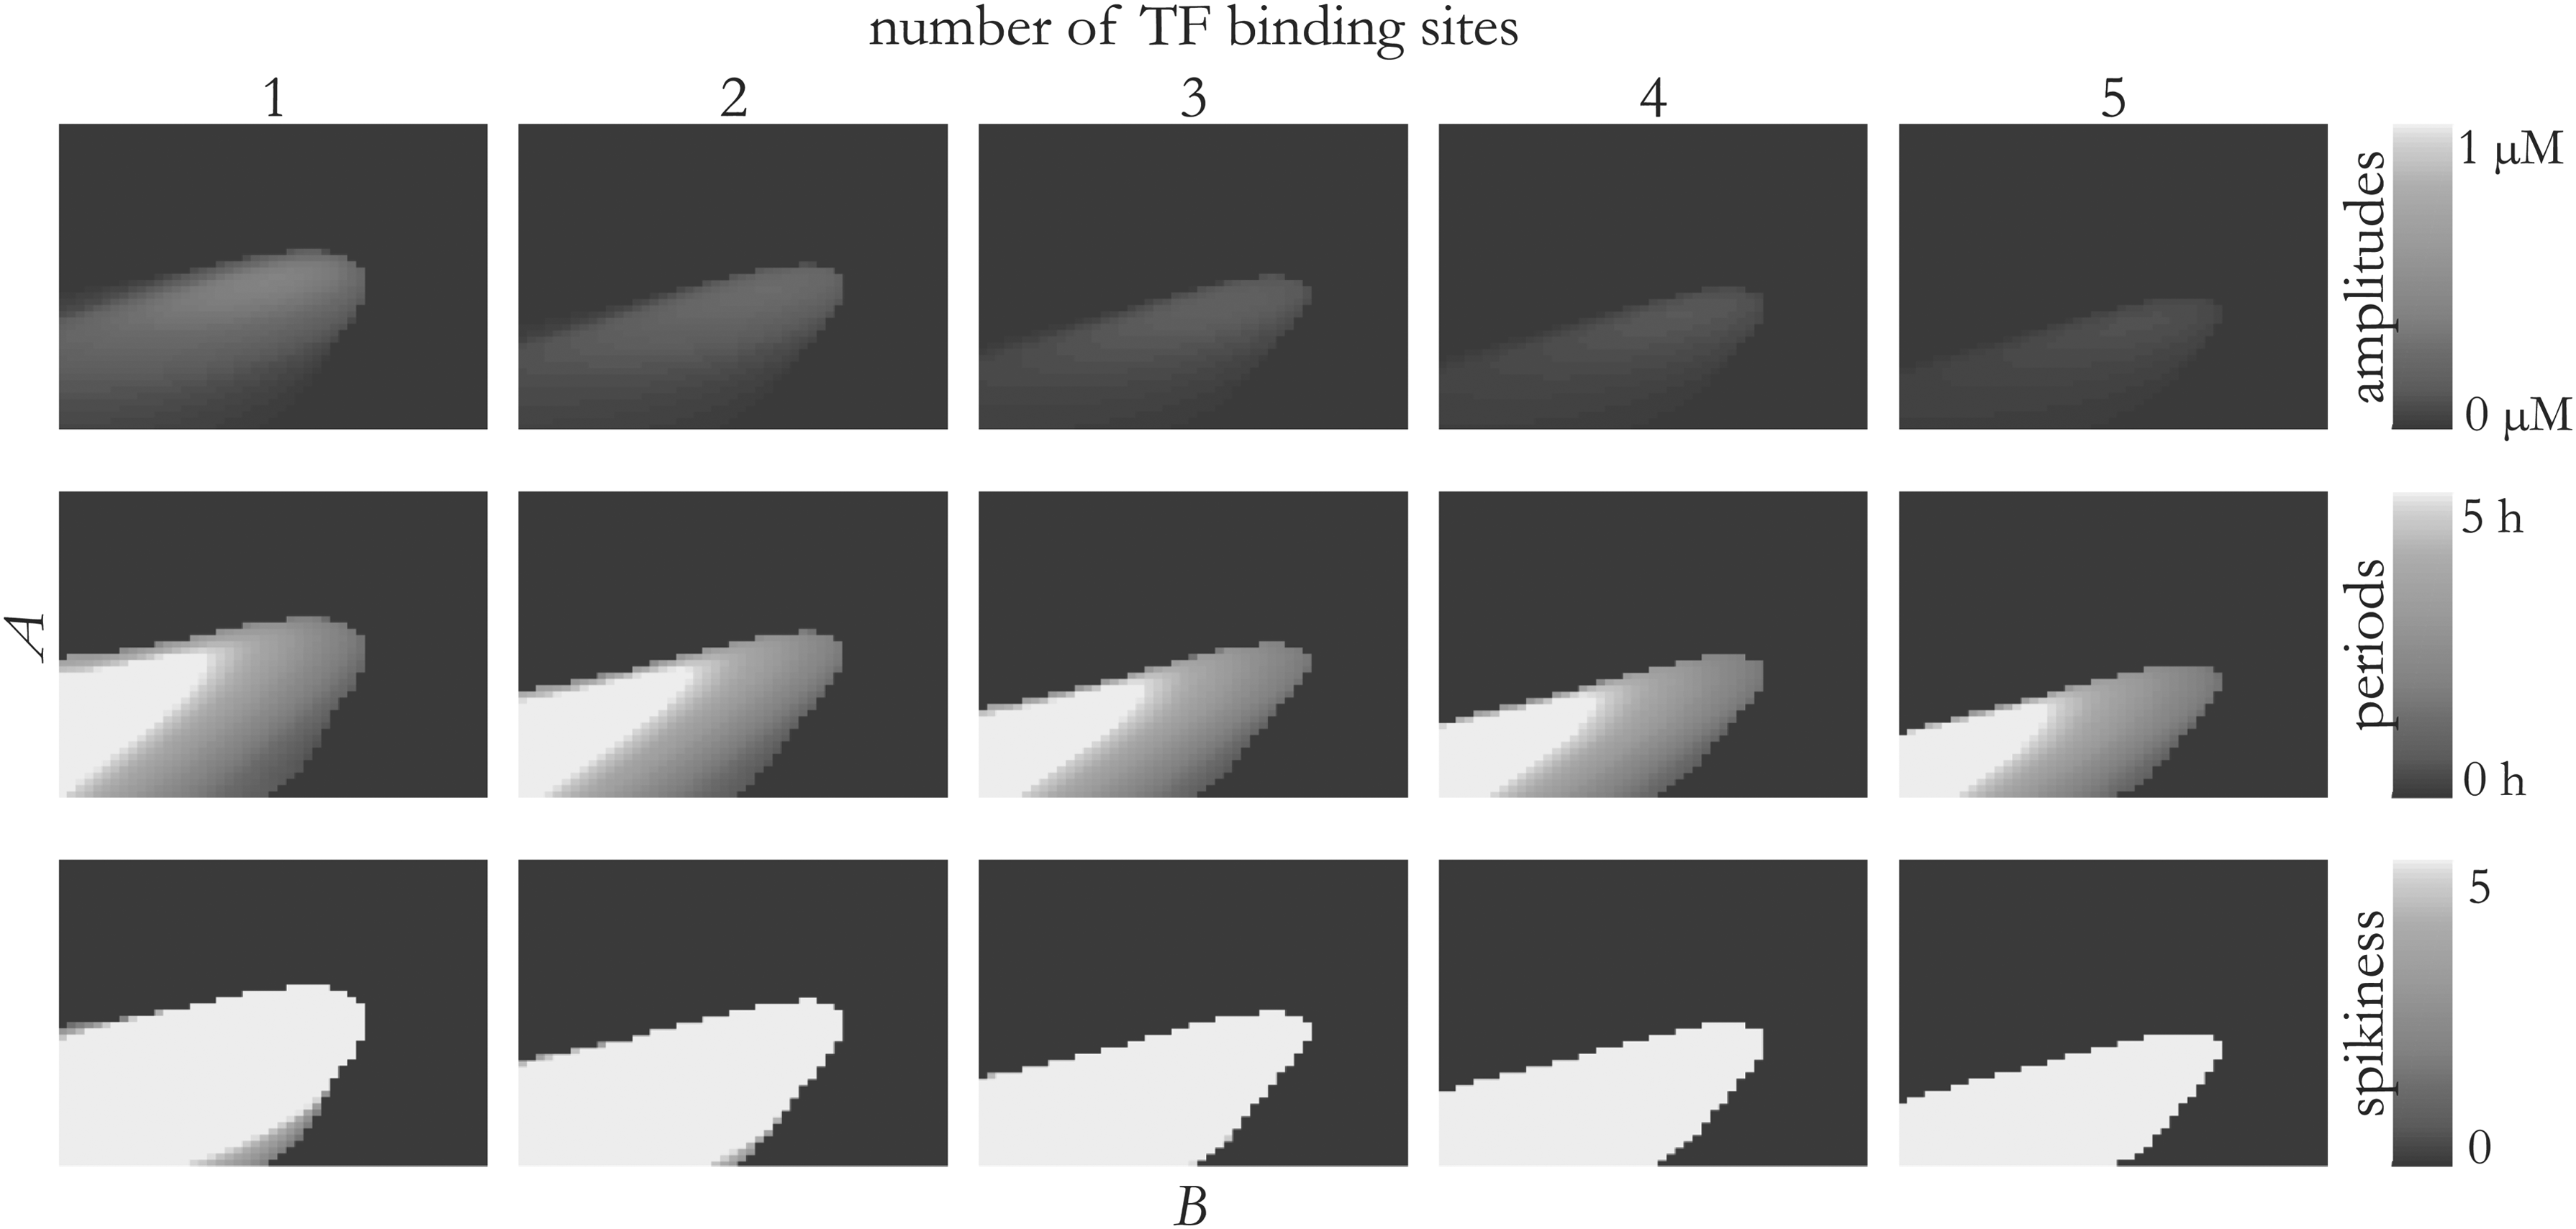
Effects of A (y axis) and B (x axis) parameter perturbations on nuclear NF-κB oscillation amplitudes (top row), periods (middle row) and spikiness (bottom row) for different numbers of TF binding sites ranging from one (first column) to five (last column) with the singular expression hypothesis. Amplitude values are measured in μM, and period values are measured in hours. Perturbations were performed by multiplying the parameters with logarithmically spaced values from an interval [10−2, 102]. Black color represents stationary behavior (no oscillations).
Oscillatory regions follow the same trends as when changing the IKK concentrations. Similar dynamics is observed for amplitudes of oscillations with the all-or-none expression hypothesis, which are increased in the middle of the oscillatory region. On the other hand, two other hypotheses more or less pertain the maximal oscillation amplitudes with different numbers of TF binding sites. Similar behavior is reflected by periods of oscillations. Their values are relatively low near the bifurcation point and increase with the distance from it. Higher numbers of TF binding sites increase this distance with the all-or-none hypothesis and decrease it with the singular hypothesis (especially near bifurcations caused by increasing parameter A). Although spikiness of oscillations is pertained with the additive and singular hypotheses, it is decreased near bifurcation points with the all-or-none hypothesis.
4. Conclusion
Even though the majority of state-of-the-art computational analyses omit explicit modeling of individual TF binding sites within the cluster, we demonstrated that variations in dynamics caused by different promoter expression hypotheses and different numbers of observed TF binding sites should not be ignored in the exact quantitative modeling of biological systems. We described a computational framework that can be applied to address this problem. We additionally proposed two novel methods within the framework, that is, APSA to efficiently evaluate promoter states, and EPBM to describe the transcriptional activity of the observed promoters. The introduced framework allows us to evaluate the dynamics of the observed system in dependence on different promoter expression hypotheses, different numbers of observed TF binding sites, and different variations of other parameters describing the system in a straightforward manner.
We demonstrated the application of the proposed framework on a case study of NF-κB oscillatory response analysis. Our results indicate that a variation of the number of TF binding sites in a combination with different promoter expression hypotheses, that is, additive, singular, and all or none, yield substantially different results in essentially the same system. We showed that the number of TF binding sites may, indeed, play a key role in determining the overall system response. On the one hand, the number of TF binding sites does not change the dynamics of the system in any way by using additive hypothesis. On the other hand, the number of observed TF binding sites considerably changes the system's response with the remaining two hypotheses. The oscillatory ranges decrease with respect to the number of observed TF binding sites with the singular hypothesis, whereas they increase with the all-or-none hypothesis. We reason that to perform complete, detailed analyses of regulatory networks or their smaller sub-networks, presence and effects of multiple TF binding sites on the system dynamics should not be omitted.
All of the approaches for evaluating promoter states presented within our computational framework presume that regulating TF concentrations are much higher than binding site concentrations. This presumption is commonly applied to the modeling of GRNs and metabolic networks together with different acknowledged mathematical formalisms, such as Hill equations (Alon, 2007) or Michaelis–Menten kinetics, in which we presume that the substrate concentration is much higher than the enzyme concentration. However, this presumption is not always valid, especially when we are dealing with large clusters of TF binding sites and/or several copies of each promoter regulated by these sites. FO and TDM models are unable to retain the quantitative accuracy in such cases. APSA, however, can be extended to cope with such scenarios, but only for small numbers of different TFs, which bind to the same binding site type [see derivation in Supplementary Material for one TF per type and (Wang, 1995) for two TFs per type]. The cost of this accuracy is additional complexity of equations behind the model. However, these do not considerably increase the computational complexity of simulations.
Finally, we end this discussion with suggestions of further potential applications of the presented approaches. Research and analysis of GRNs goes hand in hand with computational modeling, which is sometimes accompanied by easy-to-use computational tools. Such tools [e.g., Copasi (Mendes et al., 2009), TinkerCell (Chandran et al., 2009), or CellDesigner (Funahashi et al., 2006)] already provide a variety of functionality regarding the construction and analysis of GRNs behind intuitive graphical user interfaces with the purpose to speed up and simplify the process of computational analyses that an end user would like to perform. However, to our knowledge, none of the existing tools provide accurate modeling of the multiple TF binding sites at the present day. Following the recent trends in synthetic biology, which demonstrate progress in the engineering of several different types of monomeric noncooperative TFs, we anticipate the need for integration of such modeling techniques. Although it is sometimes possible to work around these limitations with additional assumptions about the model itself, this would not be necessary if computational frameworks such as the one presented in this text were included as one of the many embedded features.
Footnotes
Acknowledgments
The research was partially supported by the scientific research program Pervasive Computing (P2-0359) financed by the Slovenian Research Agency in the years from 2009 to 2017 and by the basic research and application project Designed Cellular Logic (J1-6740) financed by the Slovenian Research Agency in the years from 2014 to 2017.
Author Disclosure Statement
No competing financial interests exist.
References
Supplementary Material
Please find the following supplemental material available below.
For Open Access articles published under a Creative Commons License, all supplemental material carries the same license as the article it is associated with.
For non-Open Access articles published, all supplemental material carries a non-exclusive license, and permission requests for re-use of supplemental material or any part of supplemental material shall be sent directly to the copyright owner as specified in the copyright notice associated with the article.
