
Abstract
Abstract
A nonparametric model of smooth muscle tension response to electrical stimulation was estimated using the Laguerre expansion technique of nonlinear system kernel estimation. The experimental data consisted of force responses of smooth muscle to energy-matched alternating single pulse and burst current stimuli. The burst stimuli led to at least a 10-fold increase in peak force in smooth muscle from Mytilus edulis, despite the constant energy constraint. A linear model did not fit the data. However, a second-order model fit the data accurately, so the higher-order models were not required to fit the data. Results showed that smooth muscle force response is not linearly related to the stimulation power.
1. Introduction
A
Determination of the most parsimonious mathematical model can be a challenging task, and the model form and optimal parameters can change from one muscle type to another. Frey-Law and Shields (2006) compare three models when evaluating force development in electrically stimulated, paralyzed mammalian muscle. The first model is a linear model, while the second and third consist of two 6-parameter nonlinear models. Their comprehensive study finds that the nonlinear models provide more accurate results when considering high-frequency stimulation trains, while the linear model provides accurate predictions of the force resulting from low-frequency stimulation. The authors determined that the second-order nonlinear model is the best overall for the stimulation sequences tested. Wilson et al. (2012) compared several models, including both linear and nonlinear, to predict locust hindleg response to electrical stimulation. Like Frey-Law and Shields (2006), they found that the linear model did not capture the nonlinear dynamics, which are essential for a true depiction of muscle force response to electrical stimulation.
Parametric models of mammalian smooth muscle have also been developed. Du et al. (2009) introduced a parametric model of gastrointestinal smooth muscle cells, although from their results, it was not clear that a nonlinear model was necessary to predict calcium concentrations within the cell. Burstyn et al. (2007) developed a nonlinear parametric model of uterine smooth muscle to predict force output. In this case at the same energy level, an intermittent train led to a higher force output compared with a single pulse. A nonparametric modeling technique can provide a preliminary test to determine whether a muscle system's response is linear or nonlinear. Our experiments focus on determining whether or not a linear model is sufficient to explain the smooth muscle force response to the particular types of stimulation patterns presented by Burstyn et al. (2007).
2. Methods
Specimens of Mytilus edulis were purchased fresh locally (
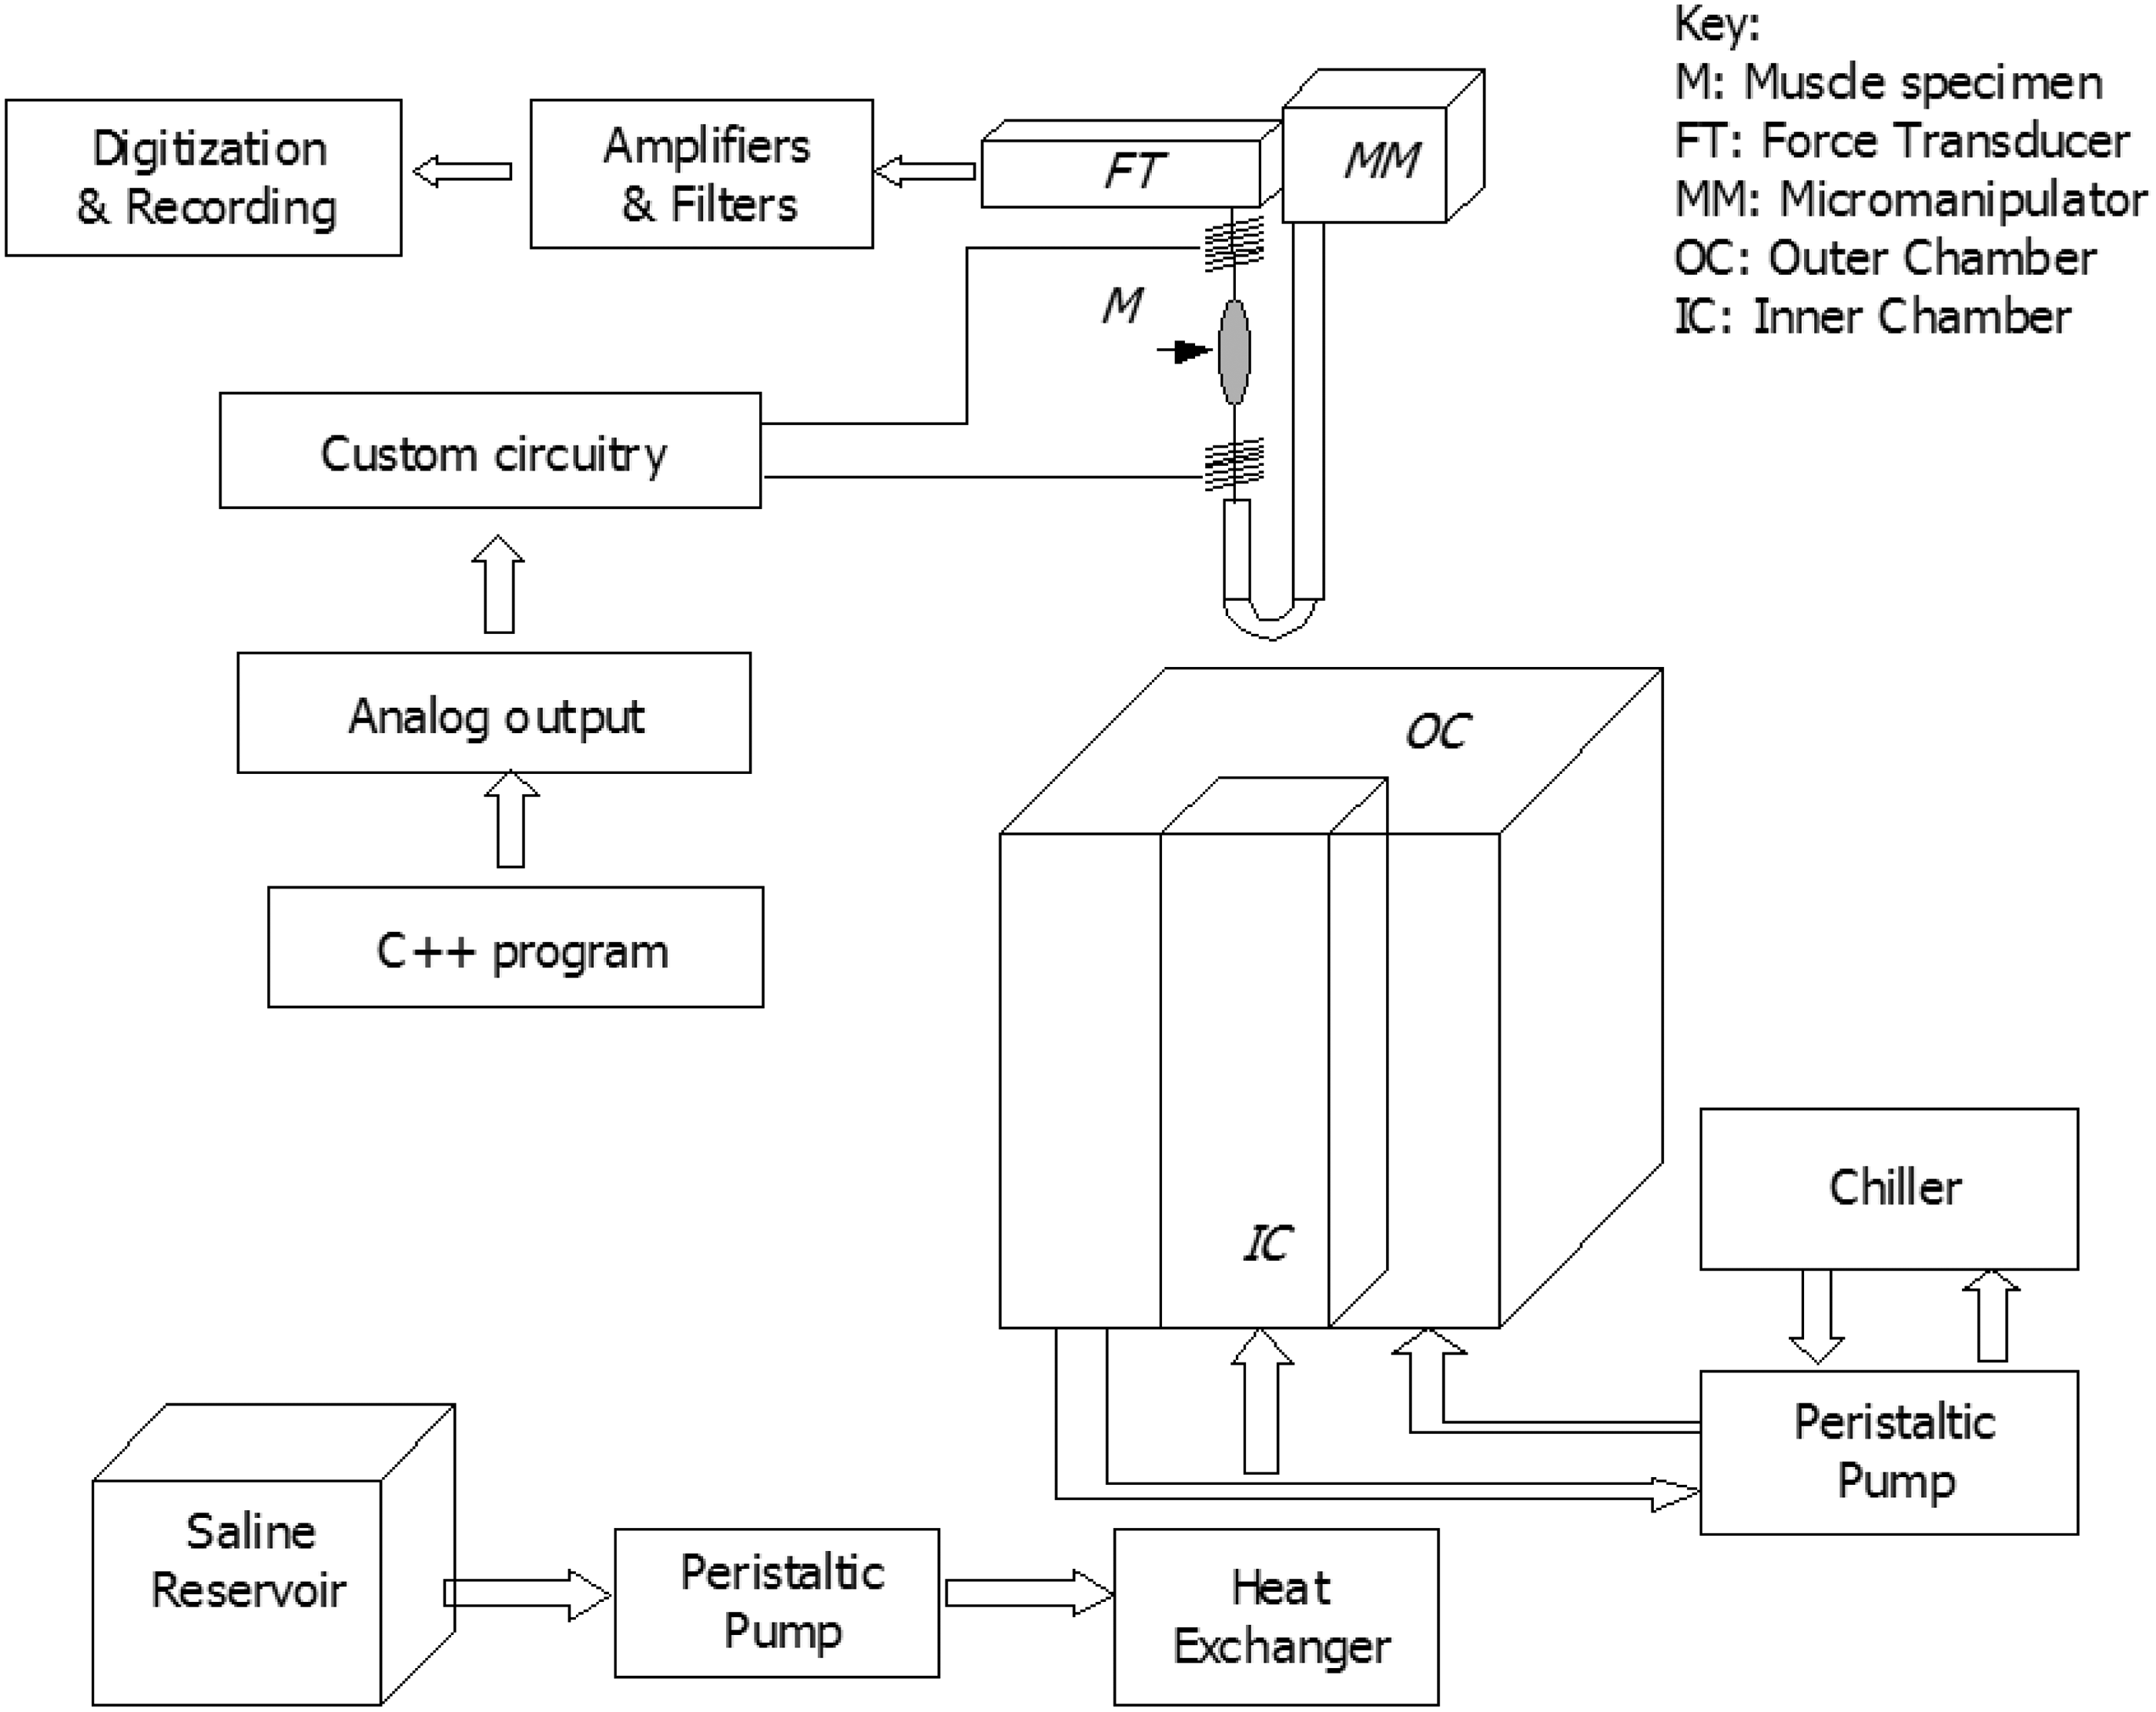
Diagram of apparatus for performing wet experiments.
A digital-to-analog converter card (PCI-6036E; National Instruments, Austin, TX) within a computer (Z-Pro series computer; IBM, Armonk, NY) provided a command signal to a custom-built, electrically isolated amplifier circuit that modulated the muscle stimulation current. A program written in C++ controlled the PCI-6036E multifunction card and custom circuit to produce arbitrary waveforms for stimulating muscle. The current was applied through upper and lower stainless steel electrodes fashioned from wire (0.015" diameter, grade 316L; Malin Co., Cleveland, OH) and immersed in the saline. The diagram of the arrangement appears in Figure 1.
Each current burst had a frequency of 3.34 Hz to provide 10 pulses, each of 100 milliseconds width, in ∼3 seconds, which was a stimulation sequence similar to that used by Burstyn et al. (2007). A single 1-second long pulse at 80 mA was issued 3 minutes before and after the 80 mA burst to serve as a control pulse against which to compare the response to the current burst. The single pulses and current bursts were energy-matched so as to reveal which type of stimulation could elicit greater force response if the energy input was equivalent in each case. The second control pulse also verified that the muscle was undamaged. The five preparations tested for peak force development were considered statistically independent, and each preparation was subjected to 10 sets of bursts as well as 10 pairs of single long pulses.
The Biopac force transducer measured muscle force development using an amplifier (Validyne CD19A, Northridge, CA) that provided gain of 1000. A secondary, custom-made external amplifier provided additional gain of 3.2 before the analog-to-digital converter unit (DI-194RS; Dataq, Akron, OH) sampled the signal at 120 Hz. An analysis of variance was performed using MATLAB R2011b (MathWorks, Newton, MA).
The nonparametric modeling technique required the estimation of a set of system kernels by the method of least squares. The nonparametric approach required data input consisting of a resampled version of the force and stimulation data, which represented the output and input, respectively. The Laguerre orthonormal basis was chosen to reduce the computational load compared with the method of Wiener (1958), and the resulting Volterra model provided a prediction of the muscle force output. The nonparametric model describes the system by the following equation:
The system input is represented by x(t) and the output is represented by y(t). The symbol k with a subscript represents a kernel, and each integral represents a contribution of that kernel to the estimate of the system output, y(t). The expressions x1(t − τ1) and x2(t − τ2) represent time-shifted versions of the input signal x(t). The DC component of the output is denoted by k0, and the first-order kernel is represented by k1. The second-order kernel is represented by k2, and so on if higher orders are added. Addition of more terms to the estimate could improve the accuracy.
Each kernel, ki, was computed according to the method of French and Marmarelis (1999):
In Equations (2) and (3), ci represents the Laguerre coefficients to be computed and bj represents the Laguerre orthonormal basis. L represents the memory length.
The fit of the nonparametric model prediction was assessed by calculating the normalized mean square error (NMSE) as defined in the following equation:
Yp denotes the predicted force value and Ydata represents the measured force value. The NMSE is interpretable as percent deviation from the peak response.
3. Results
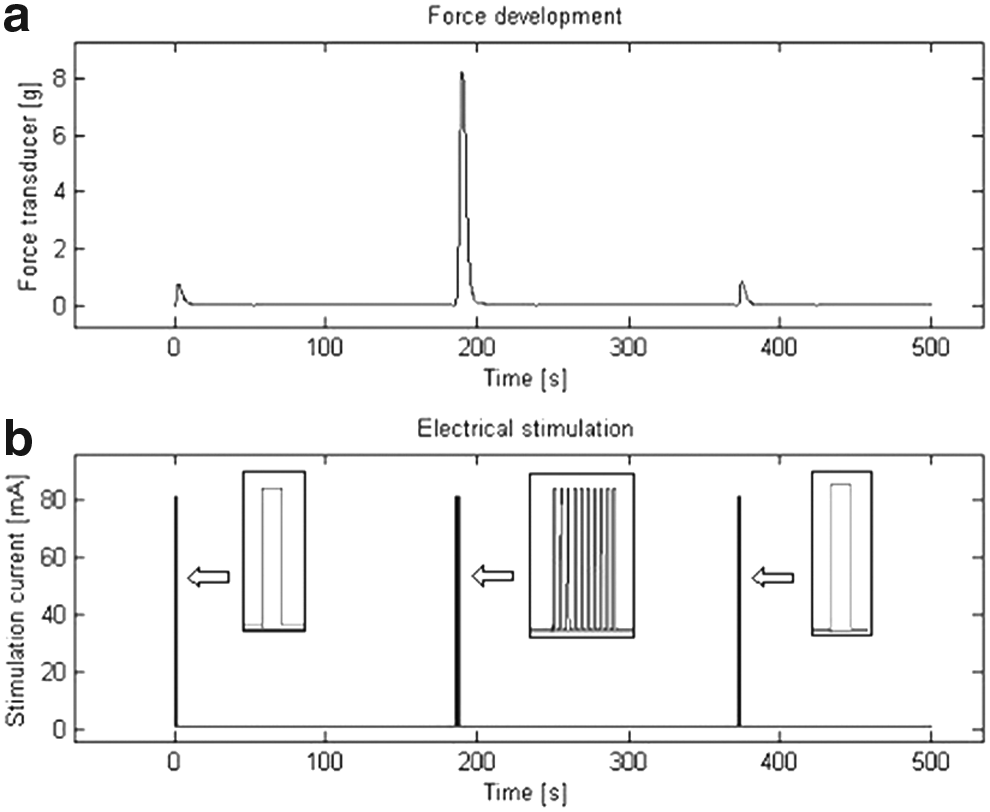
A sample segment of the stimulation and the resulting force output can be seen in Figure 2. Figure 2b shows the electrical pulse that was applied to the muscle, while Figure 2a reveals the force response. At the three drive levels, the current burst shown in the center produced greater peak force than the energy-matched single pulses as shown in Figure 2. Table 1 compares the average peak force values that were measured over 10 trials when we stimulated the smooth muscle specimen with single 1-second-long pulses and bursts of current.
An analysis of variance on the 10 repeated stimulation data points for each of the 5 specimens tested the nil hypothesis that the current burst and a single long pulse of equal energy elicited equal force responses. The analysis of variance results summarized in Table 2 revealed that the two treatments were not equal, and mean force production for a current burst is statistically different from mean force production for single long pulses.
Next, force data were analyzed with the nonparametric modeling technique (Marmarelis, 2004). Results for the average of five preparations are shown in detail below and compared with linear and nonlinear model predictions. Figure 3a shows a linear model prediction compared with measured force output of the first preparation. It is evident by inspection that the linear model overestimates the force response to the single pulse. Figure 3c reveals that the linear model underestimates the force response to current burst stimulation. For this linear model, the NMSE value was ∼6.71%.

We also fitted the measured muscle force response to a nonparametric nonlinear (second-order) model. The second-order model predictions are pictured in Figure 3b and d, and this model correctly predicted that a current burst produced greater force output. The NMSE value for this nonlinear model was 0.42%. A third-order model did not add significantly better fit (NMSE = 0.18%). By inspection, we see that the second-order model is the minimal model for predicting force output with a burst of rectangular pulses.
The optimal number of Laguerre functions and memory length were determined by trial and error, and the first-order kernel for the second-order model appears in Figure 4. The first-order kernel shows a strong positive peak within the first several seconds and it diminishes within 30 seconds. The second-order kernel from this model appears in Figure 5, and it reveals a strong nonlinear component of the muscle response.
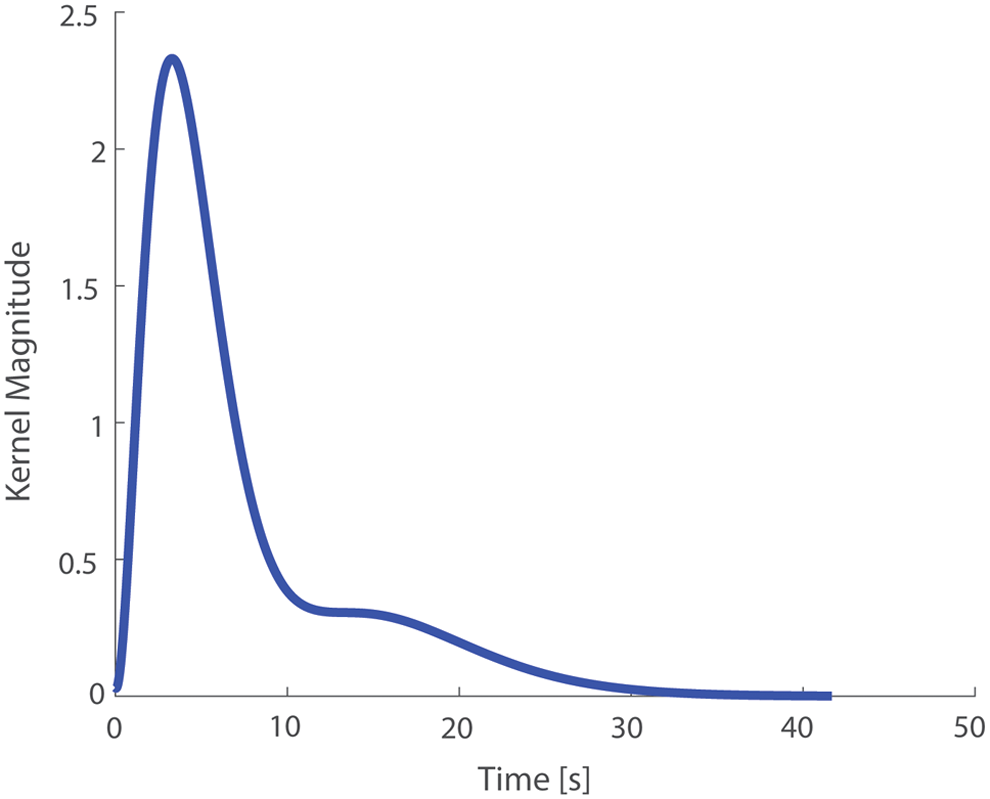
First-order kernel from the second-order model for average of five specimens.
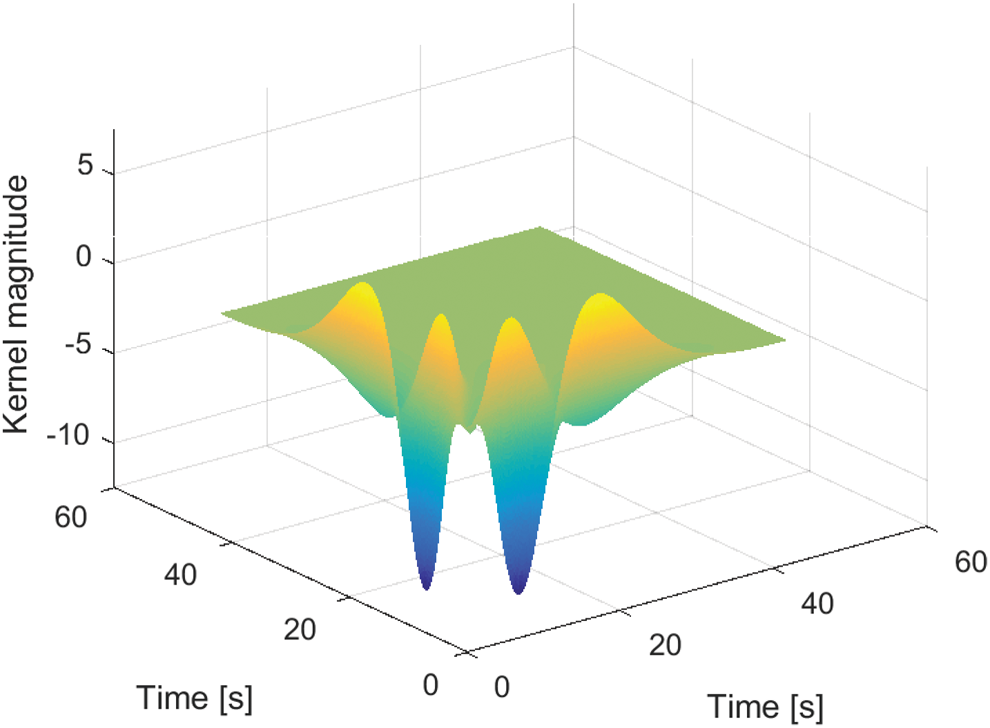
Second-order kernel from the second-order model for the average of five specimens.
4. Discussion
In this experiment, we tested whether smooth muscle under monophasic electrical field stimulation would display linear or nonlinear behavior with respect to force development by using a smooth muscle preparation. If the muscle displayed linear behavior, then we would expect single, sustained electrical stimulation to deliver greater force output than a current burst of a similar energy level.
The ABRM of M. edulis (a readily available edible mussel) has some similarities to smooth muscle from other species. The ABRM exhibits a phasic response to electrical field stimulation and it also exhibits temporal summation, as can be seen in the results of Twarog (1967) and Winton (1937). This smooth muscle includes a paramyosin core (absent in mammalian muscle) coated with a layer of myosin (Funabara et al., 2006). The ABRM is a molluscan catch muscle, so it can maintain force for extended periods with minimum energy expenditure and this is due, at least in part, to the presence of twitchin, a protein which acts by binding adjacent myosin molecules (Galler, 2008). Catch in the ABRM can be minimized with the application of serotonin in the concentration of 0.5 mg/L (Leenders, 1967). Serotonin acts by increasing concentration of cAMP and activation of protein kinase A (Butler and Siegman, 2010). Despite the cellular differences between ABRM and mammalian smooth muscle, Guth et al. (1984) found the force responses to be qualitatively similar during their experiments with calcium contractions in ABRM and guinea pig taenia coli muscle. In addition, Twarog (1967) found that in some aspects the ABRM resembles mammalian smooth muscle.
The nonparametric modeling method is well known as a tool to apply synergistically with the parametric model (Marmarelis, 2012). We applied the nonparametric method here with the goal of showing that the muscle force is not linearly related to the input energy during electric field stimulation. If a linear model could describe the behavior of the smooth muscle, a nonlinear model would not be necessary. In this study, we compared the nonlinear and linear model predictions with actual smooth muscle responses, and the measurements revealed that the most parsimonious nonparametric smooth muscle model is nonlinear and it is of second order.
Because the ABRM exhibits catch to a greater degree than most muscle specimens, it was necessary to add serotonin hydrochloride (0.5 mg/L; Alfa-Aesar, Ward Hill, MA), which is known to minimize the effects of catch so as to make the ABRM force responses more comparable under electric field stimulation to force responses of other types of smooth muscle (Muneoka et al., 1977).
Burstyn et al. (2007) proposed a parametric model of uterine smooth muscle that was intended to explain the data of Shmigol et al. (1998). They modeled the calcium concentration and output tension responses. However, their predictions of tension responses to a single 1-second pulse compared with a pulse train of equal energy showed an enhancement for current bursts of the order of 20% (their Fig. 11) for mammalian smooth muscle where our experimental results exceeded 1000% in the ABRM. Although calculations in Table 1 show a high variability in the force ratio, preparation number 2 is responsible for much of the variation. Preparation 2 showed a diminished response to the control pulse stimulation in comparison with the other specimens, but the reason for this result is unclear.
Du et al. (2009) proposed the use of an intermittent train rather than a single pulse to reduce stimulation power, but they did not match the energy levels. Although comparisons between whole tissue specimens and single cell models must be made carefully, we found some similarities between the single cell model force prediction and the force response from the ABRM. Although Du et al. (2009) utilized a model of a single cell, their result parallels the result from our experiments, in that intermittent pulse trains can improve energy efficiency when stimulating smooth muscle. Fay (1977) compared isolated muscle cells and whole muscle tissue and reported that the maximum force response per square cm was similar for both in the stomach of Bufo marinus during isometric contractions. Given these parallels observed by Fay (1977), we relate results from isometric contractions of whole ABRM to predictions from mathematical models of isolated smooth muscle cells.
The first- and second-order kernels of the nonparametric model aid the understanding of the muscle response to current bursts. We analyzed a model constructed from the average force response of five specimens. The first-order kernel appears in Figure 4. The first-order kernel is strongly positive between 0 and 3 seconds, and then it reaches a peak shortly thereafter, predicting augmentation of the response to electrical stimulation. Linear system theory would indicate that we could integrate the first-order kernel to predict the response to a step input, and the 1-second duration control pulse in our experiment is much like a step input.
The second-order kernel is pictured in Figure 5. In both the first- and second-order kernels, the largest peaks occur after 3 seconds, which means the first-order kernel predicts augmentation in force after the electrical stimulation has ended. Likewise, the second-order kernel also predicts the observed rise in force output. The strong positive regions show that the force continues rising well after the electrical stimulation has ended.
Actin and myosin dynamics may be responsible for the gain in force after burst stimulation compared with the single pulse force response. Du et al. (2009) showed that in gastrointestinal smooth muscle stimulation, bursts resulted in smaller concentrations of intracellular calcium than single pulses, although these investigators did not match the stimulation energy. When comparing measurements with model predictions, the single cell models do not explain measurements in which current burst responses diminish for repeated stimulations as reported by Shmigol et al. (1998). Thus, parametric models do not explain all of the responses to energy-matched single pulse and current burst stimulations.
Although ABRM shows some structural differences and functional similarities compared with mammalian smooth muscle (Guth et al., 1984), many of the response patterns were similar to those of mammalian smooth muscle once serotonin was applied to minimize catch. Catch may be due to the action of a protein called twitchin, which promotes interconnections between myofilaments, and serotonin causes an intracellular release of cAMP, inhibiting twitchin through protein kinase-mediated phosphorylation (Galler, 2008). Adding serotonin at a concentration of 0.5 mg/L allows force response to return to the baseline much more quickly after a contraction (Leenders, 1967).
We focused on responses to single pulses versus burst stimuli when the energy was matched. Experiments showed that the force response to burst stimuli was significantly greater than the force response to single pulses, and the difference was more than 10-fold in the ABRM. Our experiments showed that a linear model cannot explain such a result, and a second-order nonlinear model is required to explain the force production from these particular electrical stimulation patterns.
Calcium concentration has been shown to be the primary factor in determining the force output in smooth muscle preparations in both mammalian smooth muscle and ABRM (Atsumi and Sugi, 1976; Du et al., 2009). Sims et al. (2008) show that calcium concentration is related to the development of muscle force, but their time courses do not coincide as indicated by a nonlinear dynamic hysteresis loop. Our results confirm the presence of those nonlinearities, and some proportion of the nonlinear behavior may be due to the dynamics of actin and myosin. This effect is present in the mammalian smooth muscle cell as well as the molluscan smooth muscle cell as evidenced by our results and those of Burstyn et al. (2007). The model by Du et al. (2009) does not predict force development, so nonlinearities due to actin–myosin dynamics are not represented.
5. Conclusion
This study investigated the possibility that the smooth muscle response to electrical stimulation is a nonlinear phenomenon. If the muscle behavior were linear, the second-order nonparametric model would provide no improvement over the first-order model in predicting force output. The nonparametric model has proven useful in demonstrating the nonlinear behavior of smooth muscle. The linear model predicted similar responses to energy-matched single and intermittent bursts, although this clearly does not match the experiment measurements. Force output is not proportional to stimulation power, so a nonlinear model is required.
In summary, the existence of a significant second-order kernel suggested that the smooth muscle tissue exhibited nonlinear behavior. A third-order model was not necessary to describe the force response of the smooth muscle under these conditions, and the second-order model was sufficient to describe muscle response. Future efforts could utilize the nonparametric method to expedite the search for appropriate parametric models.
Footnotes
Authors' Contributions
S.E. contributed Matlab code for the analysis and assisted with organization of the manuscript; T.K. assisted with data analysis and organization of the manuscript; R.A.S. provided assistance with interpretation of data; V.Z.M. planned the nonlinear modeling effort and guided successful completion; S.Y. supervised laboratory experiments for data collection and analysis; M.C. performed experiments, analyzed data, and wrote the manuscript.
Author Disclosure Statement
No competing financial interests exist.