The exponential growth in the number of experimentally determined three-dimensional protein structures provide a new and relevant knowledge about the conformation of amino acids in proteins. Only a few of probability densities of amino acids are publicly available for use in structure validation and prediction methods. NIAS (Neighbors Influence of Amino acids and Secondary structures) is a web-based tool used to extract information about conformational preferences of amino acid residues and secondary structures in experimental-determined protein templates. This information is useful, for example, to characterize folds and local motifs in proteins, molecular folding, and can help the solution of complex problems such as protein structure prediction, protein design, among others. The NIAS-Server and supplementary data are available athttp://sbcb.inf.ufrgs.br/nias.
1. Introduction
The number of experimentally determined three-dimensional (3D) structures of proteins has grown in the last few years and has become a valuable resource for understanding biology at a structural level (Berman, 2008; Bourne et al., 2011). The availability of this information has allowed the development of knowledge-based computational methods to solve complex problems in structural bioinformatics (Goodsell et al., 2013) such as protein structure prediction, protein design, molecular docking, among others. A fundamental question in protein science is related to the intrinsic propensity for an amino acid residue to be in a particular secondary structure such as \documentclass{aastex}\usepackage{amsbsy}\usepackage{amsfonts}\usepackage{amssymb}\usepackage{bm}\usepackage{mathrsfs}\usepackage{pifont}\usepackage{stmaryrd}\usepackage{textcomp}\usepackage{portland, xspace}\usepackage{amsmath, amsxtra}\pagestyle{empty}\DeclareMathSizes{10}{9}{7}{6}\begin{document}
$$\alpha$$
\end{document}-helix, \documentclass{aastex}\usepackage{amsbsy}\usepackage{amsfonts}\usepackage{amssymb}\usepackage{bm}\usepackage{mathrsfs}\usepackage{pifont}\usepackage{stmaryrd}\usepackage{textcomp}\usepackage{portland, xspace}\usepackage{amsmath, amsxtra}\pagestyle{empty}\DeclareMathSizes{10}{9}{7}{6}\begin{document}
$$\beta$$
\end{document}-sheet, turns, coils, or other conformations (Petersen et al., 1999; Jha et al., 2005) and its contribution for the general fold of the protein molecule. Understanding the factors responsible for this behavior is important for protein studies and for the development of computational methods to tackle problems in structural biology. For example, in protein structure prediction, researchers are interested in the rules that determine the protein structure for a given sequence, which is influenced by the intrinsic conformational preference of each amino acid residue and also the interactions of neighbor amino acid residues.
Over the last 30 years, studies have been developed to understand the distributions of the backbone dihedral angles of proteins (Gibrat et al., 1987; Hovmoller and Ohlson, 2002; Keskin et al., 2004; Ting et al., 2010). Proteins can assume several conformations due the particular combination of phi (\documentclass{aastex}\usepackage{amsbsy}\usepackage{amsfonts}\usepackage{amssymb}\usepackage{bm}\usepackage{mathrsfs}\usepackage{pifont}\usepackage{stmaryrd}\usepackage{textcomp}\usepackage{portland, xspace}\usepackage{amsmath, amsxtra}\pagestyle{empty}\DeclareMathSizes{10}{9}{7}{6}\begin{document}
$$\phi$$
\end{document}) and psi (\documentclass{aastex}\usepackage{amsbsy}\usepackage{amsfonts}\usepackage{amssymb}\usepackage{bm}\usepackage{mathrsfs}\usepackage{pifont}\usepackage{stmaryrd}\usepackage{textcomp}\usepackage{portland, xspace}\usepackage{amsmath, amsxtra}\pagestyle{empty}\DeclareMathSizes{10}{9}{7}{6}\begin{document}
$$\psi$$
\end{document}) torsion angles (Richardson, 1981). These particular values can be observed when we analyze the Ramachandran plot (Ramachandran and Sasisekharan, 1968) of each of the 20 amino acid residues, and this occurs because the distribution of \documentclass{aastex}\usepackage{amsbsy}\usepackage{amsfonts}\usepackage{amssymb}\usepackage{bm}\usepackage{mathrsfs}\usepackage{pifont}\usepackage{stmaryrd}\usepackage{textcomp}\usepackage{portland, xspace}\usepackage{amsmath, amsxtra}\pagestyle{empty}\DeclareMathSizes{10}{9}{7}{6}\begin{document}
$$\phi$$
\end{document} and \documentclass{aastex}\usepackage{amsbsy}\usepackage{amsfonts}\usepackage{amssymb}\usepackage{bm}\usepackage{mathrsfs}\usepackage{pifont}\usepackage{stmaryrd}\usepackage{textcomp}\usepackage{portland, xspace}\usepackage{amsmath, amsxtra}\pagestyle{empty}\DeclareMathSizes{10}{9}{7}{6}\begin{document}
$$\psi$$
\end{document} is affected by interactions between atoms from the backbone and the side chains (exclusive of each amino acid) (Deane and Blundell, 1999; Hovmoller and Ohlson, 2002). Nevertheless, this is not the only factor; the conformational preferences of a residue are also influenced by the chemical identity and conformation of the neighboring residues (Kabat and Wu, 1973; Gibrat et al., 1987; Kang et al., 1993; Crasto and Feng, 2001; Keskin et al., 2004).
Although these biological mechanisms are not yet clearly known, structural information can be obtained from experimental protein databases and used to model and study protein structures. In the case of 3D protein structure prediction problem, this information helped knowledge-based prediction methods to achieve the best results in the last CASP experiments (Kryshtafovych et al., 2014). However, knowledge-based methods for protein structure prediction can only perform fast and effective prediction of the 3D protein structures when structural information is available (Kolinski, 2004). Knowledge-based prediction methods are fully dependent on the quality of structural models from experimentally determined protein structures (Dorn et al., 2014; Borguesan et al., 2015).
This work presents NIAS (Neighbors Influence of Amino acids and Secondary structures), a web tool to obtain conformational preferences of amino acid from experimentally determined proteins. These conformational preferences consider the occurrence of none or more neighbor amino acids and a target secondary structure. This tool takes advantage of the increase in the number of experimental protein structures stored in the Protein Data Bank (PDB) (Berman et al., 2000). This information represents a rich source of data and can be used in knowledge-based computational methods to tackle problems in structural biology.
2. Materials and Methods
2.1. Conformational preferences of amino acids
The solution of many problems in structural biology requires the understanding of how the 3D structure of protein molecule depends from its primary sequence, that is, the dependency of native conformation of proteins from its amino acid sequence. This conformation in peptides can be described by two main torsion angles, phi (\documentclass{aastex}\usepackage{amsbsy}\usepackage{amsfonts}\usepackage{amssymb}\usepackage{bm}\usepackage{mathrsfs}\usepackage{pifont}\usepackage{stmaryrd}\usepackage{textcomp}\usepackage{portland, xspace}\usepackage{amsmath, amsxtra}\pagestyle{empty}\DeclareMathSizes{10}{9}{7}{6}\begin{document}
$$\phi$$
\end{document}) and psi (\documentclass{aastex}\usepackage{amsbsy}\usepackage{amsfonts}\usepackage{amssymb}\usepackage{bm}\usepackage{mathrsfs}\usepackage{pifont}\usepackage{stmaryrd}\usepackage{textcomp}\usepackage{portland, xspace}\usepackage{amsmath, amsxtra}\pagestyle{empty}\DeclareMathSizes{10}{9}{7}{6}\begin{document}
$$\psi$$
\end{document}) (Ramachandran and Sasisekharan, 1968; Richardson, 1981). These angles can assume, theoretically, any value between [−180° +180°], nevertheless, some combinations are prohibited by steric interferences between atoms from the main-chain and side-chain (Hovmoller and Ohlson, 2002). Despite these prohibited combinations, proteins can still assume several conformations. The stable arrangement of segments of amino acid in a determined shape represents the secondary structure (Branden and Tooze, 1998; Scheef and Fink, 2005; Andersen and Rost, 2005). Studies had revealed that amino acids have conformational preferences for one or other type of secondary structure (Nagano, 1973; Chou and Fasman, 1974; Koehl and Levitt, 1999). The two most common and stable secondary structures are \documentclass{aastex}\usepackage{amsbsy}\usepackage{amsfonts}\usepackage{amssymb}\usepackage{bm}\usepackage{mathrsfs}\usepackage{pifont}\usepackage{stmaryrd}\usepackage{textcomp}\usepackage{portland, xspace}\usepackage{amsmath, amsxtra}\pagestyle{empty}\DeclareMathSizes{10}{9}{7}{6}\begin{document}
$$\alpha$$
\end{document}-helices (Pauling et al., 1951) and \documentclass{aastex}\usepackage{amsbsy}\usepackage{amsfonts}\usepackage{amssymb}\usepackage{bm}\usepackage{mathrsfs}\usepackage{pifont}\usepackage{stmaryrd}\usepackage{textcomp}\usepackage{portland, xspace}\usepackage{amsmath, amsxtra}\pagestyle{empty}\DeclareMathSizes{10}{9}{7}{6}\begin{document}
$$\beta$$
\end{document}-sheets (Pauling and Corey, 1951). There are other nonstable conformations such as coils and turns, but the \documentclass{aastex}\usepackage{amsbsy}\usepackage{amsfonts}\usepackage{amssymb}\usepackage{bm}\usepackage{mathrsfs}\usepackage{pifont}\usepackage{stmaryrd}\usepackage{textcomp}\usepackage{portland, xspace}\usepackage{amsmath, amsxtra}\pagestyle{empty}\DeclareMathSizes{10}{9}{7}{6}\begin{document}
$$\alpha$$
\end{document}-helix and \documentclass{aastex}\usepackage{amsbsy}\usepackage{amsfonts}\usepackage{amssymb}\usepackage{bm}\usepackage{mathrsfs}\usepackage{pifont}\usepackage{stmaryrd}\usepackage{textcomp}\usepackage{portland, xspace}\usepackage{amsmath, amsxtra}\pagestyle{empty}\DeclareMathSizes{10}{9}{7}{6}\begin{document}
$$\beta$$
\end{document}-sheets can be considered as the main elements in 3D structures (Andersen and Rost, 2005; Tramontano, 2006; Liljas et al., 2009).
To determine the secondary structure, there are two main methods: STRIDE (Frishman and Argos, 1995; Heinig and Frishman, 2004) that defines seven secondary structures: B or b (isolated bridge), E (extended conformation), H (\documentclass{aastex}\usepackage{amsbsy}\usepackage{amsfonts}\usepackage{amssymb}\usepackage{bm}\usepackage{mathrsfs}\usepackage{pifont}\usepackage{stmaryrd}\usepackage{textcomp}\usepackage{portland, xspace}\usepackage{amsmath, amsxtra}\pagestyle{empty}\DeclareMathSizes{10}{9}{7}{6}\begin{document}
$$\alpha$$
\end{document}-helix), G (\documentclass{aastex}\usepackage{amsbsy}\usepackage{amsfonts}\usepackage{amssymb}\usepackage{bm}\usepackage{mathrsfs}\usepackage{pifont}\usepackage{stmaryrd}\usepackage{textcomp}\usepackage{portland, xspace}\usepackage{amsmath, amsxtra}\pagestyle{empty}\DeclareMathSizes{10}{9}{7}{6}\begin{document}
$${3^{10}}$$
\end{document}-helix), I (\documentclass{aastex}\usepackage{amsbsy}\usepackage{amsfonts}\usepackage{amssymb}\usepackage{bm}\usepackage{mathrsfs}\usepackage{pifont}\usepackage{stmaryrd}\usepackage{textcomp}\usepackage{portland, xspace}\usepackage{amsmath, amsxtra}\pagestyle{empty}\DeclareMathSizes{10}{9}{7}{6}\begin{document}
$$\pi$$
\end{document}-helix), T (turn), and C (coil). Also, DSSP defines a model with eight secondary structures: H (\documentclass{aastex}\usepackage{amsbsy}\usepackage{amsfonts}\usepackage{amssymb}\usepackage{bm}\usepackage{mathrsfs}\usepackage{pifont}\usepackage{stmaryrd}\usepackage{textcomp}\usepackage{portland, xspace}\usepackage{amsmath, amsxtra}\pagestyle{empty}\DeclareMathSizes{10}{9}{7}{6}\begin{document}
$$\alpha$$
\end{document}-helix), G (\documentclass{aastex}\usepackage{amsbsy}\usepackage{amsfonts}\usepackage{amssymb}\usepackage{bm}\usepackage{mathrsfs}\usepackage{pifont}\usepackage{stmaryrd}\usepackage{textcomp}\usepackage{portland, xspace}\usepackage{amsmath, amsxtra}\pagestyle{empty}\DeclareMathSizes{10}{9}{7}{6}\begin{document}
$${3^{10}}$$
\end{document}-helix), I (\documentclass{aastex}\usepackage{amsbsy}\usepackage{amsfonts}\usepackage{amssymb}\usepackage{bm}\usepackage{mathrsfs}\usepackage{pifont}\usepackage{stmaryrd}\usepackage{textcomp}\usepackage{portland, xspace}\usepackage{amsmath, amsxtra}\pagestyle{empty}\DeclareMathSizes{10}{9}{7}{6}\begin{document}
$$\pi$$
\end{document}-helix), E (extended strand, participates in \documentclass{aastex}\usepackage{amsbsy}\usepackage{amsfonts}\usepackage{amssymb}\usepackage{bm}\usepackage{mathrsfs}\usepackage{pifont}\usepackage{stmaryrd}\usepackage{textcomp}\usepackage{portland, xspace}\usepackage{amsmath, amsxtra}\pagestyle{empty}\DeclareMathSizes{10}{9}{7}{6}\begin{document}
$$\beta$$
\end{document} ladder), B (residue in isolated \documentclass{aastex}\usepackage{amsbsy}\usepackage{amsfonts}\usepackage{amssymb}\usepackage{bm}\usepackage{mathrsfs}\usepackage{pifont}\usepackage{stmaryrd}\usepackage{textcomp}\usepackage{portland, xspace}\usepackage{amsmath, amsxtra}\pagestyle{empty}\DeclareMathSizes{10}{9}{7}{6}\begin{document}
$$\beta$$
\end{document}-bridge), T (hydrogen bonded turn), S (bend), and C (coil). In both STRIDE and DSSP, the C symbol is used whenever none of the other structure requirements are satisfied. Figure 1 shows the conformational preferences of the most common secondary structures assigned by STRIDE and DSSP from a set of 11,130 proteins (described in the next section). As illustrated, amino acids participating in a specific secondary structure usually adopt particular backbone torsion angles (Richardson, 1981; Hovmoller and Ohlson, 2002).
Conformational preferences of secondary structures for STRIDE and DSSP secondary structures. Torsion angle values were computed from the set of 11,130 protein structures obtained from the PDB. The dark red color marks the most densely occupied regions of the Ramachandran plot. Ramachandran plots were generated by NIAS-server http://sbcb.inf.ufrgs.br/nias. NIAS, Neighbors Influence of Amino acids and Secondary structures; PDB, Protein Data Bank.
Each amino acid residue has a set of physiochemical properties, which contributes to its intrinsic conformational preference (Mathura and Kolippakkam, 2005). It is possible to see the conformational preference of amino acids participating of the same secondary structure (Xia and Xie, 2002; Moelbert et al., 2004; Ting et al., 2010), and the presence of conformational patterns in protein sequences and the secondary structure (Xia and Xie, 2002; Moelbert et al., 2004; Ting et al., 2010). For a given secondary structure, a different conformational preference (\documentclass{aastex}\usepackage{amsbsy}\usepackage{amsfonts}\usepackage{amssymb}\usepackage{bm}\usepackage{mathrsfs}\usepackage{pifont}\usepackage{stmaryrd}\usepackage{textcomp}\usepackage{portland, xspace}\usepackage{amsmath, amsxtra}\pagestyle{empty}\DeclareMathSizes{10}{9}{7}{6}\begin{document}
$$\phi$$
\end{document} and \documentclass{aastex}\usepackage{amsbsy}\usepackage{amsfonts}\usepackage{amssymb}\usepackage{bm}\usepackage{mathrsfs}\usepackage{pifont}\usepackage{stmaryrd}\usepackage{textcomp}\usepackage{portland, xspace}\usepackage{amsmath, amsxtra}\pagestyle{empty}\DeclareMathSizes{10}{9}{7}{6}\begin{document}
$$\psi$$
\end{document}) exists depending on the amino acid residue. For example, Figure 2 shows the conformational preferences of alanine, arginine, and lysine in Turn and Coil secondary structures. As can be seen, amino acid residues in the same secondary structure have their particular pair of \documentclass{aastex}\usepackage{amsbsy}\usepackage{amsfonts}\usepackage{amssymb}\usepackage{bm}\usepackage{mathrsfs}\usepackage{pifont}\usepackage{stmaryrd}\usepackage{textcomp}\usepackage{portland, xspace}\usepackage{amsmath, amsxtra}\pagestyle{empty}\DeclareMathSizes{10}{9}{7}{6}\begin{document}
$$\phi$$
\end{document} and \documentclass{aastex}\usepackage{amsbsy}\usepackage{amsfonts}\usepackage{amssymb}\usepackage{bm}\usepackage{mathrsfs}\usepackage{pifont}\usepackage{stmaryrd}\usepackage{textcomp}\usepackage{portland, xspace}\usepackage{amsmath, amsxtra}\pagestyle{empty}\DeclareMathSizes{10}{9}{7}{6}\begin{document}
$$\psi$$
\end{document} torsion angles. Another important factor associated with the conformational preference of an amino acid residue in a protein is the influence of neighbor amino acids. Near amino acids contribute to shaping, secondary structure, or even protein folding (Kabat and Wu, 1973; Crasto and Feng, 2001; Ting et al., 2010). Conformational preferences are crucial to the development of knowledge-based protein structure prediction methods.
Conformational preferences of amino acids alanine (ALA), arginine (ARG), and lysine (LYS) in the secondary structures turn and coil assigned by STRIDE. Torsion angle values were computed from the set of 11,130 protein structures obtained from the PDB. The dark red color marks the most densely occupied regions of the Ramachandran plot. Ramachandran plots were generated by NIAS-server http://sbcb.inf.ufrgs.br/nias.
2.2. Database of conformational preferences
NIAS aims to determine the conformational preferences of amino acids by analyzing the occurrence of each amino acid in protein crystal structures. One of the most widely used databases in the field of 3D protein structures is the PDB. PDB contains publicly available 3D structures of proteins, nucleic acids, and a variety of other complex biomolecules experimentally determined mainly by X-ray crystallography (represents 90% of the data in PDB) and nuclear magnetic resonance spectroscopy (represents 9% of the data in PDB). NIAS combines the conformational preferences of amino acids (torsion angles) with their secondary structure information. The database used by NIAS was built from a set of \documentclass{aastex}\usepackage{amsbsy}\usepackage{amsfonts}\usepackage{amssymb}\usepackage{bm}\usepackage{mathrsfs}\usepackage{pifont}\usepackage{stmaryrd}\usepackage{textcomp}\usepackage{portland, xspace}\usepackage{amsmath, amsxtra}\pagestyle{empty}\DeclareMathSizes{10}{9}{7}{6}\begin{document}
$$11 , 130$$
\end{document} protein structures experimentally determined by X-ray diffraction with resolution \documentclass{aastex}\usepackage{amsbsy}\usepackage{amsfonts}\usepackage{amssymb}\usepackage{bm}\usepackage{mathrsfs}\usepackage{pifont}\usepackage{stmaryrd}\usepackage{textcomp}\usepackage{portland, xspace}\usepackage{amsmath, amsxtra}\pagestyle{empty}\DeclareMathSizes{10}{9}{7}{6}\begin{document}
$$\le 2.5$$
\end{document}Å and stored in PDB until December 2015. Only 3D protein structures with R-factor less than 20% were considered. For proteins with sequence identity above \documentclass{aastex}\usepackage{amsbsy}\usepackage{amsfonts}\usepackage{amssymb}\usepackage{bm}\usepackage{mathrsfs}\usepackage{pifont}\usepackage{stmaryrd}\usepackage{textcomp}\usepackage{portland, xspace}\usepackage{amsmath, amsxtra}\pagestyle{empty}\DeclareMathSizes{10}{9}{7}{6}\begin{document}
$$30$$
\end{document}, only one of them was considered. Thus, a set of \documentclass{aastex}\usepackage{amsbsy}\usepackage{amsfonts}\usepackage{amssymb}\usepackage{bm}\usepackage{mathrsfs}\usepackage{pifont}\usepackage{stmaryrd}\usepackage{textcomp}\usepackage{portland, xspace}\usepackage{amsmath, amsxtra}\pagestyle{empty}\DeclareMathSizes{10}{9}{7}{6}\begin{document}
$$5 , 255 , 768$$
\end{document} amino acids with occupancy equal to \documentclass{aastex}\usepackage{amsbsy}\usepackage{amsfonts}\usepackage{amssymb}\usepackage{bm}\usepackage{mathrsfs}\usepackage{pifont}\usepackage{stmaryrd}\usepackage{textcomp}\usepackage{portland, xspace}\usepackage{amsmath, amsxtra}\pagestyle{empty}\DeclareMathSizes{10}{9}{7}{6}\begin{document}
$$1$$
\end{document} was used for further analysis. For each amino acid residue, the dihedral angles phi and psi and its secondary structure information were assigned using STRIDE (Frishman and Argos, 1995; Heinig and Frishman, 2004) and DSSP (Kabsch and Sander, 1983, 1984). Figure 3 shows the percentage of amino acids (Fig. 3a) and the secondary structure assigned by STRIDE (Fig. 3b) and DSSP (Fig. 3c) when the 11,130 protein structures were analyzed. As expected, most of the amino acids (\documentclass{aastex}\usepackage{amsbsy}\usepackage{amsfonts}\usepackage{amssymb}\usepackage{bm}\usepackage{mathrsfs}\usepackage{pifont}\usepackage{stmaryrd}\usepackage{textcomp}\usepackage{portland, xspace}\usepackage{amsmath, amsxtra}\pagestyle{empty}\DeclareMathSizes{10}{9}{7}{6}\begin{document}
$$\approx$$
\end{document}60%) specified by STRIDE and DSSP were found in helical or sheet secondary structures. Turn and coils represent \documentclass{aastex}\usepackage{amsbsy}\usepackage{amsfonts}\usepackage{amssymb}\usepackage{bm}\usepackage{mathrsfs}\usepackage{pifont}\usepackage{stmaryrd}\usepackage{textcomp}\usepackage{portland, xspace}\usepackage{amsmath, amsxtra}\pagestyle{empty}\DeclareMathSizes{10}{9}{7}{6}\begin{document}
$$\approx$$
\end{document}35% of the secondary structures.
NIAS database content. (a) Distribution of 20 amino acid residues in the \documentclass{aastex}\usepackage{amsbsy}\usepackage{amsfonts}\usepackage{amssymb}\usepackage{bm}\usepackage{mathrsfs}\usepackage{pifont}\usepackage{stmaryrd}\usepackage{textcomp}\usepackage{portland, xspace}\usepackage{amsmath, amsxtra}\pagestyle{empty}\DeclareMathSizes{10}{9}{7}{6}\begin{document}
$$11 , 130$$
\end{document} protein structures; (b) STRIDE secondary structure distribution; and (c) DSSP secondary structure distribution.
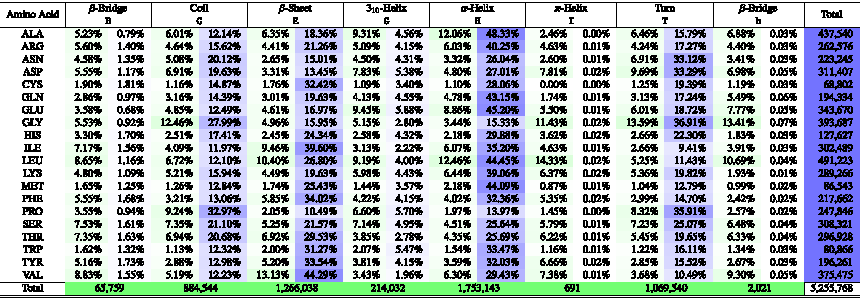
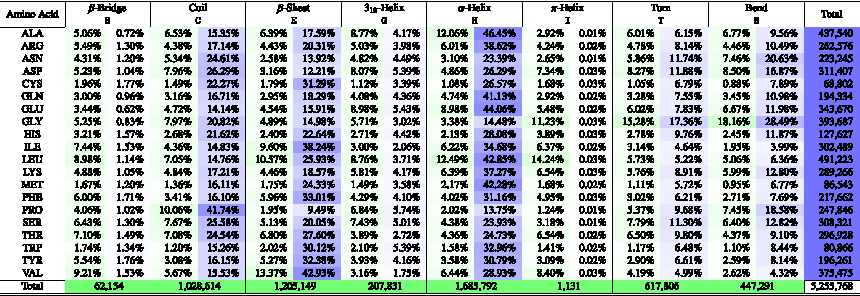
When compared pairwise, STRIDE and DSSP are similar and have ≈95% of agreement. Tables 1 and 2 summarize the distribution of amino acid residues per secondary structure from the selected proteins in the structural database when STRIDE and DSSD are considered, respectively. It is possible to see the frequency of occurrence (green) in a specific secondary structure and preferences of an amino acid residue to be in one or other secondary structure (blue). For example, alanine has almost 50% of preference to be in an \documentclass{aastex}\usepackage{amsbsy}\usepackage{amsfonts}\usepackage{amssymb}\usepackage{bm}\usepackage{mathrsfs}\usepackage{pifont}\usepackage{stmaryrd}\usepackage{textcomp}\usepackage{portland, xspace}\usepackage{amsmath, amsxtra}\pagestyle{empty}\DeclareMathSizes{10}{9}{7}{6}\begin{document}
$$\alpha$$
\end{document}-helix region in both STRIDE and DSSD methods. On the contrary, proline has ∼70% of preference in the irregular secondary structures (S, C, or T). Also, leucine has a major contribution in helix regions (G, H, or I), whereas valine has more propensity to be in sheet regions (B, b, or E), and the amino acid glycine with the main influence in the irregular secondary structure (S, C, or T), all in green regions of Tables 1 and 2.
STRIDE Secondary Structure Preferences of Amino Acid Residues in Proteins
DSSP Secondary Structure Preferences of Amino Acid Residues in Proteins
Figures 2 and 3 and Tables 1 and 2 reveal that amino acid residues have specific conformational preferences and also present peculiar conformations when occurring in particular secondary structures, which can be because of their physical and chemical properties. NIAS allows the extraction of these conformational standards, allowing the study of proteins and the development of computational methods to solve problems in structural biology.
2.3. Neighbors influence of amino acids and secondary structures
NIAS extracts information from the PDB and it builds an angle probability list (APL) as shown in Dorn et al. (2013) and Borguesan et al. (2015). Briefly, this approach builds a matrix \documentclass{aastex}\usepackage{amsbsy}\usepackage{amsfonts}\usepackage{amssymb}\usepackage{bm}\usepackage{mathrsfs}\usepackage{pifont}\usepackage{stmaryrd}\usepackage{textcomp}\usepackage{portland, xspace}\usepackage{amsmath, amsxtra}\pagestyle{empty}\DeclareMathSizes{10}{9}{7}{6}\begin{document}
$${H_{aa , ss}}$$
\end{document} of [−180°, +180° \documentclass{aastex}\usepackage{amsbsy}\usepackage{amsfonts}\usepackage{amssymb}\usepackage{bm}\usepackage{mathrsfs}\usepackage{pifont}\usepackage{stmaryrd}\usepackage{textcomp}\usepackage{portland, xspace}\usepackage{amsmath, amsxtra}\pagestyle{empty}\DeclareMathSizes{10}{9}{7}{6}\begin{document}
$$\times$$
\end{document} −180°, +180°] cells for each amino acid residue (\documentclass{aastex}\usepackage{amsbsy}\usepackage{amsfonts}\usepackage{amssymb}\usepackage{bm}\usepackage{mathrsfs}\usepackage{pifont}\usepackage{stmaryrd}\usepackage{textcomp}\usepackage{portland, xspace}\usepackage{amsmath, amsxtra}\pagestyle{empty}\DeclareMathSizes{10}{9}{7}{6}\begin{document}
$$aa$$
\end{document}) and secondary structure (\documentclass{aastex}\usepackage{amsbsy}\usepackage{amsfonts}\usepackage{amssymb}\usepackage{bm}\usepackage{mathrsfs}\usepackage{pifont}\usepackage{stmaryrd}\usepackage{textcomp}\usepackage{portland, xspace}\usepackage{amsmath, amsxtra}\pagestyle{empty}\DeclareMathSizes{10}{9}{7}{6}\begin{document}
$$ss$$
\end{document}). Each cell contains the relative frequency of the amino acids (\documentclass{aastex}\usepackage{amsbsy}\usepackage{amsfonts}\usepackage{amssymb}\usepackage{bm}\usepackage{mathrsfs}\usepackage{pifont}\usepackage{stmaryrd}\usepackage{textcomp}\usepackage{portland, xspace}\usepackage{amsmath, amsxtra}\pagestyle{empty}\DeclareMathSizes{10}{9}{7}{6}\begin{document}
$$aa$$
\end{document}) and its secondary structure (\documentclass{aastex}\usepackage{amsbsy}\usepackage{amsfonts}\usepackage{amssymb}\usepackage{bm}\usepackage{mathrsfs}\usepackage{pifont}\usepackage{stmaryrd}\usepackage{textcomp}\usepackage{portland, xspace}\usepackage{amsmath, amsxtra}\pagestyle{empty}\DeclareMathSizes{10}{9}{7}{6}\begin{document}
$$ss$$
\end{document}) observed in experimentally determined protein structures. This approach provides a way to identify the existence of conformational preferences of pairs \documentclass{aastex}\usepackage{amsbsy}\usepackage{amsfonts}\usepackage{amssymb}\usepackage{bm}\usepackage{mathrsfs}\usepackage{pifont}\usepackage{stmaryrd}\usepackage{textcomp}\usepackage{portland, xspace}\usepackage{amsmath, amsxtra}\pagestyle{empty}\DeclareMathSizes{10}{9}{7}{6}\begin{document}
$$aa , ss$$
\end{document}. To perform this analysis, a set of \documentclass{aastex}\usepackage{amsbsy}\usepackage{amsfonts}\usepackage{amssymb}\usepackage{bm}\usepackage{mathrsfs}\usepackage{pifont}\usepackage{stmaryrd}\usepackage{textcomp}\usepackage{portland, xspace}\usepackage{amsmath, amsxtra}\pagestyle{empty}\DeclareMathSizes{10}{9}{7}{6}\begin{document}
$$11 , 130$$
\end{document} protein structures with \documentclass{aastex}\usepackage{amsbsy}\usepackage{amsfonts}\usepackage{amssymb}\usepackage{bm}\usepackage{mathrsfs}\usepackage{pifont}\usepackage{stmaryrd}\usepackage{textcomp}\usepackage{portland, xspace}\usepackage{amsmath, amsxtra}\pagestyle{empty}\DeclareMathSizes{10}{9}{7}{6}\begin{document}
$$5 , 255 , 768$$
\end{document} amino acids residues is used (described in the previous section). Each cell (\documentclass{aastex}\usepackage{amsbsy}\usepackage{amsfonts}\usepackage{amssymb}\usepackage{bm}\usepackage{mathrsfs}\usepackage{pifont}\usepackage{stmaryrd}\usepackage{textcomp}\usepackage{portland, xspace}\usepackage{amsmath, amsxtra}\pagestyle{empty}\DeclareMathSizes{10}{9}{7}{6}\begin{document}
$$i$$
\end{document}, \documentclass{aastex}\usepackage{amsbsy}\usepackage{amsfonts}\usepackage{amssymb}\usepackage{bm}\usepackage{mathrsfs}\usepackage{pifont}\usepackage{stmaryrd}\usepackage{textcomp}\usepackage{portland, xspace}\usepackage{amsmath, amsxtra}\pagestyle{empty}\DeclareMathSizes{10}{9}{7}{6}\begin{document}
$$j$$
\end{document}) from \documentclass{aastex}\usepackage{amsbsy}\usepackage{amsfonts}\usepackage{amssymb}\usepackage{bm}\usepackage{mathrsfs}\usepackage{pifont}\usepackage{stmaryrd}\usepackage{textcomp}\usepackage{portland, xspace}\usepackage{amsmath, amsxtra}\pagestyle{empty}\DeclareMathSizes{10}{9}{7}{6}\begin{document}
$$matrix \ H$$
\end{document} has the number of times that a given amino acid residue \documentclass{aastex}\usepackage{amsbsy}\usepackage{amsfonts}\usepackage{amssymb}\usepackage{bm}\usepackage{mathrsfs}\usepackage{pifont}\usepackage{stmaryrd}\usepackage{textcomp}\usepackage{portland, xspace}\usepackage{amsmath, amsxtra}\pagestyle{empty}\DeclareMathSizes{10}{9}{7}{6}\begin{document}
$$aa$$
\end{document} in secondary structure \documentclass{aastex}\usepackage{amsbsy}\usepackage{amsfonts}\usepackage{amssymb}\usepackage{bm}\usepackage{mathrsfs}\usepackage{pifont}\usepackage{stmaryrd}\usepackage{textcomp}\usepackage{portland, xspace}\usepackage{amsmath, amsxtra}\pagestyle{empty}\DeclareMathSizes{10}{9}{7}{6}\begin{document}
$$ss$$
\end{document} has a pair of torsion angles (i\documentclass{aastex}\usepackage{amsbsy}\usepackage{amsfonts}\usepackage{amssymb}\usepackage{bm}\usepackage{mathrsfs}\usepackage{pifont}\usepackage{stmaryrd}\usepackage{textcomp}\usepackage{portland, xspace}\usepackage{amsmath, amsxtra}\pagestyle{empty}\DeclareMathSizes{10}{9}{7}{6}\begin{document}
$$\le \phi <$$
\end{document} i + 1, j \documentclass{aastex}\usepackage{amsbsy}\usepackage{amsfonts}\usepackage{amssymb}\usepackage{bm}\usepackage{mathrsfs}\usepackage{pifont}\usepackage{stmaryrd}\usepackage{textcomp}\usepackage{portland, xspace}\usepackage{amsmath, amsxtra}\pagestyle{empty}\DeclareMathSizes{10}{9}{7}{6}\begin{document}
$$\le \psi <$$
\end{document} j + 1). Then, for each amino acid residue and secondary structure, the \documentclass{aastex}\usepackage{amsbsy}\usepackage{amsfonts}\usepackage{amssymb}\usepackage{bm}\usepackage{mathrsfs}\usepackage{pifont}\usepackage{stmaryrd}\usepackage{textcomp}\usepackage{portland, xspace}\usepackage{amsmath, amsxtra}\pagestyle{empty}\DeclareMathSizes{10}{9}{7}{6}\begin{document}
$$AP{L_{aa , ss}}$$
\end{document} (Eq. 1) was computed representing the normalized frequency of each pair of angles. A higher frequency associated with a pair \documentclass{aastex}\usepackage{amsbsy}\usepackage{amsfonts}\usepackage{amssymb}\usepackage{bm}\usepackage{mathrsfs}\usepackage{pifont}\usepackage{stmaryrd}\usepackage{textcomp}\usepackage{portland, xspace}\usepackage{amsmath, amsxtra}\pagestyle{empty}\DeclareMathSizes{10}{9}{7}{6}\begin{document}
$$\phi$$
\end{document} and \documentclass{aastex}\usepackage{amsbsy}\usepackage{amsfonts}\usepackage{amssymb}\usepackage{bm}\usepackage{mathrsfs}\usepackage{pifont}\usepackage{stmaryrd}\usepackage{textcomp}\usepackage{portland, xspace}\usepackage{amsmath, amsxtra}\pagestyle{empty}\DeclareMathSizes{10}{9}{7}{6}\begin{document}
$$\psi$$
\end{document} indicates that this combination is more common in nature for the amino acid \documentclass{aastex}\usepackage{amsbsy}\usepackage{amsfonts}\usepackage{amssymb}\usepackage{bm}\usepackage{mathrsfs}\usepackage{pifont}\usepackage{stmaryrd}\usepackage{textcomp}\usepackage{portland, xspace}\usepackage{amsmath, amsxtra}\pagestyle{empty}\DeclareMathSizes{10}{9}{7}{6}\begin{document}
$$aa$$
\end{document} on the secondary structure \documentclass{aastex}\usepackage{amsbsy}\usepackage{amsfonts}\usepackage{amssymb}\usepackage{bm}\usepackage{mathrsfs}\usepackage{pifont}\usepackage{stmaryrd}\usepackage{textcomp}\usepackage{portland, xspace}\usepackage{amsmath, amsxtra}\pagestyle{empty}\DeclareMathSizes{10}{9}{7}{6}\begin{document}
$$ss$$
\end{document}.
\documentclass{aastex}\usepackage{amsbsy}\usepackage{amsfonts}\usepackage{amssymb}\usepackage{bm}\usepackage{mathrsfs}\usepackage{pifont}\usepackage{stmaryrd}\usepackage{textcomp}\usepackage{portland, xspace}\usepackage{amsmath, amsxtra}\pagestyle{empty}\DeclareMathSizes{10}{9}{7}{6}\begin{document}
\begin{align*}
\quad AP { L_ { aa , ss } } ( i , j ) = { \frac { { H_ { aa , ss } } ( i , j ) } { \sum ( { H_ { aa , ss } } ) } } , \tag { 1 }
\end{align*}
\end{document}
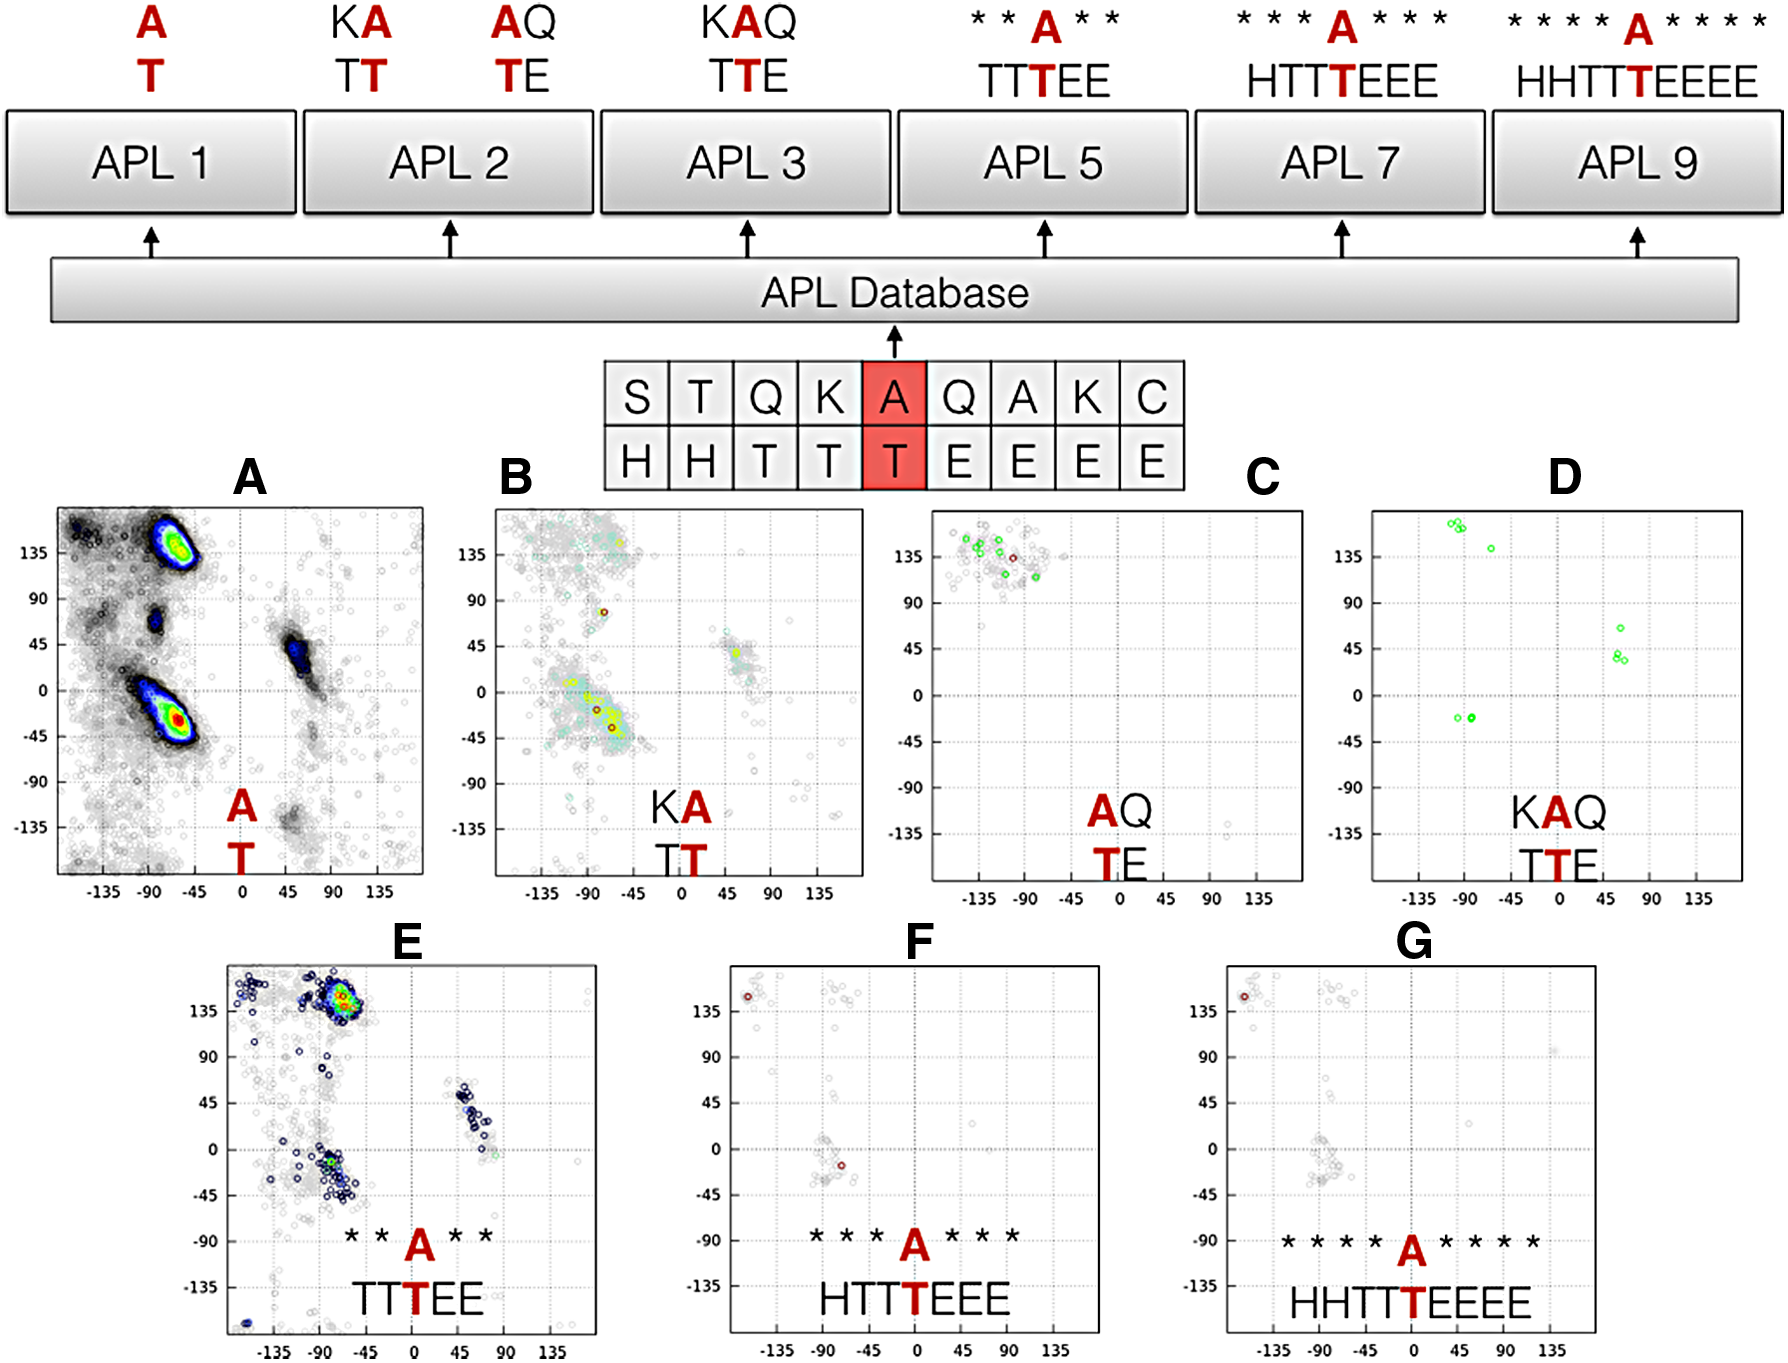
NIAS allows the generation of four different types of APLs. The APL1 without neighbor influence (Borguesan et al., 2015), APL2 with single neighbor-dependent influence (left or right neighbor), APL3 with complete neighbor-dependent influence (left and right neighbors). The last type is the APLCentroid, which considers the full neighbors of range five (APL5), seven (APL7), and nine (APL9) for the secondary structure and only the central amino acid residue. To generate these APLs, NIAS allows the user to enter a list of PDB IDs to ignore from the 11,130 structures in the APL database. The user can also enter the threshold for B-Factor of the amino acid residues in irregular secondary structure (coil, turn, and bend) and B-Factor of the amino acid residues in helix or sheet secondary structure. NIAS allows the search for the amino acid sequence from the GenBank database (Benson et al., 2009), using the Geninfo Identifier (GI), and predicts the secondary structure of this sequence with the PSIPRED (Jones, 1999). It enables the user to analyze the behavior of any sequence of amino acids deposited in GenBank, based on the frequency of these amino acids in the PDB with the secondary structure assigned by DSSP (Kabsch and Sander, 1983) or STRIDE (Frishman and Argos, 1995). Figure 4 shows the web interface of the NIAS-Server. Figure 5 shows different types of APLs generated for a target amino acid sequence STQKAQAKC and secondary structure HHTTTEEEE; the four different types of APLs are described below:
• APL1: All of the pairwise combinations of amino acid and secondary structure are used to search in the APL database. This APL contains the relative frequency of occurrence of each pair \documentclass{aastex}\usepackage{amsbsy}\usepackage{amsfonts}\usepackage{amssymb}\usepackage{bm}\usepackage{mathrsfs}\usepackage{pifont}\usepackage{stmaryrd}\usepackage{textcomp}\usepackage{portland, xspace}\usepackage{amsmath, amsxtra}\pagestyle{empty}\DeclareMathSizes{10}{9}{7}{6}\begin{document}
$$aa$$
\end{document}, \documentclass{aastex}\usepackage{amsbsy}\usepackage{amsfonts}\usepackage{amssymb}\usepackage{bm}\usepackage{mathrsfs}\usepackage{pifont}\usepackage{stmaryrd}\usepackage{textcomp}\usepackage{portland, xspace}\usepackage{amsmath, amsxtra}\pagestyle{empty}\DeclareMathSizes{10}{9}{7}{6}\begin{document}
$$ss$$
\end{document} (Borguesan et al., 2015). The main idea of APL1 is to find the particular conformational preferences of amino acids when participating in different secondary structures (Xia and Xie, 2002; Moelbert et al., 2004; Ting et al., 2010). Figure 5A shows the output from APL1 for alanine present in a Turn secondary structure.
• APL2: APL2 is the single neighbor-dependent APL. In the APL2 instead of using only one pair (\documentclass{aastex}\usepackage{amsbsy}\usepackage{amsfonts}\usepackage{amssymb}\usepackage{bm}\usepackage{mathrsfs}\usepackage{pifont}\usepackage{stmaryrd}\usepackage{textcomp}\usepackage{portland, xspace}\usepackage{amsmath, amsxtra}\pagestyle{empty}\DeclareMathSizes{10}{9}{7}{6}\begin{document}
$$a{a_i}$$
\end{document}, \documentclass{aastex}\usepackage{amsbsy}\usepackage{amsfonts}\usepackage{amssymb}\usepackage{bm}\usepackage{mathrsfs}\usepackage{pifont}\usepackage{stmaryrd}\usepackage{textcomp}\usepackage{portland, xspace}\usepackage{amsmath, amsxtra}\pagestyle{empty}\DeclareMathSizes{10}{9}{7}{6}\begin{document}
$$s{s_i}$$
\end{document}), the neighbor-dependent pair is used. With this approach, two files are generated, the first one returns the relative frequency of occurrence of the pair at left (\documentclass{aastex}\usepackage{amsbsy}\usepackage{amsfonts}\usepackage{amssymb}\usepackage{bm}\usepackage{mathrsfs}\usepackage{pifont}\usepackage{stmaryrd}\usepackage{textcomp}\usepackage{portland, xspace}\usepackage{amsmath, amsxtra}\pagestyle{empty}\DeclareMathSizes{10}{9}{7}{6}\begin{document}
$$a{a_i}$$
\end{document}, \documentclass{aastex}\usepackage{amsbsy}\usepackage{amsfonts}\usepackage{amssymb}\usepackage{bm}\usepackage{mathrsfs}\usepackage{pifont}\usepackage{stmaryrd}\usepackage{textcomp}\usepackage{portland, xspace}\usepackage{amsmath, amsxtra}\pagestyle{empty}\DeclareMathSizes{10}{9}{7}{6}\begin{document}
$$s{s_i}$$
\end{document}) with the influence of the pair at right (\documentclass{aastex}\usepackage{amsbsy}\usepackage{amsfonts}\usepackage{amssymb}\usepackage{bm}\usepackage{mathrsfs}\usepackage{pifont}\usepackage{stmaryrd}\usepackage{textcomp}\usepackage{portland, xspace}\usepackage{amsmath, amsxtra}\pagestyle{empty}\DeclareMathSizes{10}{9}{7}{6}\begin{document}
$$a{a_{i + 1}}$$
\end{document}, \documentclass{aastex}\usepackage{amsbsy}\usepackage{amsfonts}\usepackage{amssymb}\usepackage{bm}\usepackage{mathrsfs}\usepackage{pifont}\usepackage{stmaryrd}\usepackage{textcomp}\usepackage{portland, xspace}\usepackage{amsmath, amsxtra}\pagestyle{empty}\DeclareMathSizes{10}{9}{7}{6}\begin{document}
$$s{s_{i + 1}}$$
\end{document}). The other one returns the relative frequency of occurrence of the pair at right (\documentclass{aastex}\usepackage{amsbsy}\usepackage{amsfonts}\usepackage{amssymb}\usepackage{bm}\usepackage{mathrsfs}\usepackage{pifont}\usepackage{stmaryrd}\usepackage{textcomp}\usepackage{portland, xspace}\usepackage{amsmath, amsxtra}\pagestyle{empty}\DeclareMathSizes{10}{9}{7}{6}\begin{document}
$$a{a_{i + 1}}$$
\end{document}, \documentclass{aastex}\usepackage{amsbsy}\usepackage{amsfonts}\usepackage{amssymb}\usepackage{bm}\usepackage{mathrsfs}\usepackage{pifont}\usepackage{stmaryrd}\usepackage{textcomp}\usepackage{portland, xspace}\usepackage{amsmath, amsxtra}\pagestyle{empty}\DeclareMathSizes{10}{9}{7}{6}\begin{document}
$$s{s_{i + 1}}$$
\end{document}) with the influence of the pair at left (\documentclass{aastex}\usepackage{amsbsy}\usepackage{amsfonts}\usepackage{amssymb}\usepackage{bm}\usepackage{mathrsfs}\usepackage{pifont}\usepackage{stmaryrd}\usepackage{textcomp}\usepackage{portland, xspace}\usepackage{amsmath, amsxtra}\pagestyle{empty}\DeclareMathSizes{10}{9}{7}{6}\begin{document}
$$a{a_i}$$
\end{document}, \documentclass{aastex}\usepackage{amsbsy}\usepackage{amsfonts}\usepackage{amssymb}\usepackage{bm}\usepackage{mathrsfs}\usepackage{pifont}\usepackage{stmaryrd}\usepackage{textcomp}\usepackage{portland, xspace}\usepackage{amsmath, amsxtra}\pagestyle{empty}\DeclareMathSizes{10}{9}{7}{6}\begin{document}
$$s{s_i}$$
\end{document}). This schema was based on the work of Ting et al. (2010), which investigated the Ramachandran probability distributions; for neighbor amino acids (left and right), different neighbor residue types where considered. As observed by Ting et al. (2010), certain neighbor amino acid types have consistent effects regarding increasing or decreasing the \documentclass{aastex}\usepackage{amsbsy}\usepackage{amsfonts}\usepackage{amssymb}\usepackage{bm}\usepackage{mathrsfs}\usepackage{pifont}\usepackage{stmaryrd}\usepackage{textcomp}\usepackage{portland, xspace}\usepackage{amsmath, amsxtra}\pagestyle{empty}\DeclareMathSizes{10}{9}{7}{6}\begin{document}
$$\alpha$$
\end{document}, \documentclass{aastex}\usepackage{amsbsy}\usepackage{amsfonts}\usepackage{amssymb}\usepackage{bm}\usepackage{mathrsfs}\usepackage{pifont}\usepackage{stmaryrd}\usepackage{textcomp}\usepackage{portland, xspace}\usepackage{amsmath, amsxtra}\pagestyle{empty}\DeclareMathSizes{10}{9}{7}{6}\begin{document}
$$\beta$$
\end{document} regions for most central residue types. Figure 5A and B shows the APL2 left (KA, TT) and right (AQ, TE), respectively, for the subsequence KAQ and secondary structure TTE.
• APL3: It generates distributions for all amino acids (left-neighbor, center, and right-neighbor dependent distributions) of a three peptide. APL3 considers that both pairs from left (\documentclass{aastex}\usepackage{amsbsy}\usepackage{amsfonts}\usepackage{amssymb}\usepackage{bm}\usepackage{mathrsfs}\usepackage{pifont}\usepackage{stmaryrd}\usepackage{textcomp}\usepackage{portland, xspace}\usepackage{amsmath, amsxtra}\pagestyle{empty}\DeclareMathSizes{10}{9}{7}{6}\begin{document}
$$a{a_{i - 1}}$$
\end{document}, \documentclass{aastex}\usepackage{amsbsy}\usepackage{amsfonts}\usepackage{amssymb}\usepackage{bm}\usepackage{mathrsfs}\usepackage{pifont}\usepackage{stmaryrd}\usepackage{textcomp}\usepackage{portland, xspace}\usepackage{amsmath, amsxtra}\pagestyle{empty}\DeclareMathSizes{10}{9}{7}{6}\begin{document}
$$s{s_{i - 1}}$$
\end{document}) and right (\documentclass{aastex}\usepackage{amsbsy}\usepackage{amsfonts}\usepackage{amssymb}\usepackage{bm}\usepackage{mathrsfs}\usepackage{pifont}\usepackage{stmaryrd}\usepackage{textcomp}\usepackage{portland, xspace}\usepackage{amsmath, amsxtra}\pagestyle{empty}\DeclareMathSizes{10}{9}{7}{6}\begin{document}
$$a{a_{i + 1}}$$
\end{document}, \documentclass{aastex}\usepackage{amsbsy}\usepackage{amsfonts}\usepackage{amssymb}\usepackage{bm}\usepackage{mathrsfs}\usepackage{pifont}\usepackage{stmaryrd}\usepackage{textcomp}\usepackage{portland, xspace}\usepackage{amsmath, amsxtra}\pagestyle{empty}\DeclareMathSizes{10}{9}{7}{6}\begin{document}
$$s{s_{i + 1}}$$
\end{document}) have influence in the middle pair (\documentclass{aastex}\usepackage{amsbsy}\usepackage{amsfonts}\usepackage{amssymb}\usepackage{bm}\usepackage{mathrsfs}\usepackage{pifont}\usepackage{stmaryrd}\usepackage{textcomp}\usepackage{portland, xspace}\usepackage{amsmath, amsxtra}\pagestyle{empty}\DeclareMathSizes{10}{9}{7}{6}\begin{document}
$$a{a_i}$$
\end{document}, \documentclass{aastex}\usepackage{amsbsy}\usepackage{amsfonts}\usepackage{amssymb}\usepackage{bm}\usepackage{mathrsfs}\usepackage{pifont}\usepackage{stmaryrd}\usepackage{textcomp}\usepackage{portland, xspace}\usepackage{amsmath, amsxtra}\pagestyle{empty}\DeclareMathSizes{10}{9}{7}{6}\begin{document}
$$s{s_i}$$
\end{document}). Figure 5D shows the output for the three-peptide KAQ and secondary structure TTE. APL3 introduces more restrictions when compared to APL1 and APL2. Due to the hard restrictions, the number of conformational preferences decreases reducing the protein conformational space for the target amino acid residues.
• APLcentroid: Due to the low amount of data in APL3, another approach was necessary to use a larger range of input data. NIAS implements the APL5, APL7, and APL9. This APL uses only the central amino acid with any combination of amino acids in the neighbors, but keeping the full secondary structure target. The only difference among APL5 (Fig. 5E), APL7 (Fig. 5F), and APL9 (Fig. 5G) is the number of amino acids considered. Figure 5E–G shows the conformational preferences of the amino acid sequence----A----and secondary structure HHTTTEEEE since the surrounding residues can be anything.
Screenshot of NIAS. Ramachandran plot (right corner) shows the conformational preferences of amino acid residue computed by NIAS. The system receives the definition of the target amino acid and secondary structure sequences to which the results will be produced. By default, the application uses all of the protein sequences of the database. However, it is possible to exclude some of them by inserting their PDB ID. B-Factor backbone threshold for regular secondary structures and also B-factor threshold for “coil,” “turn,” or “bend” secondary structures can be used. The user can define the type of APL to be generated. APL, angle probability list.
The APLs used by NIAS are classified in four different types. The APL1 without neighbor influence (A), APL2 with single neighbor-dependent influence (left or right neighbor) (B, C), APL3 with complete neighbor-dependent influence (left and right neighbor) (D), and APL-centroid, which considers the full neighbors of range five (APL5) (E), seven (APL7) (F), and nine (APL9) (G) for the secondary structure and only the middle amino acid residue. *Represents any amino acid in the neighborhood.
NIAS generates for each target pattern (amino acid residues + secondary structure) all possible APLs. The output is presented as a text file containing the conformational preferences of residues and also a Ramachandran Plot representation of the conformational preferences. All APL files also provide omega and chi's dihedral angles of the amino acid residues. Omega and chi angles are computed using PROMOTIF (Hutchinson and Thornton, 1996). A crucial issue in using the data generated by NIAS is to understand that the higher the model of APL (APL3 and APL9), the harder it is to find patterns in the database. Likewise, the lower the model APL (APL1 and APL5), the greater the number of data found in the database. This can be seen in Figure 5, where the number of data decreases based on the type of APL.
3. Benefits, Applicability, and Availability of Nias
Conformational preferences of amino acid residues or segments of them are often used in knowledge-based protein structure prediction methods (Dorn et al., 2014). There are many studies indicating the presence of conformational patterns in protein sequences and their secondary structures (Xia and Xie, 2002; Moelbert et al., 2004; Ting et al., 2010; Hovmoller and Ohlson, 2002). The combination of amino acid residue, secondary structure, and frequency generates valuable information suitable to be used in the prediction of new 3D protein structures. The structural information generated by NIAS can be used to reduce the protein conformational search space in prediction tasks such as illustrated by Borguesan et al. (2015) and Dorn et al. (2013). In the latter, a genetic algorithm was combined with the APL and used to generate better candidate solutions for the problem. In addition to the 3D protein structure prediction problem, conformational preferences of amino acids and secondary structure can also contribute to the solution of other important problems in structural bioinformatics. For computational protein design methods, known 3D protein structures contain important information that may be used in the design study, such as the statistical distribution of the amino acid residues (Russ and Ranganathan, 2002), the intrinsic preferences of amino acids to participate of segments of secondary structures. Prediction of local structural properties of a protein molecule should be easier when computational protein design methods consider structural template information. These data may also be useful for checking secondary structure assignments in the PDB (Martin et al., 2005).
In molecular docking, there are challenges related to the different scoring functions applied for computing the protein–ligand complexes binding affinities (force field based, empirical knowledge based, clustering and entropy based, or consensus scoring methods), sampling methods for generating different ligand conformations and orientations, accurate models of the receptor, and so on. Knowledge-based methods have developed in this field aiming to rank computer-generated binding modes (Gohlke and Klebe, 2001).
The use of PDB information depends on the tools and resources for data management, data access, and analysis. NIAS allows the generation of different kinds of structural patterns. This information represents a rich source of data and can be used in knowledge-based methods to tackle problems related to protein structure prediction, protein design, molecular docking, motif analysis, among others. NIAS was implemented in Python programming language and made freely available on the web using Web2Py Framework.1
4. Conclusion
Structural bioinformatics is one of the key research areas in the field of computational biology concerned with the study of structures of biological macromolecules such as proteins. The exponential growth in the number of experimentally determined 3D protein structures provides new and relevant knowledge about the conformation of amino acids in proteins. In this article, we introduced NIAS, a web tool to generate APL data. APL contains conformational preference of amino acid residues according to the amino acid type and its secondary structure. These patterns are crucial to the development of better knowledge-based protein structure prediction methods and also to study complex biological mechanisms.
5. Availability of Supporting Data
The list of the 11,130 protein structures used in this study and other information can be found in the NIAS-Server, available at http://sbcb.inf.ufrgs.br/nias.
Footnotes
Acknowledgments
This work was supported by grants from FAPERGS and MCT/CNPq (473692/2013-9 and 311022/2015-4), Brazil. MIP was partially funded by Basal funds FB0001, CONICYT, Chile.
Author Disclosure Statement
No competing financial interests exist.
References
1.
AndersenC.A.F., and RostB.2005. Secondary structure assignment: Structural bioinformatics, chap. 17, 341. In BourneP.E., and WeissigH., eds. Structural Bioinformatics. John Wiley and Sons, Inc., New York.
BermanH., WestbrookJ., FengZ., et al.2000. The protein data bank. Nucleic Acids Res., 28, 235–242.
4.
BermanH.M.2008. The protein data bank: A historical perspective. Acta Crystallogr. A, 64, 88–95.
5.
BorguesanB., Barbachan e SilvaM., GrisciB., et al.2015. APL: An angle probability list to improve knowledge-based metaheuristics for the three-dimensional protein structure prediction. Comput. Biol. Chem., 59, 142–157.
6.
BourneP., BeranB., BiC., et al.2011. The evolution of the RCSB protein data bank website. WIREs. Comput. Mol. Sci., 1, 782–789.
7.
BrandenC., and ToozeJ.1998. Introduction to Protein Structure, 2nd ed. Garlang Publishing Inc., New York.
8.
ChouP., and FasmanG.1974. Prediction of protein conformation. Biochemistry, 13, 222–245.
9.
CrastoC., and FengJ.2001. Sequence codes for extended conformation: A neighbor-dependent sequence analysis of loops in proteins. Proteins, 42, 399–413.
10.
DeaneC., and BlundellT.1999. Examination of the less favoured regions of the ramachandran plot, 196–208. In Perspectives in Structural Biology. Bangalore University, Bangalore, India: Indian Academy of Sciences. Eds: YathindraN., KolasharA.S., and VijayanM.
11.
DornM., Barbachan e SilvaM., Buriol, et al.2014. Three-dimensional protein structure prediction: Methods and computational strategies. Comput. Biol. Chem., 53, Part B, 251–276.
12.
DornM., Inostroza-PontaM., BuriolL.S., et al.2013. A knowledge-based genetic algorithm to predict three-dimensional structures of polypeptides, 1233–1240. In IEEE Congress on Evolutionary Computation. IEEE, Cancun, MX.
13.
FrishmanD., and ArgosP.1995. Knowledge-based protein secondary structure assignment. Proteins, 23, 566–579.
14.
GibratJ., GarnierJ., and RobsonB.1987. Further developments of protein secondary structure prediction using information theory. New parameters and consideration of residue pairs. J. Mol. Biol., 198, 425–443.
15.
GohlkeH., and KlebeG.2001. Statistical potentials and scoring functions applied to proteinligand binding. Curr. Opin. Struct. Biol., 11, 231–235.
16.
GoodsellD., BurleyS., and BermanH.2013. Revealing structural views of biology. Biopolymers, 99, 817–824.
17.
HeinigM., and FrishmanD.2004. Stride: A web server for secondary structure assignment from known atomic coordinates of proteins. Nucleic Acids Res. 32, W500–W502.
18.
HovmollerT., and OhlsonT.2002. Conformation of amino acids in protein. Acta Crystallogr. 58, 768–776.
19.
HutchinsonE., and ThorntonJ.1996. Promotif: A program to identify and analyze structural motifs in proteins. Protein Sci. 5, 212–220.
20.
JhaA., ColubriA., ZamanM., et al.2005. Helix, sheet, and polyproline II frequencies and strong nearest neighbor effects in a restricted coil library. Biochemistry, 44, 9691–9702.
21.
JonesD.T.1999. Protein secondary structure prediction based on position-specific scoring matrices. J. Mol. Biol., 292, 195–202.
22.
KabatE., and WuT.1973. The influence of nearest-neighbor amino acids on the conformation of the middle amino acid in proteins: Comparison of predicted and experimental determination of β-sheets in concanavalin A. Proc. Natl. Acad. Sci. U. S. A., 70, 1473–1477.
23.
KabschW., and SanderC.1983. Dictionary of protein secondary structure: Pattern recognition of hydrogen-bonded and geometrical features. Biopolymers, 22, 2577–2637.
24.
KabschW., and SanderC.1984. On the use of sequence homologies to predict protein structure: Identical pentapeptides can have completely different conformations. Proc. Natl. Acad. Sci. U. S. A., 81, 1075–1078.
25.
KangH.S., KurochkinaN.A., and LeeB.1993. Estimation and use of protein backbone angle probabilities. J. Mol. Biol., 229, 448–460.
26.
KeskinO., YuretD., GursoyA., et al.2004. Relationships between amino acid sequence and backbone torsion angle preferences. Proteins, 55, 992–998.
27.
KoehlP., and LevittM.1999. Structure-based conformational preferences of amino acids. Proc. Natl. Acad. Sci. U. S. A., 96, 12524–12529.
28.
KolinskiA.2004. Protein modeling and structure prediction with a reduced representation. Acta Biochim. Pol., 51, 349–371.
29.
KryshtafovychA., FidelisK., and MoultJ.2014. CASP10 results compared to those of previous CASP experiments. Proteins, 82, 164–174.
30.
LiljasA., LiljasL., PskurJ., et al.2009. Textbook of Structural Biology. World Scientific Publishing, Toh Tuck Link, Singapore.
31.
MartinJ., LetellierG., MarinA., et al.2005. Protein secondary structure assignment revisited: A detailed analysis of different assignment methods. BMC Struct. Biol., 5, 1–17.
MoelbertS., EmberlyE., and TangC.2004. Correlation between sequence hydrophobicity and surface-exposure pattern of database proteins. Protein Sci., 13, 752–762.
34.
NaganoK.1973. Logical analysis of the mechanism of protein folding: I. predictions of helices, loops and β-structures from primary structure. J. Mol. Biol., 75, 401–420.
35.
PaulingL., and CoreyR.1951. The pleated sheet, a new layer configuration of polypeptide chains. Proc. Natl. Acad. Sci. U. S. A., 37, 251–256.
36.
PaulingL., CoreyR., and BransonH.1951. The structure of proteins: Two hydrogen-bonded helical configurations of the polypeptide chain. Proc. Natl. Acad. Sci. U. S. A., 37, 205–211.
37.
PetersenM., JonsonP., and PetersenS.1999. Amino acid neighbours and detailed conformational analysis of cysteines in proteins. Protein Eng., 12, 535–548.
38.
RamachandranG., and SasisekharanV.1968. Conformation of polypeptides and proteins. Adv. Protein Chem., 23, 238–438.
39.
RichardsF.M., and KundrotC.E.1988. Identification of structural motifs from protein coordinate data: Secondary structure and first-level supersecondary structure. Proteins, 3, 71–84.
40.
RichardsonJ.1981. The anatomy and taxonomy of protein structure. Biopolymers, 34, 167–339.
41.
RussW., and RanganathanR.2002. Knowledge-based potential functions in protein design. Curr. Opin. Struct. Biol., 12, 447–452.
42.
ScheefE.D., and FinkJ.L.2005. Fundamentals of protein structure, vol. 44, chap. 2, 15–39. In BourneP.E., and WeissigH., eds. Structural Bioinformatics, 1st ed. John Wiley and Sons, Inc., New York.
43.
SunZ., and JiangB.1996. Patterns and conformations of commonly occurring supersecondary structures (basic motifs) in protein data bank. J. Protein Chem., 15, 675–690.
44.
TaylorW.R.2012. Patterns in Protein Sequence and Structure, 1st ed. Springer Publishing, Heidelberg, Germany.
45.
TingD., WangG., ShapovalovM., et al.2010. Neighbor-dependent Ramachandran probability distributions of amino acids developed from a hierarchical Dirichlet process model. PLoS Comput. Biol., 6, e1000763.
46.
TramontanoA.2006. Protein Structure Prediction: Concepts and Applications, 1st ed. John Wiley and Sons, Inc., Weinheim, Germany.
47.
XiaX., and XieZ.2002. Protein structure, neighbor effect, and a new index of amino acid dissimilarities. Mol. Biol. Evol., 19, 58–67.