
Abstract
Abstract
An important problem in computational biology is the identification of potential points of intervention that can lead to modified network behavior in a genetic regulatory network. We consider the problem of deducing the effect of individual genes on the behavior of the network in a statistical framework. In this article, we make use of biological information from the literature to develop a Bayesian network and introduce a method to estimate parameters of this network using data that are relevant to the biological phenomena under study. Then, we give a novel approach to select significant nodes in the network using a decision-theoretic approach. The proposed method is applied to the analysis of the mitogen-activated protein kinase pathway in the plant defense response to pathogens. Results from applying the method to experimental data show that the proposed approach is effective in selecting genes that play crucial roles in the biological phenomenon being studied.
1. Introduction
T
The world's growing population has made food security a global concern. One of the key factors that impacts food security is the loss of crops due to diseases caused by plant pathogens (Strange and Scott, 2005). Many plant-associated microbes are parasitic organisms that impair plant growth and reproduction. Plants possess inherent immune receptors that detect the presence of microbial pathogens and trigger defense responses against a multitude of harmful pathogens. But, due to adaptive evolution and the fight for survival, pathogens have developed various strategies to invade host plant tissue undetected and cause infections that render food crops unfit for consumption. A number of plant biological studies have implicated the mitogen-activated protein kinase (MAPK) cascade in plant cell signaling as the point of convergence of various stress stimuli (Brader et al., 2007). Hence, there has been a lot of research in targeting specific components of the MAPK pathway in an effort to improve disease resistance in crop plants. A mathematical model of the interactions among the components of the MAPK pathway is a critical tool in obtaining a better understanding of the nature of these interactions and advocating intervention strategies for breeding disease-resistant crops.
A number of methods have been proposed for the selection of “important” genes from a large set of genes. The most widely mentioned among these are based on sample classification of huge volumes of genotypic and phenotypic data using numerous data mining techniques such as support vector machines (Guyon et al., 2002), regression techniques (Shevade and Keerthi, 2003), random forest (Díaz-Uriarte and De Andres, 2006), and so on. A lot of work has been presented on using clustering methods to pick significant genes (Alon et al., 1999; Ben-Dor et al., 1999; Bittner et al., 2000). Gene ranking methods use feature selection criteria to pick genes that show a lot of variation among different treatment conditions.
However, the genes selected from these methods may be irrelevant to the biological phenomena being studied or it may even be difficult to ascribe biological connotations to the genes selected from many of these methods, since gene expression patterns alone may not convey the essence of interactions among genes.
Another popular approach for analyzing and making sense of microarray gene expression data is the construction of genetic regulatory networks. There has been a lot of interest in looking at the interaction among genes in a holistic manner, because the activities of genes are not isolated or independent of each other. Hence, network perspectives are integral to our understanding of biological interactions and to channel this insight to develop successful intervention methodologies. There have been a number of attempts at modeling genetic regulatory networks, such as Boolean network models (Kauffman, 1969), differential equation models (Mestl et al., 1995), probabilistic Boolean network models (Shmulevich et al., 2002), and Bayesian network (BN) models (Friedman et al., 2000; Werhli and Husmeier, 2007).
One of the most important sources of biological knowledge available from years of experimental observations by biologists is in the form of signaling pathways. Signaling pathways illustrate the interactions among the various biological elements present in them. Although the signaling pathways available from the literature are not an accurate description of the underlying biological phenomena, they are constructed from biological experiments that are aimed at uncovering marginal (pair-wise) cause–effect relationships between genes involved in a biological process.
There has been a lot of recent work in integrating biological pathway knowledge with genome-level data to perform inferences on models that are closer representations of the actual biological system. WGCNA (Langfelder and Horvath, 2008) is a package in R language for weighted correlation network analysis. WGCNA can be used to construct correlation networks using genomic data and to find clusters of correlated genes. It also provides methods for defining other biologically relevant measures by using biological knowledge about genes, in addition to experimental data. The algorithm SPIA (Signaling Pathway Impact Analysis) (Tarca et al., 2009) is a pathway impact analysis technique that uses traditional pathway enrichment in combination with a pathway perturbation measure to facilitate pathway ranking in multiple disease datasets. PARADIGM (PAthway Recognition Algorithm using Data Integration on Genomic Models) (Vaske et al., 2010) uses a factor graph approach to deduce pathway activities by integrating multiple types of biological data such as copy number, mRNA expression, and so on for the same disease condition. In both SPIA and PARADIGM, the focus is on detecting pathways that are more significant in a disease so that targeted therapy can be developed. Zodiac (Zhu et al., 2015) is a recently proposed technique that is used to integrate biological knowledge about genetic interactions in cancer along with experimental data to obtain an enhanced interaction map.
In this article, we describe a methodology that utilizes current biological knowledge from the literature to build genetic regulatory network models and integrates this knowledge with experimental genomic data using a BN-based approach. BNs are a class of directed acyclic graphs (DAGs) that encode independencies in a given network. BNs are a natural fit to the problem at hand, since they can be used to represent causal relationships, similar to the nature of relations in biological signaling pathways. The state of each node in a BN is described by a probability distribution. A node with an outgoing edge pointing to another node is said to be a “parent” of the latter node. Nodes that have no parents (no incoming edges) have marginal probability distributions; whereas the other nodes have conditional probability distributions describing their state, conditioned on the states of their parents. Using the idea of decision making under uncertainty, we also provide a novel framework to select influential genes that govern the behavior of the network in a given environment. More specifically, our interest is in choosing genes that can be intervened with to manipulate pathway dynamics. This is the major difference between our method and other pathway analysis methods mentioned earlier. Although most gene selection methods are basically feature selection methods for classification or clustering, our technique is aimed at identifying genes for intervention. We use the proposed method to analyze the MAPK network in the plant defense response pathway.
The rest of the article is organized as follows. Section 2 is a brief review of some basic concepts related to BNs. In Section 3, we elaborate on the framework and the approach to integrate experimental data into the BN framework, and we also discuss the algorithm for selection of potential targets for intervention. The biological knowledge on plant-pathogen interaction is presented in Section 4. Section 5 is a description of simulations and results obtained from applying our approach to plant genomic datasets. Concluding remarks are presented in Section 6.
2. Modeling Bn
BN models are promising tools for the analysis of genetic regulatory networks, primarily because the interactions among the components of a gene regulatory network are sparse: Each gene is controlled by only a limited number of other genes, which is a very small number compared with the total number of genes in an organism. Moreover, biological systems are inherently stochastic, and the probabilistic nature of BNs gives them the ability to cope with the uncertainties involved in gene networks. A BN is a compact representation of complex relationships among a large number of random variables. This representation consists of (i) a DAG and (ii) a conditional probability distribution for each variable, given its parents in the graph. The graph represents conditional independence properties, according to which the joint probability distribution of the BN gets factorized (Pearl, 2014).
We review some basic definitions and notations of BNs in this section. A BN is defined by a pair
Any joint distribution that satisfies the Markov assumption can be decomposed into the product form
where
Once we obtain the graph structure G of the BN, we proceed to the next stage of our algorithm, which is to update the model parameters using gene expression data. Though many approaches to gene expression analysis use real-valued data, we use a binary framework to describe the state of a gene at a given time. The reason for using binary quantized gene expression values is manifold. Although the expression value of a gene is continuously varying, only certain large variations in the expression of one gene regulating the other leads to a change in the expression of the gene being regulated. It is these changes that we are concerned with in this work, since our primary aim is to understand and quantify the effect of one gene on another. Working in the binary domain also offers several advantages such as noise robustness and computational simplicity. We adopt the procedure introduced by Otsu (1975) to select a threshold for discretizing gene expression data. Expression values above the threshold are assigned a 1, and those below the threshold are assigned a 0.
We now proceed to illustrate the process of integration of gene expression data with the BN model. Consider a BN with N nodes. Let
where C is a normalization constant, given by the reciprocal of the beta function with parameters
The prior can be assumed to have a uniform (flat) distribution before experimental data are observed. This is the case where both
The observed data points form the likelihood in the Bayesian setting. Given the distribution of
Here, Pa(X) denotes the set of parents of a node X, B represents the binomial distribution, k is the number of successes observed,
We choose a beta-distributed prior, because the beta distribution is known to be conjugate to the binomial likelihood. Whenever we have a conjugate prior, the posterior distribution belongs to the same family of distributions as the prior (Hoff, 2009). Hence, the conditional posterior probability distributions of the nodes are beta distributed with shape parameters
where
For the purpose of illustration, let us consider the BN shown in Figure 1, with two binary-valued nodes A and B. Let the probability of success parameter

A simple Bayesian network with two nodes A and B, connected such that A is the parent of B.
Table showing sample observations over multiple trials for binary valued random variables A and B that are connected as shown in the graph in Figure 2.
Then, the posterior probability distribution of
where
In a similar manner, the conditional posterior probability distribution of
where
As more data are observed, we can update the values of
3. Identifying Significant Genes
Given a genetic regulatory network, it is important to differentiate between those genes that have a major influence on the regulation of the child gene and those that only have a minor influence. Biologically, a gene with stronger influence on another gene has the potential to regulate the dynamics of the network, overshadowing the effect of other genes that have minimal influences. Many such biological relationships are known to exist. For instance, the activation of the p53 oncogene, which is a well-known tumor suppressor, actively leads to the expression of various genes that promote apoptosis; whereas p73, another tumor suppressor belonging to the same group of signaling pathway elements, is less efficacious in activating apoptotic genes (Vazquez et al., 2008).
Our objective is to maintain some downstream reporter nodes in the network at certain desirable states. In such a scenario, we have different options for the choice of point(s) of intervention to prod the network toward the specific behavior that we are interested in. For each gene, we have an associated probability distribution over its possible states and its influence on a desired node in the network. Therefore, the gene selection problem is essentially a problem of decision making under uncertainty. To find optimal decisions, we assign numerical utilities to all possible outcomes and then choose the decisions that result in maximal utility value.
Utility is a subjective notion, and the design of the utility function depends on the objective of the action (gene intervention in our case) and the nature and preference for tools available to cause the action. For instance, in the case of gene intervention, gene knockouts may be easier than gene activation, have stronger downstream effects, and, hence, have more utility to the biologist, depending on the type of genetic network under consideration. We illustrate the decision-making process using an example.

Example of Bayesian network. The marginal probabilities of binary valued nodes X and Y are shown in the table alongside the figure.
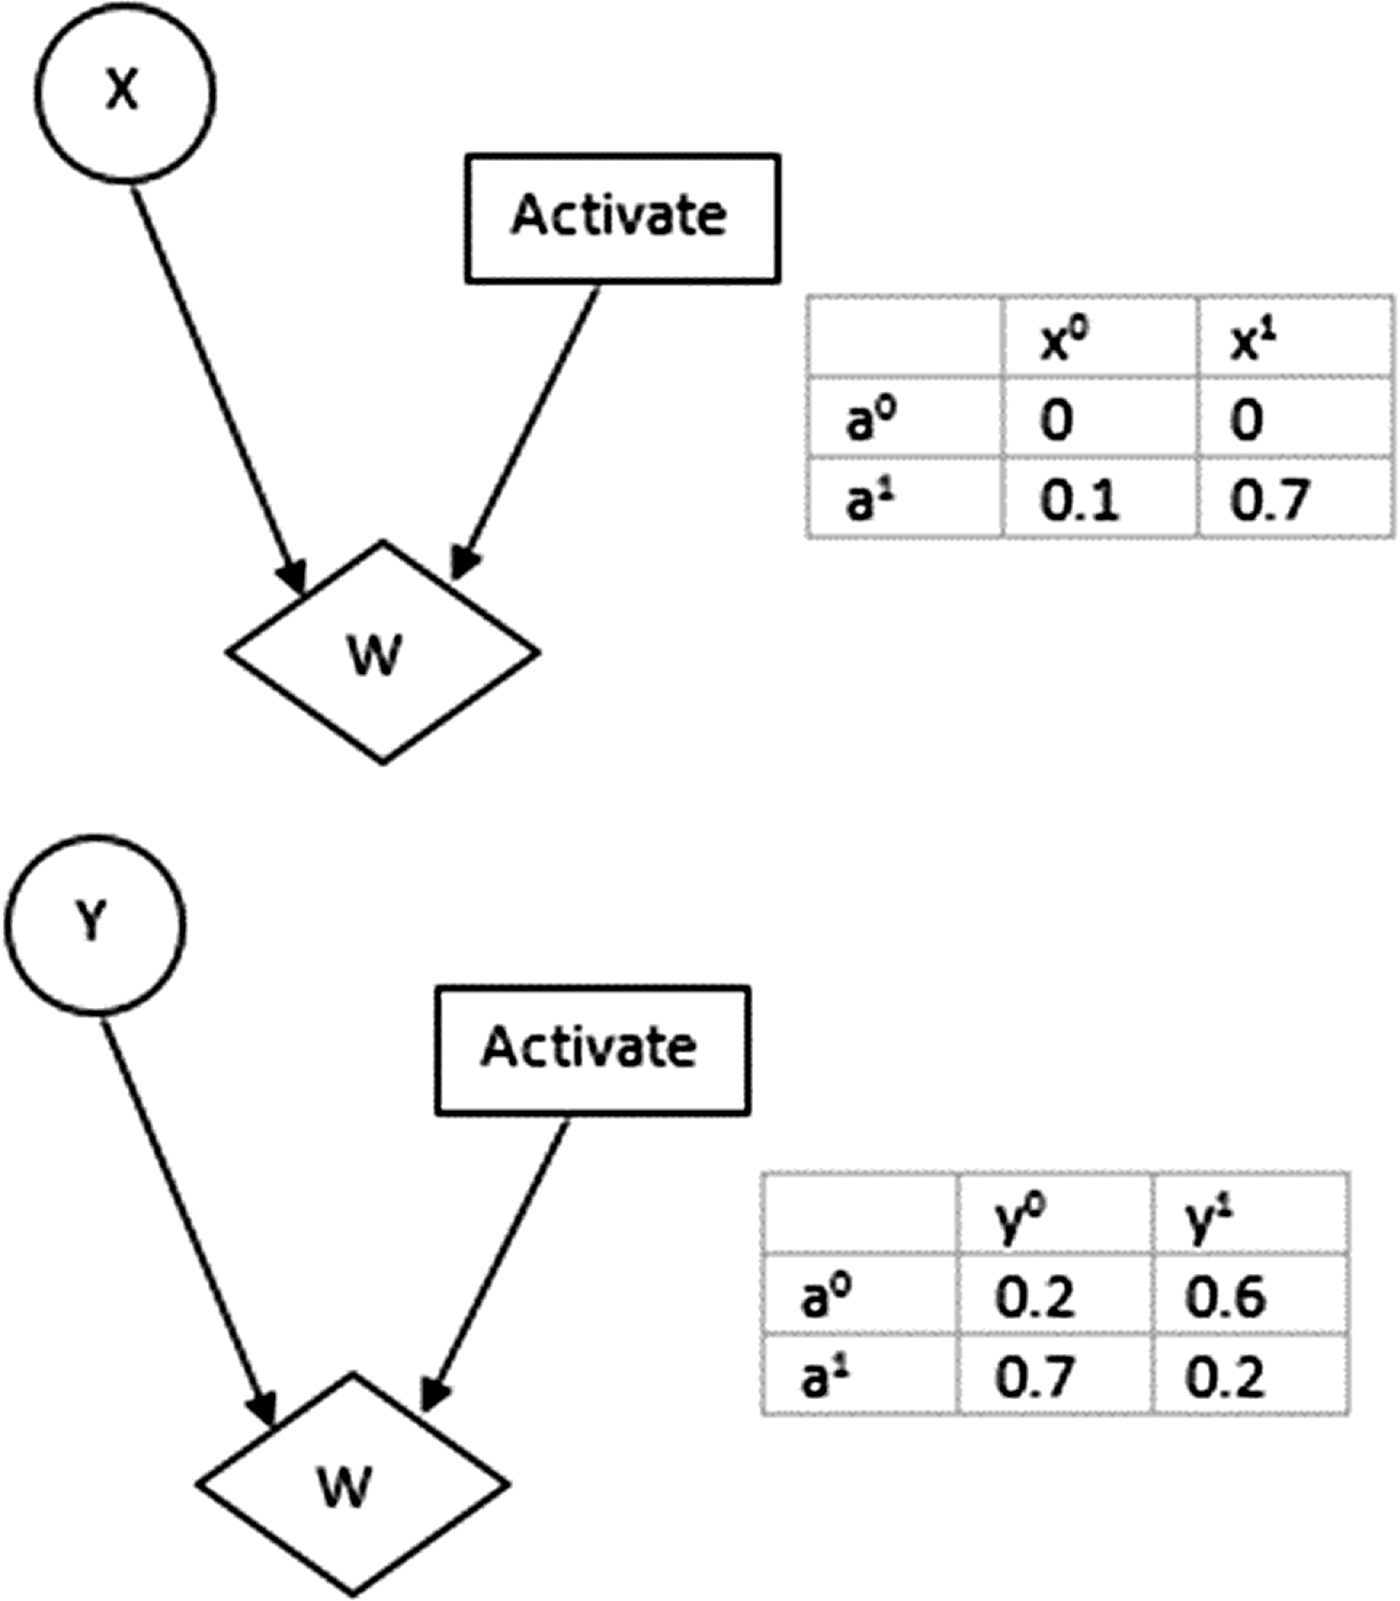
Influence diagrams and tables showing utility values of node X and node Y corresponding to different states of node “Activate”: a1 and a0. Variables X and Y each have two possible states x0, x1, and y0, y1, respectively.
Figure 4 is the corresponding decision tree for the scenario in the example. A decision tree is nothing but a graphical representation of all possible scenarios that might be encountered in a decision problem, and the corresponding outcomes and their utility values. A common approach to arrive at profitable decisions in the decision tree is to employ the backward induction algorithm. The algorithm moves backward in the tree, beginning from the leaves, computing the maximum expected utility (MEU) achievable at each node. The MEU at a leaf is the utility value associated with that leaf's outcome. As we move up the tree, if we encounter a nature node (i.e., not a decision node), the MEU is the weighted average of the expected utilities at each of the node's children, where each child's utility is weighted according to the distribution defined by nature over the node's children. If the node encountered is a decision node, a decision is made to select the child whose MEU is the largest. The expected utility for each action is given by
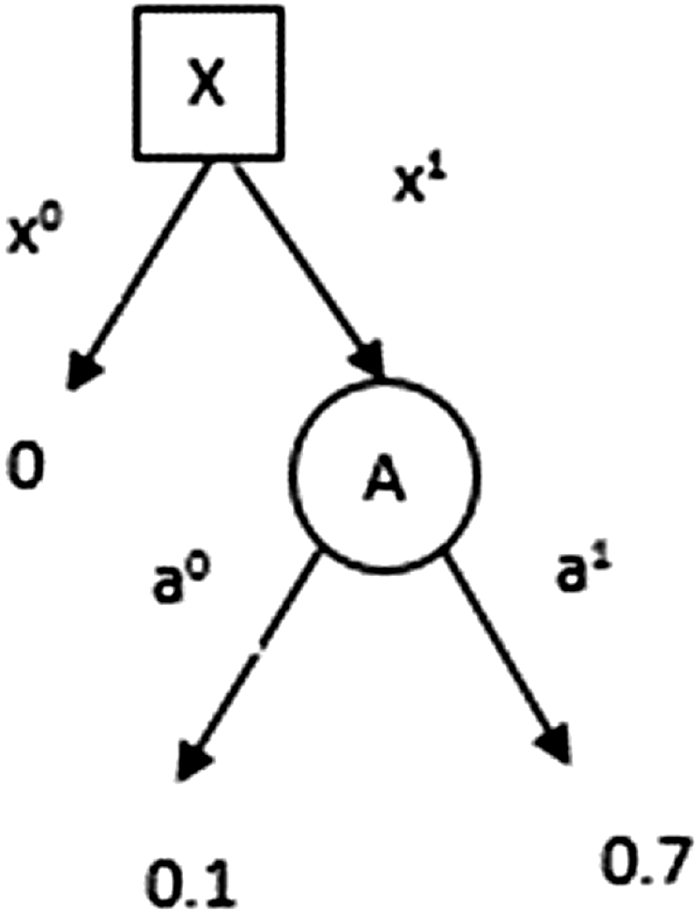
Decision tree constructed from the influence diagram, illustrating the process of selecting the most advantageous action for node X, using the backward induction algorithm.
In this example, the MEU for node X is given by
and the maximizing action is a1. However, node Y has an MEU of
and the maximizing action is a0. Hence, inhibition of Y is the preferred decision to maximize the expected utility.
The principle of MEU and the backward induction approach have been discussed amply in the literature (Aumann, 1995; Vapnik, 2013). We proceed to use these techniques in the plant MAPK network where the goal is to find important lever genes that can be used to manipulate the global behavior of the defense response network. We consider two important factors in the design of the utility function: The first factor is the effect of the gene on the utility variable; and second, the fact that the effort involved in flipping a gene depends on its predisposition to be activated or inactivated, given that other genes that influence it are in a certain state. A naïve way to determine the best set of genes is to exhaustively score each possible combination of genes and to pick the set with the maximum utility. However, one can devise a better algorithm by making use of the recursive nature of the computations for determination of the utility value. Algorithm 1 is a stepwise description of our algorithm that makes use of MEU to select points of intervention in the genetic regulatory network.
Algorithm for selecting significant genes
4. Mapk Cascade in Plant Defense
Plants are immobile organisms that rely on their innate immunity to prevent harmful microorganisms such as fungi, oomycetes, bacteria, and viruses from invading them and causing infectious diseases. Plant surface structures such as spines, thorns, and trichomes form the first line of defense against potentially destructive organisms. In addition to these constitutive defenses, plants also possess inducible defenses that are triggered in response to attack. The plant immune system is composed of sensors that can recognize microbial molecules such as chitin, lipopolysaccharides, peptidoglycan, flagellin, elongation factor thermo unstable, and so on, collectively termed as microbe-associated molecular proteins (MAMPs), and responds accordingly by altering gene expression and metabolism to localize the invasion of the pathogen. These sensors, or pattern recognition receptors (PRRs), are essentially receptor-like kinases (RLKs) and receptor-like proteins that are in a rest state before ligand binding. When certain microbial molecules bind to the PRRs, a number of downstream plant defense response genes are activated, and the phenomenon is known as MAMP-triggered immunity (De Wit, 2007).
Well-adapted microbial pathogens have developed mechanisms to elude detection by RLKs, thereby evading the induction of primary defense responses. The secretion system of bacteria plays a major role in this process. Molecules called effectors, injected by the bacterial secretion system directly into the cytoplasm of the host plant cells, are capable of suppressing the primary defense response of plants (Galán and Collmer, 1999). Plants, in turn, have evolved a secondary defense mechanism to defend themselves against such potent pathogens, based on a class of specialized resistance genes (R genes) that monitor the pathogen-injected intracellular effectors and activate a cascade signaling that leads to defense response.
The eventual transcription of major plant defense genes is regulated by the MAPK pathway. MAPKs are phosphorylating enzymes representing main signal transducers in plants. They are organized in protein complexes, so-called MAPK modules, which are held together by scaffold protein. MAPK pathways are highly conserved central regulators of proliferation and stress response in all eukaryotes. An MAPK cascade consists of an MAPKKK-MAPKK-MAPK module linked in various ways to upstream receptors and downstream targets. During signal transduction, MAP3Ks (MAPKKK) and MAP2Ks (MAPKK) are stepwise phosphorylated and activated on serine (S) or threonine (T) residues; whereas MAPKs must be double phosphorylated on both threonine (T) and tyrosine (Y) residues. Activated MAPKs are released from MAPK modules that relocate within the cell and regulate a broad range of substrates (e.g., transcription factors, protein kinases, and cytoskeletal proteins) that are localized in diverse subcellular compartments (nucleus, cytosol, and cytoskeleton). This subcellular compartmentalization of MAPK modules and targets of activated MAPKs is believed to bring some specificity to the MAPK signaling (Meng and Zhang, 2013).
In this article, we focus on the MAPK network and the genes involved in the signaling cascade of the MAPK pathway that are specific to plant defense response. Though high-throughput arrays provide measurements for thousands of genes, interactions among genes in small important networks are believed to have major impacts on disease conditions, which is another reason why we focus on the MAPK subnetwork of the plant defense response. We use a BN model of the MAPK pathway and perform inference on this model as described in Section 2 to update the parameters of this model. The KEGG pathway database (Kanehisa and Goto, 2000; Kanehisa et al., 2014) is a repository of molecular interactions and serves as a gold standard for biological signaling pathways. The structure of the MAP Kinase cascade, shown in Figure 5, is obtained from the set of plant-pathogen interactions reported in the KEGG database for the model plant species Arabidopsis thaliana.
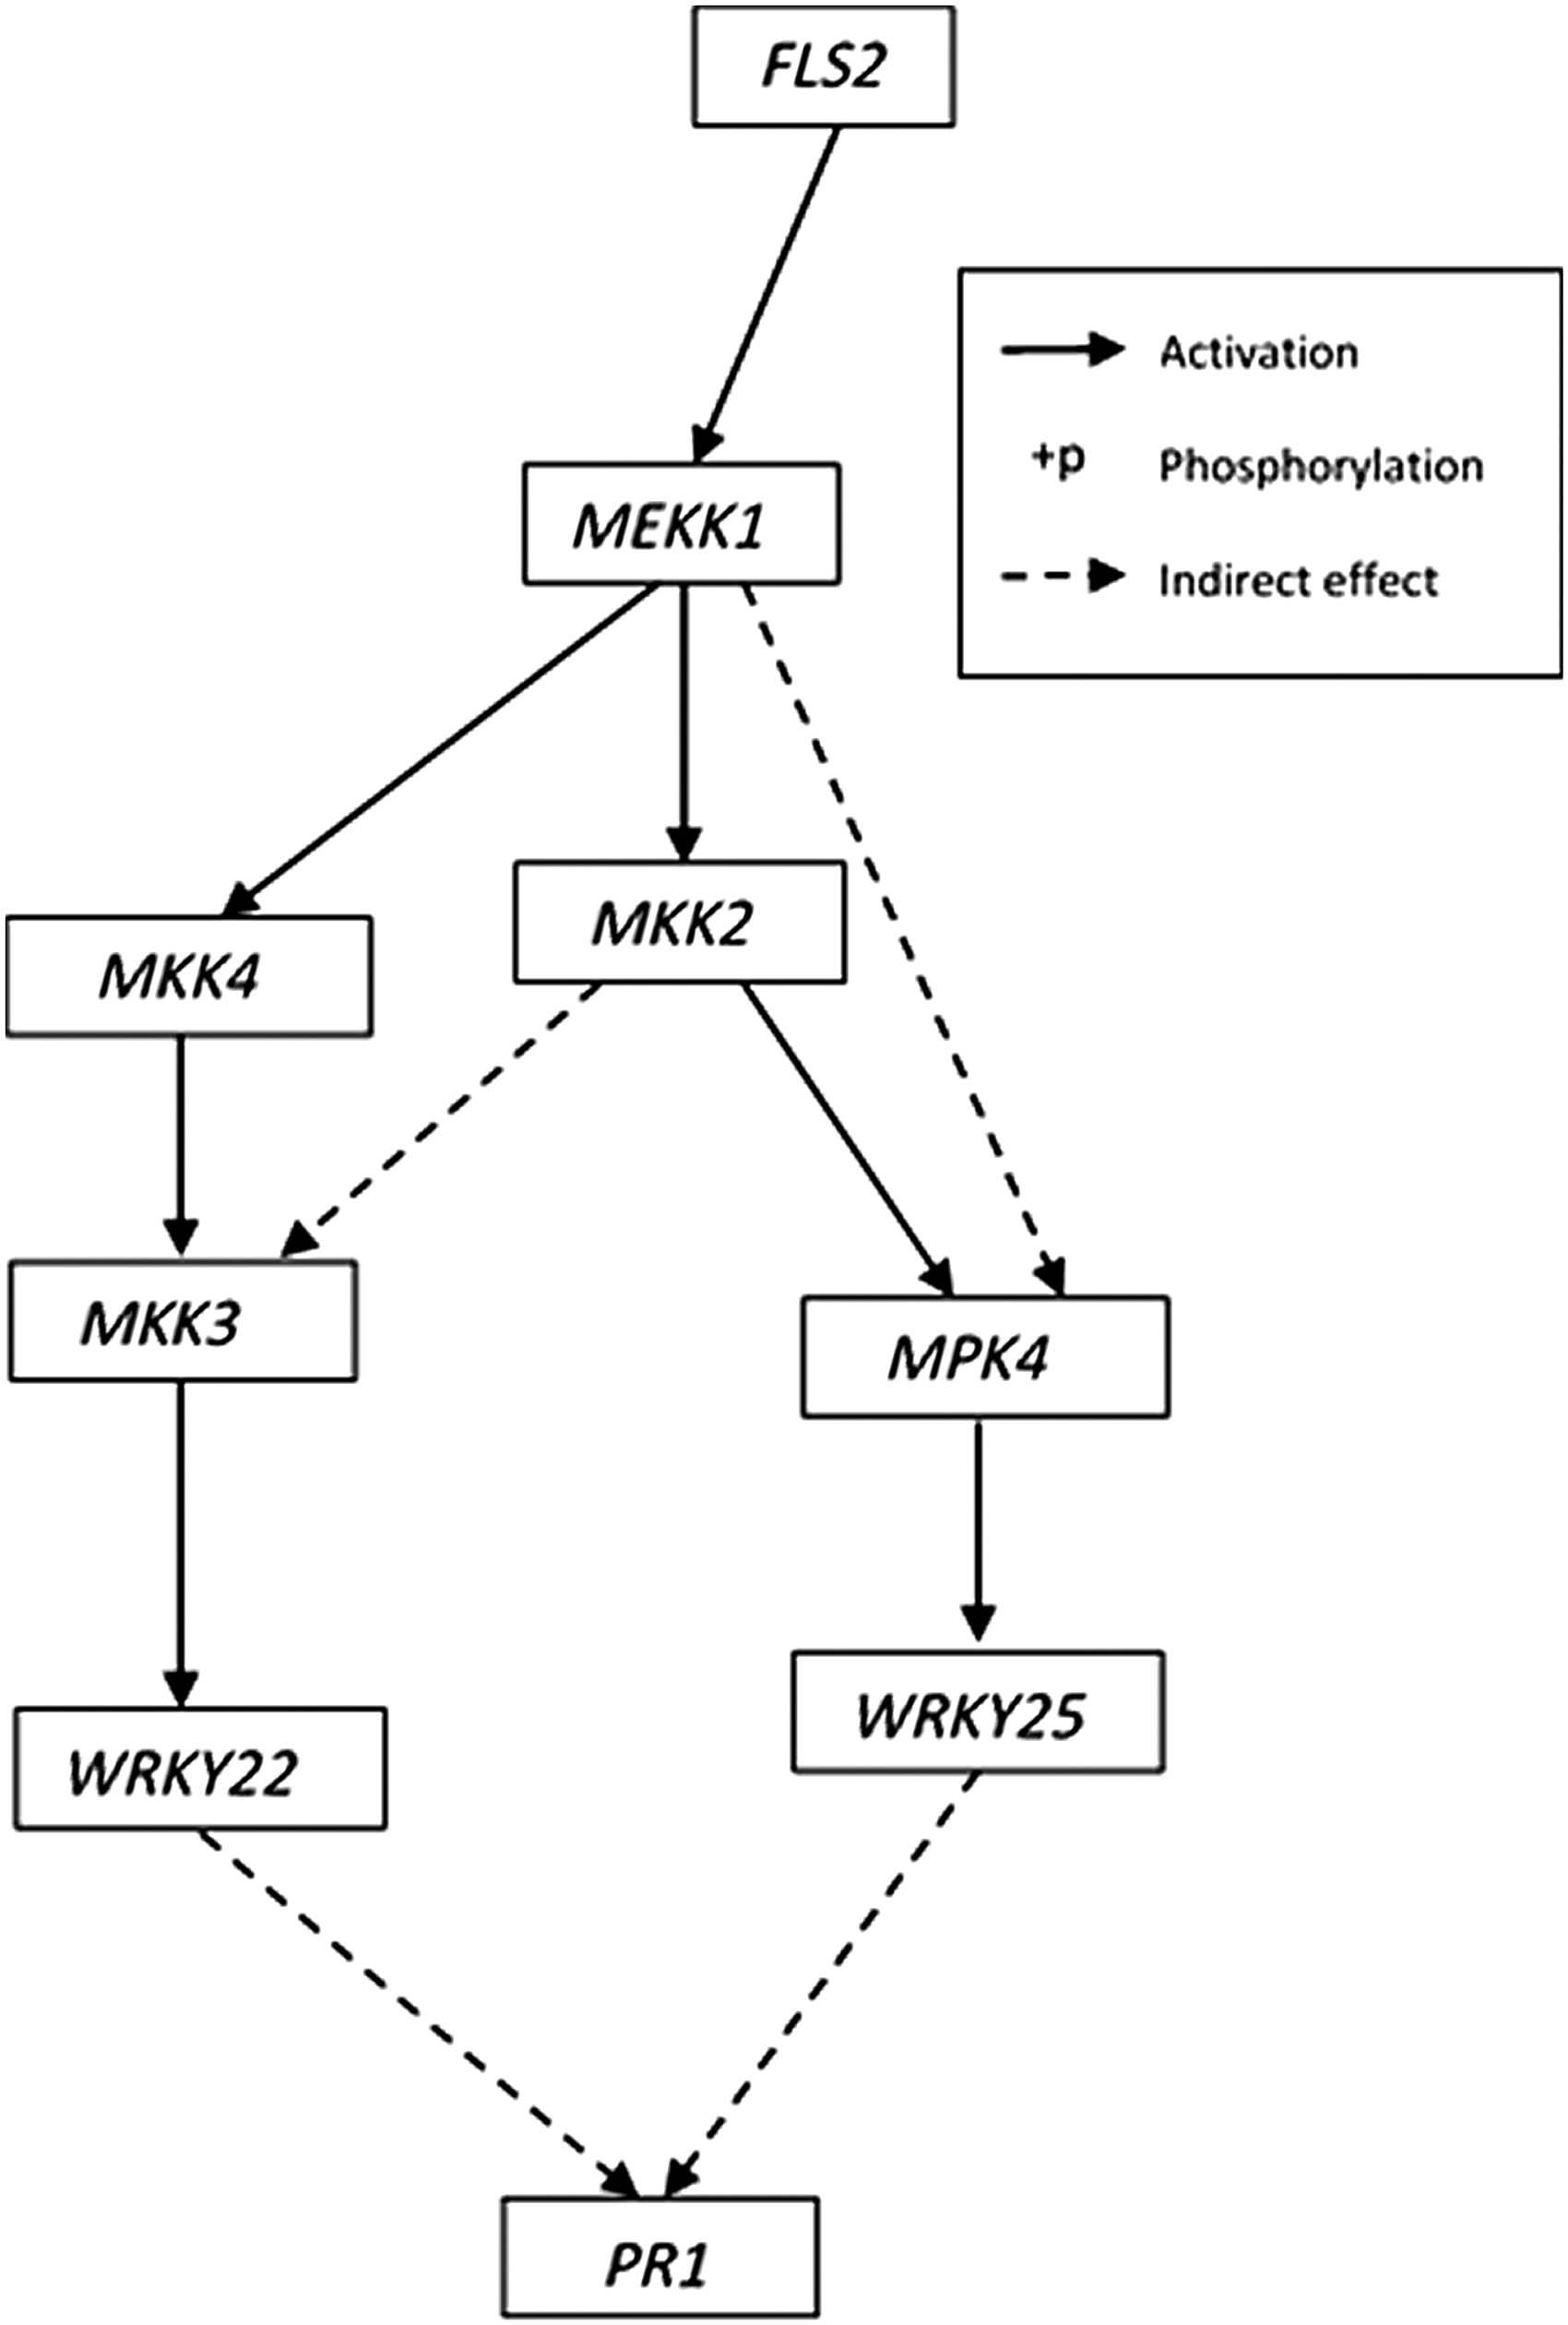
Structure of the mitogen-activated protein kinase cascade. The cascade culminates in the activation of the plant defense response gene PR1. PR1, pathogenesis-related protein 1.
5. Simulations
In this section, we discuss the application of our method to select important points of intervention in the plant defense response to pathogens. We specifically look at the interaction of the plant A. thaliana with bacterial pathogens. Arabidopsis is widely used as a model plant, since it is easily manipulated, genetically tractable, and a lot of knowledge is available about the behavior of the plant under various stress conditions. We use experimental data obtained over multiple experiments and deposited in the publicly accessible NCBI database (Edgar et al., 2002). The results obtained from the application of our approach to these datasets are interpreted in a biologically meaningful way.
5.1. Data sets
We use real data sets to test the performance of our BN model. Three gene expression series data sets GSE17464, GSE19109, and GSE18978 were obtained from the NCBI GEO database. Each of these datasets contain gene expression data obtained from experiments where the Arabidopsis plant was exposed to bacterial molecules, and the gene expression changes induced by this stimulus were measured using microarrays.
5.2. BN estimation
The BN graph of the plant-pathogen interaction pathway is as shown in Figure 5. The parameters that encode the probability distributions of nodes in the network are shown in Figure 6. The expression values of the nodes were extracted from the datasets using R Bioconductor software (Gentleman et al., 2004) and discretized. The datasets were pooled to generate the sequence of observations used to update the parameters of the BN.
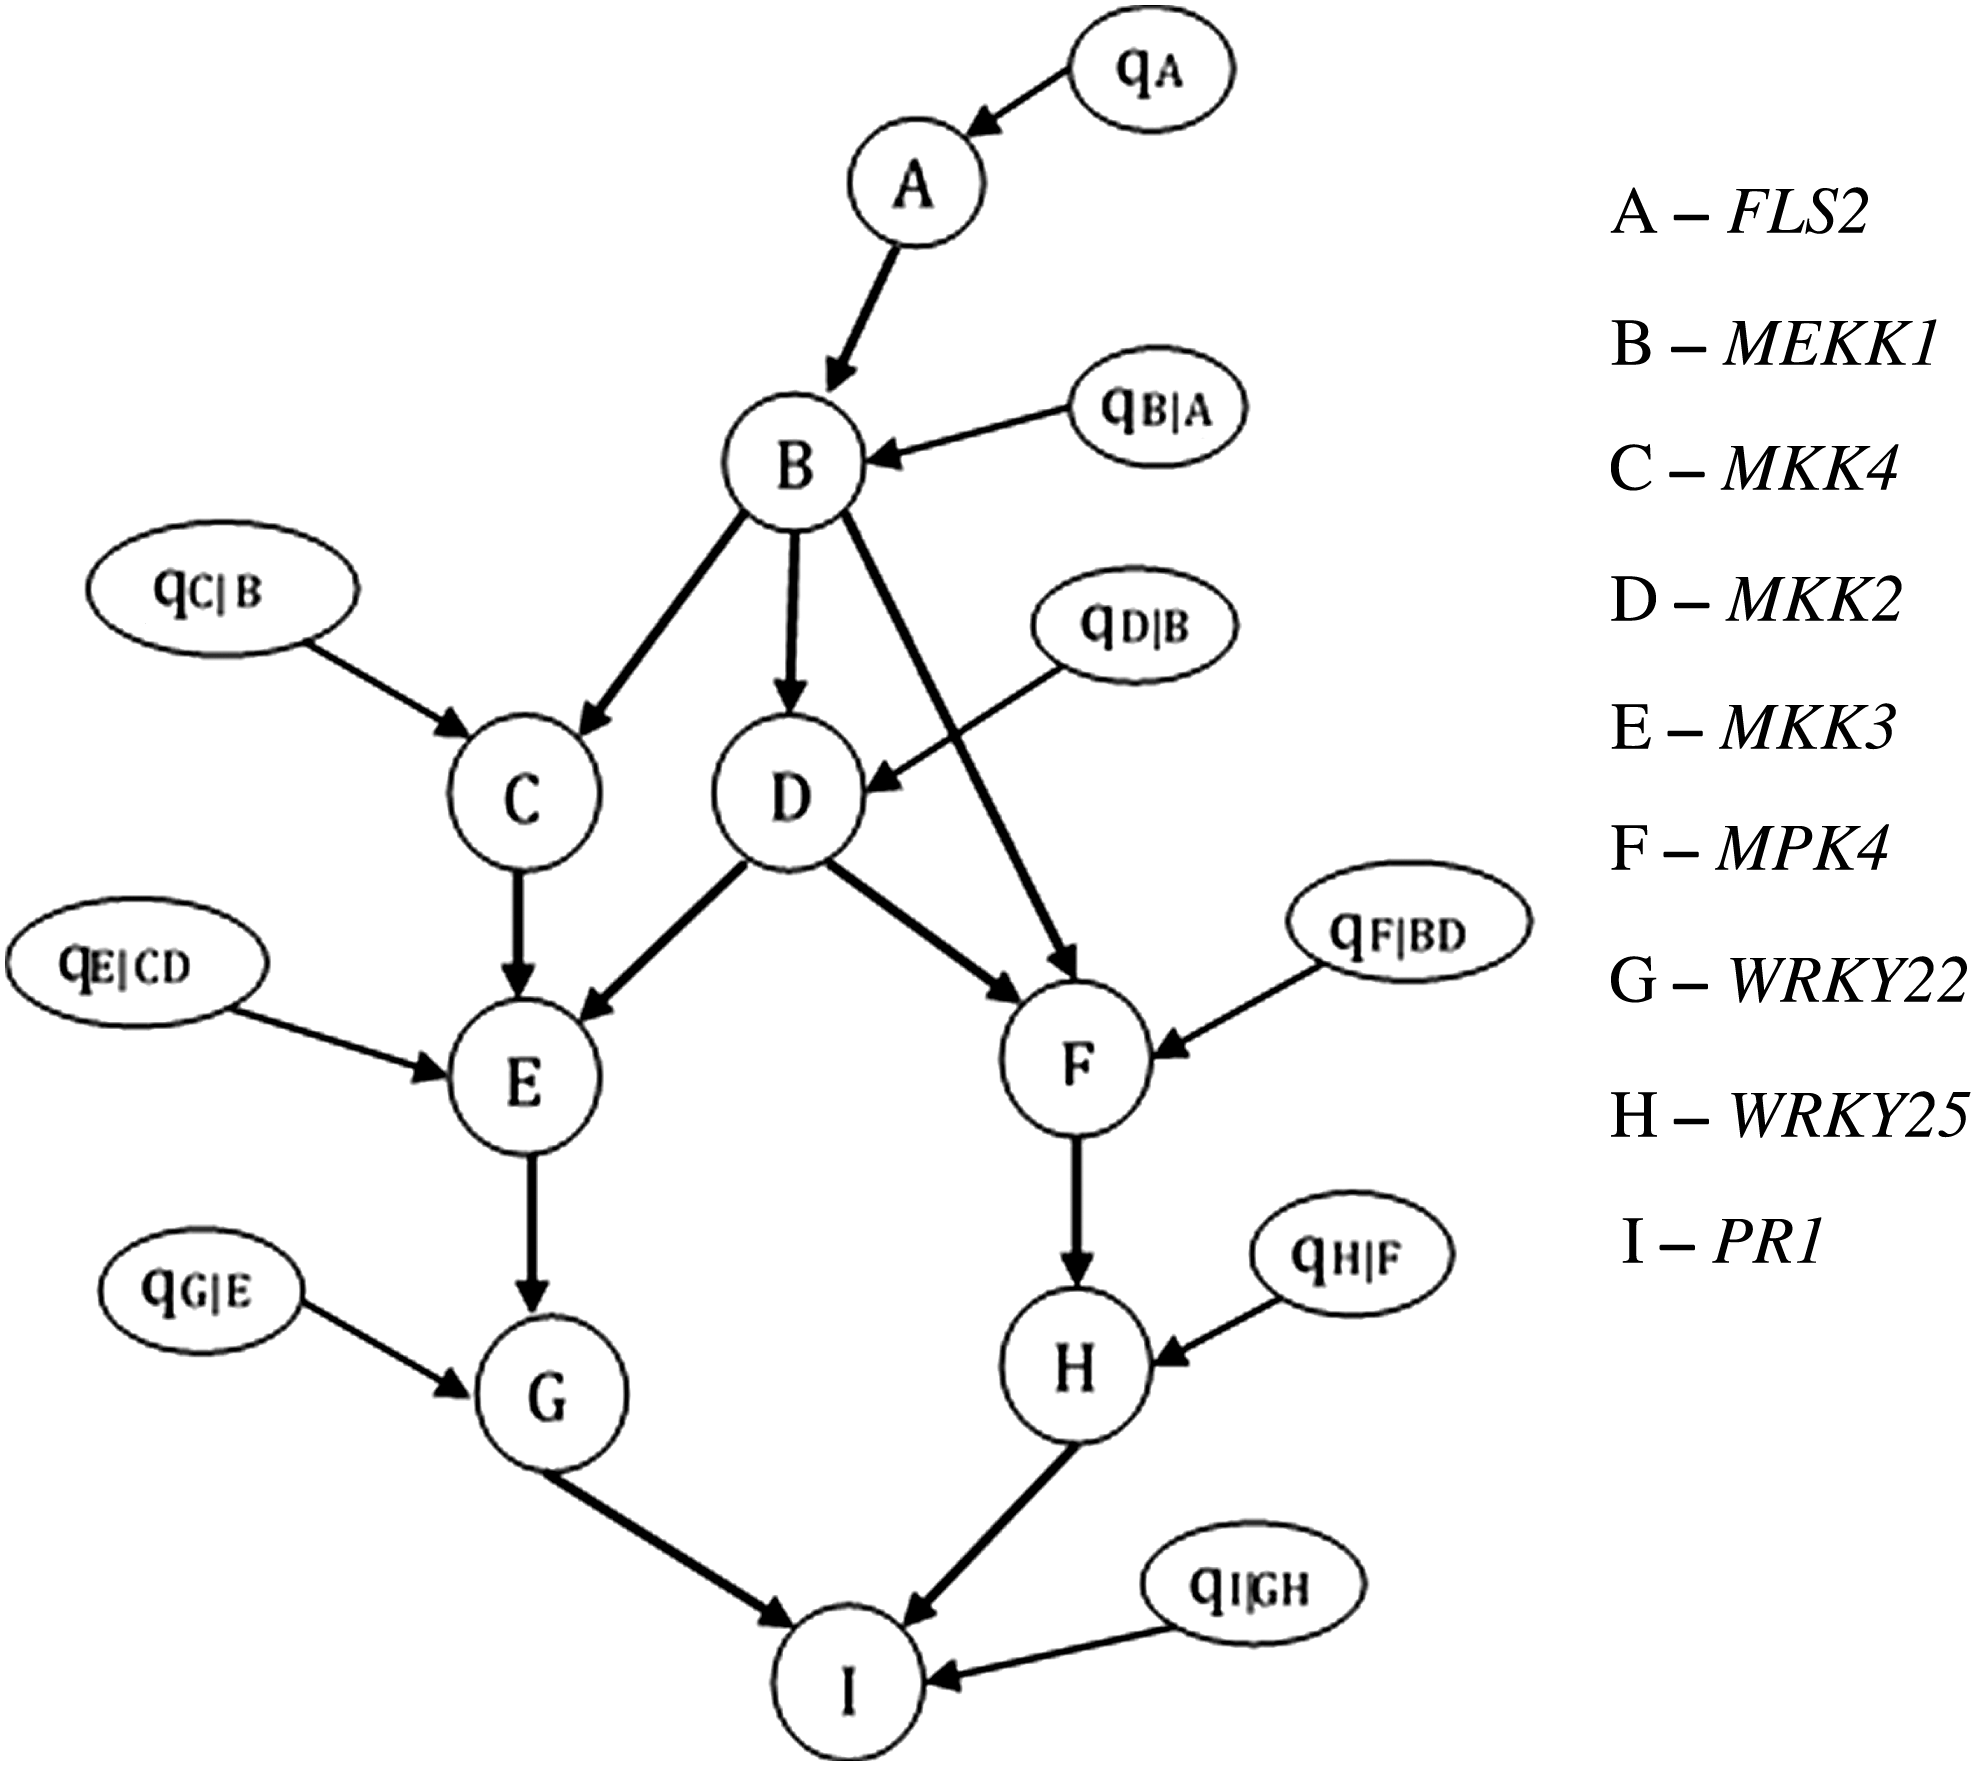
Bayesian network model illustrating the conditional dependencies in our network. The parameters qA,
We ran simulations for analyzing the behavior of our model. Initially, we take the prior for all nodes to be
The expectations of the updated posterior probabilities are tabulated in Table 2. Here, the means shown are the expected values of each state of each node conditioned on each possible combination of states of its parent nodes. For instance, the expectation value
The means of beta posterior conditional probability distributions for each of the nodes computed using Algorithm 1 are shown in the table.
5.3. Selection of points of intervention
The BN and the conditional probability table associated with the BN are used to select significant nodes in the network. Let us consider that our goal is to achieve transcription of the defense response gene pathogenesis-related protein 1 (PR1). This is the leaf node of the network shown in Figure 5. Since we want PR1 (node 1) to be in an activated state, we associate a utility value of 0, with PR1 being in state 0. Then, for each node in the network, we use the approach explained in Section 3 to compute the expected utility value and to select the nodes with maximal expected utility to be the points of intervention. In this work, we only consider single interventions. It is also possible to think of scenarios with combinations of interventions. Figure 7 is a graphical representation of the utility obtained through distinct interventions at each of the nodes in the network with the goal of maintaining the reporter node PR1 at 1. The first bar in the graph shows the utility associated with activation of gene FLS2, and the second bar is the utility obtained on inhibition of gene FLS2. The rest of the bars show utilities for each of the other genes, on activation and inhibition. In this network, activation of the network elements has more utility value than their inhibition, as seen from the graph.
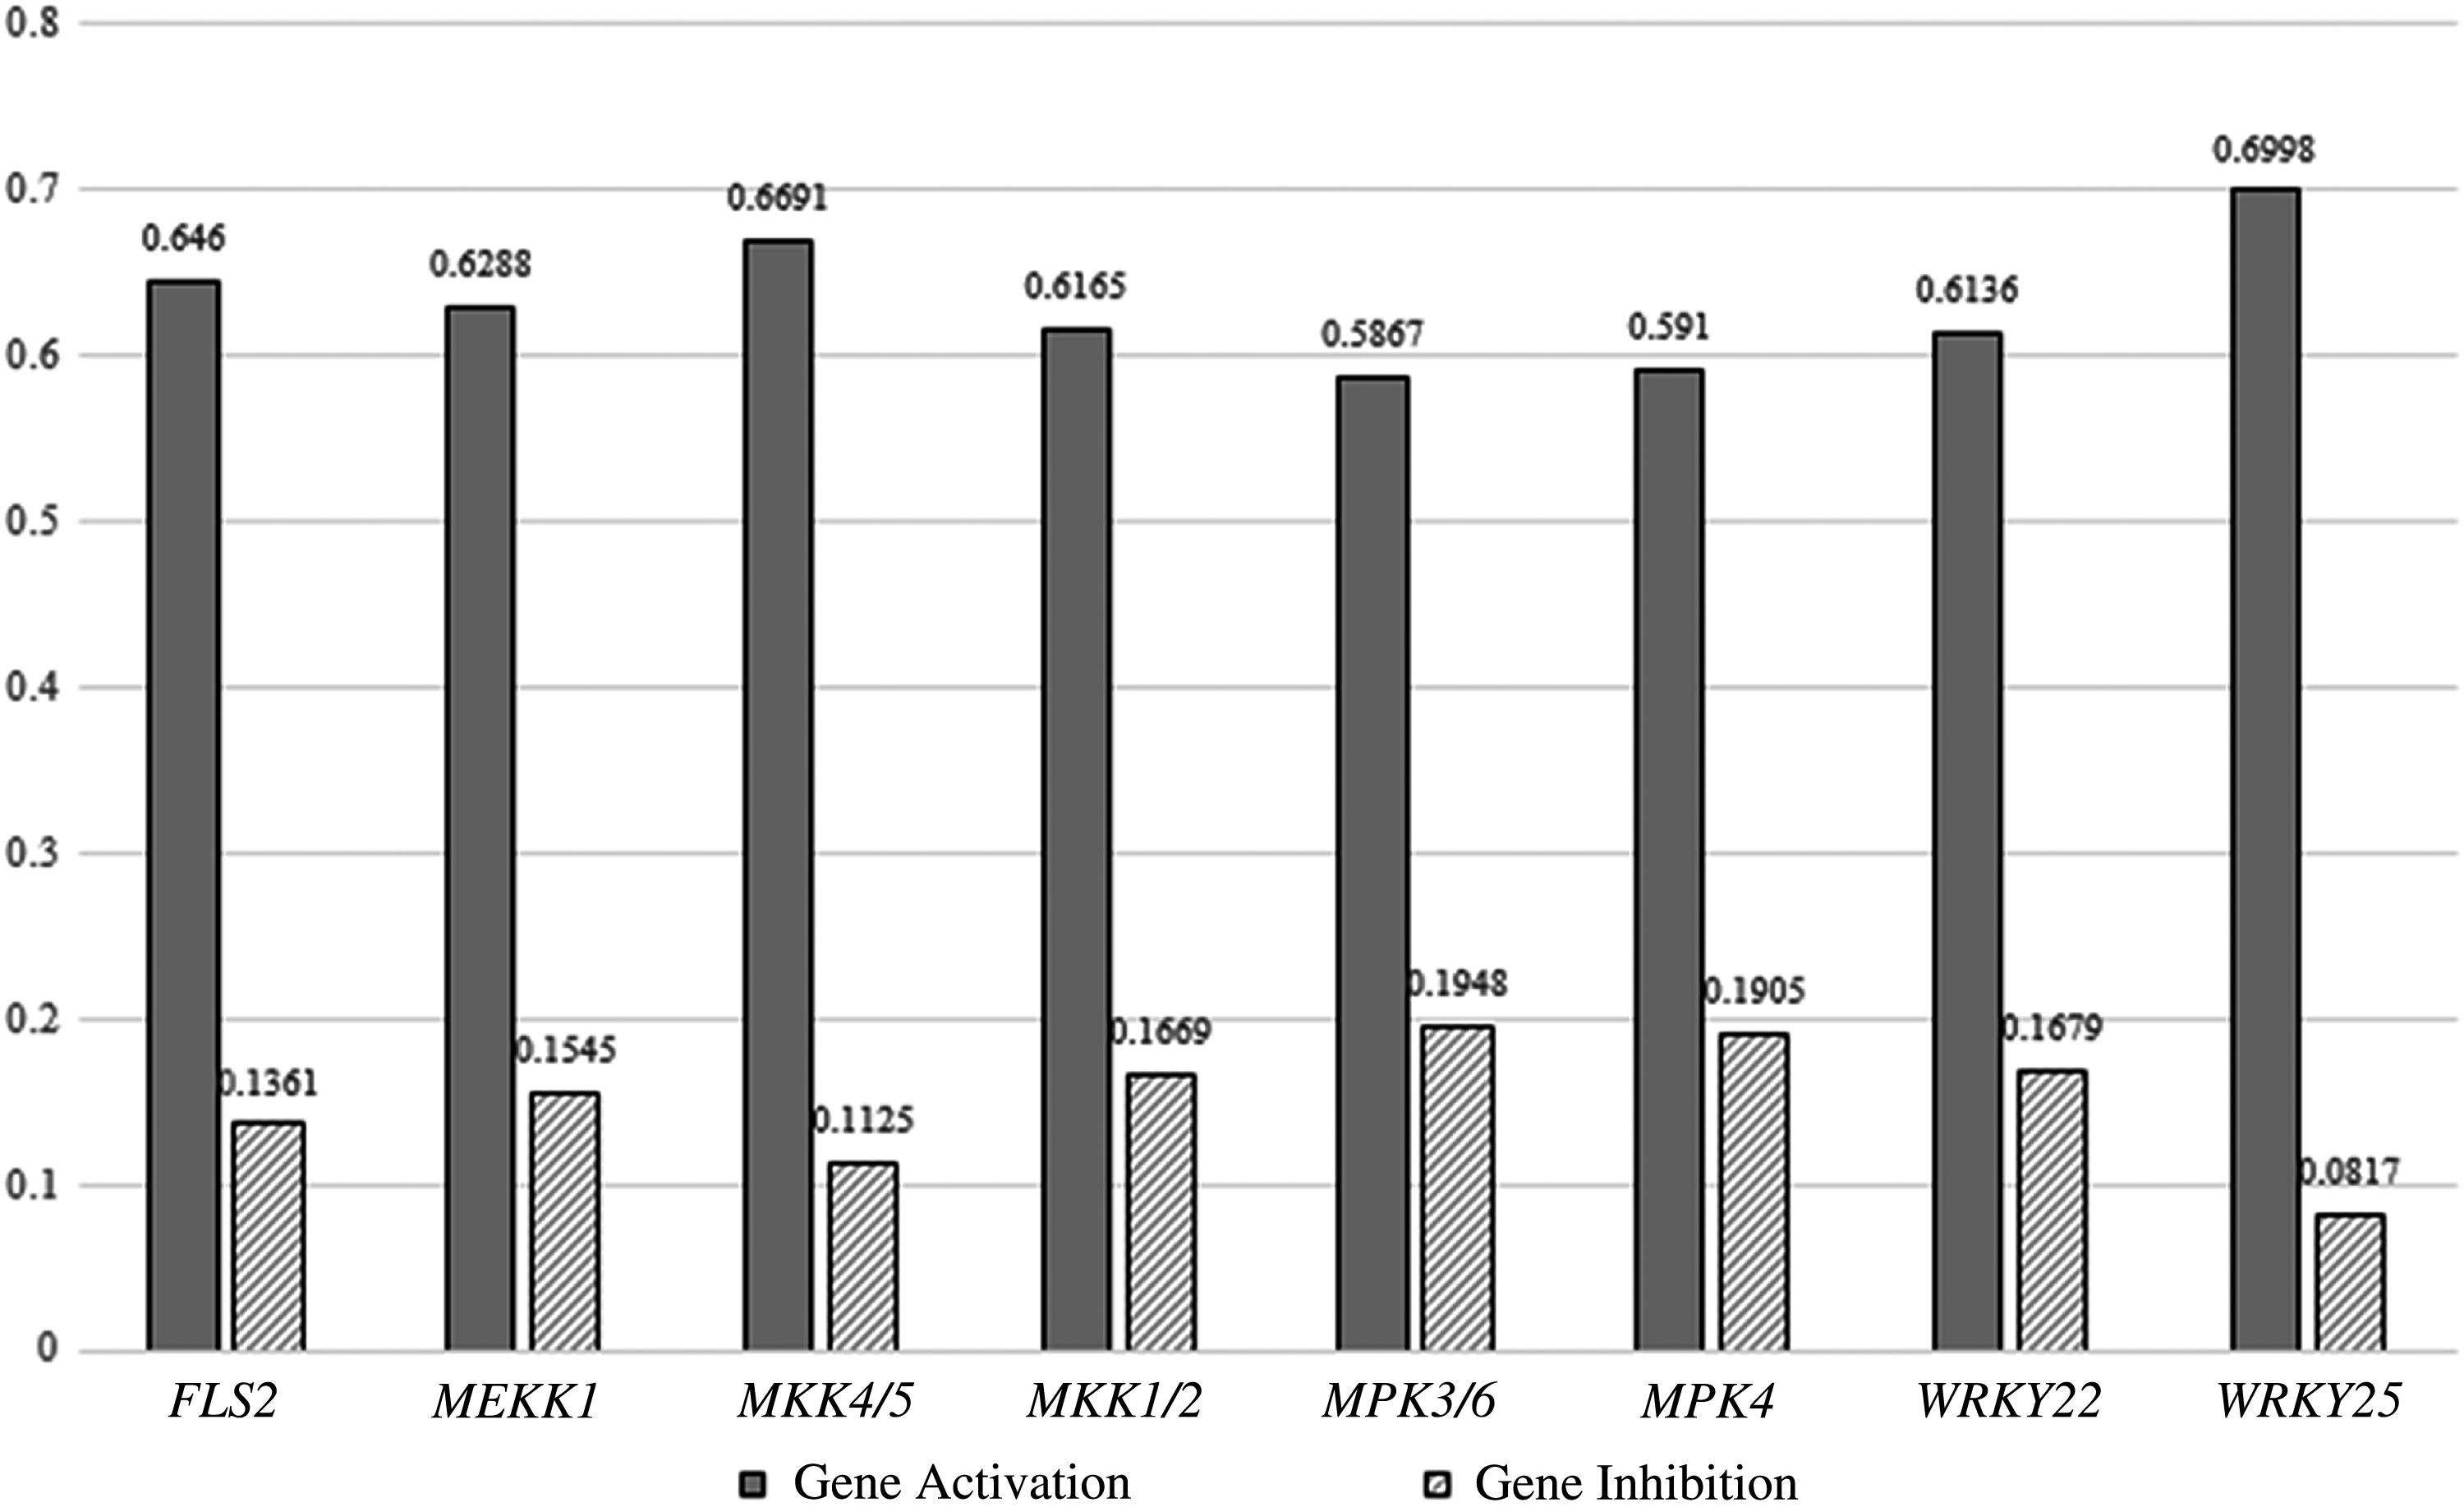
Bar graph illustrating the utility obtained by intervening with different nodes in the network to achieve the desired state of node representing the gene PR1.
5.4. Results and discussion
The inference from the application of the gene selection algorithm is that WRKY25 is the most preferred node for intervention. WRKY25 belongs to the WRKY I group of proteins, which play significant roles in plant development and responses to biotic and abiotic stresses in various plant species. It is well established that these proteins are involved in the regulation of various physiological programs that are unique to plants, including pathogen defense, senescence, and response to environmental stresses. WRKY25 is an important regulator of biotic stress and is induced by salicylic acid. Recent studies have shown that in A. thaliana WRKY25 and WRKY39 are positive regulators in thermotolerance (Wang et al., 2011). Analysis of stress-induced WRKY25 in the defense signaling mutants npr1, sid2, ein2, and coi1 has further indicated that this gene is positively regulated by the salicylic acid signaling pathway and negatively regulated by the jasmonic acid signaling pathway, both of which are important plant signaling pathways related to defense. Hence, WRKY25 is a potent point of intervention in the plant pathogen response system. The second most significant point of intervention according to our algorithm is MKK4. Indeed, this important member of the MAPK cascade is known to play crucial roles in plant immunity, and over-expression of MKK4/5 has been seen to increase resistance to powdery mildew and to cause mildew-induced cell death in wild-type Arabidopsis (Zhao et al., 2014).
6. Conclusion and Future Work
MAPK cascade is an important point of convergence of abiotic and biotic stress stimuli in plants. In this article, we developed a BN-based approach for modeling and inference of the MAP Kinase cascade in plants, which uses the graph structure obtained from signaling pathways in the biology literature.
We demonstrated the integration of biological knowledge from the literature with real gene expression data from the NCBI repository. Subsequently, we have made an attempt to quantify the effect of a gene on another gene and used this influence as a tool to drive the network behavior toward a desired output. Although the demonstration of the working of our algorithm was carried out using gene expression data, the method can work with other types of genomic or proteomic data or a combination of multiple types of data. An important consideration in our approach is that biologists are always looking for one crucial lever gene that can be manipulated in real experiments rather than a bunch of genes that have some influence on the desired response, since it is both time consuming and expensive to test the effect of manipulation of multiple genes on the gene network.
The approach presented in this article for selection of points of intervention can be applied to any BN that represents biological signaling in an organism. The method is applicable to networks of any size provided there are no cycles in the network. From the simulation results discussed earlier, we see that the intervention of genes that have greater downstream effects are more likely to result in global network changes. A variety of factors can be considered to score the gene selection. The ease with which a gene can be maintained in a certain state given the state of its parent genes is the most important factor, which we have considered in the algorithm. Another possible factor could be the relative proximity between the target and the manipulated gene in the genetic regulatory network. The central idea here is that some “important” genes have the potential to lead the network to a certain desired state. This desired objective can be attained with lesser effort using a properly chosen gene as compared with another gene that may not have as strong an influence.
The gene selection algorithm proposed in this article is sensitive to the structure of the network. Incorrect connections in the network structure may lead to the selection of genes that are not very influential in driving other genes. Combining multiple sources of biological data may help in improving the robustness of the method.
We used a beta-binomial model for representing the interactions among nodes in the MAPK pathway. However, as mentioned earlier, it is possible to use other parametric models that make use of nonconjugate priors in the modeling. For such distributions, MCMC methods can be utilized to sample from the posterior distributions and to obtain kernel density estimates. In cases where the form of the posterior is unknown, algorithms such as the Metropolis Hastings algorithm can be employed, in addition to MCMC, to obtain estimates of the posterior distribution. This study was focused on learning one graph that corresponds to a specific condition for the genes. However, it is also possible to analyze an ensemble of graphs that correspond to different diseased conditions, and to compare such models to investigate critical nodes that can be targeted for improving disease resistance. Further study is required to analyze the development of such models. Integration of other types of genomic, proteomic, and sequencing data into the BN will also be explored in future work. The formulation of cost functions that are custom designed according to the biological intervention being considered is another direction for future studies.
Footnotes
Acknowledgments
This work was supported in part by the TEES-Agrilife Center for Bioinformatics and Genomic Systems Engineering (CBGSE) and in part by the National Science Foundation under grant ECCS-1404314.
Author Disclosure Statement
No competing financial interests exist.