
Abstract
Abstract
1. Introduction
P
microRNAs (miRNAs) are endogenous noncoding RNAs of 22 nucleotides that regulate the expression of proteins by binding to complementary sequences in the 3′untranslate region of the mRNA of target genes. It is well documented that miRNAs regulate a variety of biological processes (BPs), including cell proliferation, apoptosis, differentiation, and aging (Avgeris et al., 2013; Zhu and Xuan, 2014).
Long noncoding RNAs (lncRNAs) are untranslated transcripts >200 nucleotides in length that bear many of the structural characteristics of mRNAs, including a poly(A) tail, 5′-capping, and a promoter structure, but no conserved open reading frames (Gutschner et al., 2012; Geng et al., 2013). Many lncRNAs are expressed at specific times and in specific tissues during development, and exhibit a variety of slicing patterns. It has been proposed that lncRNAs are involved in the epigenetic regulation of coding genes, thus exerting a powerful effect on a number of physiological and pathological processes, including the pathogenesis of many human cancers (Ellis et al., 2013; Geisler and Coller, 2013). It has also been suggested that ncRNAs could form a well-orchestrated regulatory interaction network, specifically, miRNAs and lncRNAs interact with each other, imposing an additional level of post-transcriptional regulation (Juan et al., 2013).
In this study, mRNA expression data and miRNA expression data of liver cancer were downloaded from The Cancer Genome Atlas (TCGA) to construct the transcript factor (TF)-lncRNA-miRNA-mRNA regulatory network. Five miRNA target gene prediction databases, including TargetScan6, microcosm, miRanda7, miRDB8, and picTar9 were integrated as the support data set of miRNA and mRNA pairs. lncRNA-miRNA information in the lncRNASNP10 database was also used as the support data set of lncRNA and mRNA pairs. The TF, lncRNA, miRNA, and mRNA regulatory networks in PCa were analyzed with bioinformatics software to provide a theoretical basis for the molecular mechanism of PCa pathogenesis.
2. Materials and Methods
2.2. Gene expression profiles
We downloaded gene expression data batch8_9 from TCGA project webpage (https://tcga-data.nci.nih.gov/tcga/), including 425 PCa samples and 52 matched normal samples for miRNA analysis, as well as 374 PCa samples and 52 matched normal samples for mRNA analysis. Data levels are assigned for data type, platform, and center in TCGA. The data we downloaded consisted of levels 1–4, and we chose level 3 (for segmented or interpreted data) for further study. The median method was used for the standardization of the original data.
2.3. Screening differentially expressed mRNA and miRNA
DEGs were analyzed using the DESeq (Huber, 2010) package in R language and t-test. Differentially expressed mRNAs between the two groups of samples were analyzed with DESeq by negative binomial distribution. The edgeR (Robinson et al., 2010) package in R language and t-test were used to analyze differentially expressed miRNAs. The p.adjust (p.adj) was set as 0.05 and the log2 Fold Change absolute value was set as 1. Based on the analysis of differentially expressed miRNAs and mRNAs, a correlation analysis was conducted on each significantly differentially expressed miRNA and mRNA.
2.4. Function analysis of DEGs
Gene ontology (GO) (Huang da et al., 2009a) enrichment analysis of DEGs was conducted using the Database for Annotation, Visualization, and Integrated Discovery (DAVID) (Huang da et al., 2009). A p value <0.05 was set as the screening condition.
2.5. Integrated analysis of miRNA target gene prediction database
Integrated analysis of five miRNA target gene predication databases, including TargetScan, microcosm, miRanda, miRDB, and PicTar (Grimson et al., 2007; Betel et al., 2008; Wang, 2008), was conducted to identify the number of miRNA-regulated target gene pairs. The threshold of correlation coefficient was set as −0.3 and significance p.adj was set as 0.05. The pairs supported by two or more databases were further processed and retained, and the pairs, respectively, supported by 2, 3, 4, and 5 databases were analyzed statistically.
2.6. Relationship analysis and regulatory network visualization of lncRNA and miRNA and TF and lncRNA
The regulatory relationship between lncRNA and miRNA was exploited using lncRNASNP (Krek et al., 2005; Volders et al., 2013). Regulatory network visualization for the regulatory relationship between miRNA-mRNA and lncRNA-miRNA was conducted using Cytoscape (Shannon et al., 2003). The transcription factors that had a regulatory relationship with lncRNA were exploited using ChIPBase (http://deepbase.sysu.edu.cn/chipbase/).
3. Results
3.1. Screening differentially expressed mRNA
We used DEG to compare gene expression levels between 52 human noncancerous samples and 425 PCa samples. The original data were preprocessed and the expression data of 17,951 genes were obtained. DESeq identified 2101 differentially expressed mRNAs. A total of 687 upregulated genes and 1515 downregulated genes were identified as significantly differentially expressed. T-test identified 1410 differentially expressed mRNAs. Both DESeq and t-test identified 1252 (Fig. 1A) differentially expressed mRNAs, including 561 upregulated genes and 691 downregulated genes. edgeR identified 70 differentially expressed miRNAs, and t-test identified 79. Both methods identified 57 differentially expressed miRNAs, 42 of which were upregulated and 15 of which were downregulated (Fig. 1B).

Distribution of differentially expressed genes.
3.2. DEG functions and pathways
The GO enrichment bar chart may directly reflect the distribution of DEGs for each enriched GO term of BP, cellular component, and molecular function (MF) (Huang da et al., 2009). GO enrichment analysis of DEGs was conducted using DAVID, and 10 significantly enriched BP terms, 10 significantly enriched cellular component terms, and 10 significantly enriched MF terms were selected to draw the bar chart (Fig. 2). Kyoto encyclopedia of genes and genomes (KEGG) enrichment analysis (Kanehisa et al., 2008.) on DEGs was conducted using DAVID. A p value <0.05 was set as the screening condition. Partial results of KEGG pathway enrichment analysis are shown in Figure 2 and the acceptable pathway pie chart is shown in Figure 3. The results show that DEGs are mainly involved in the calcium signaling pathway, systemic lupus erythematosus, progesterone-mediated oocyte maturation and oocyte meiosis, etc.
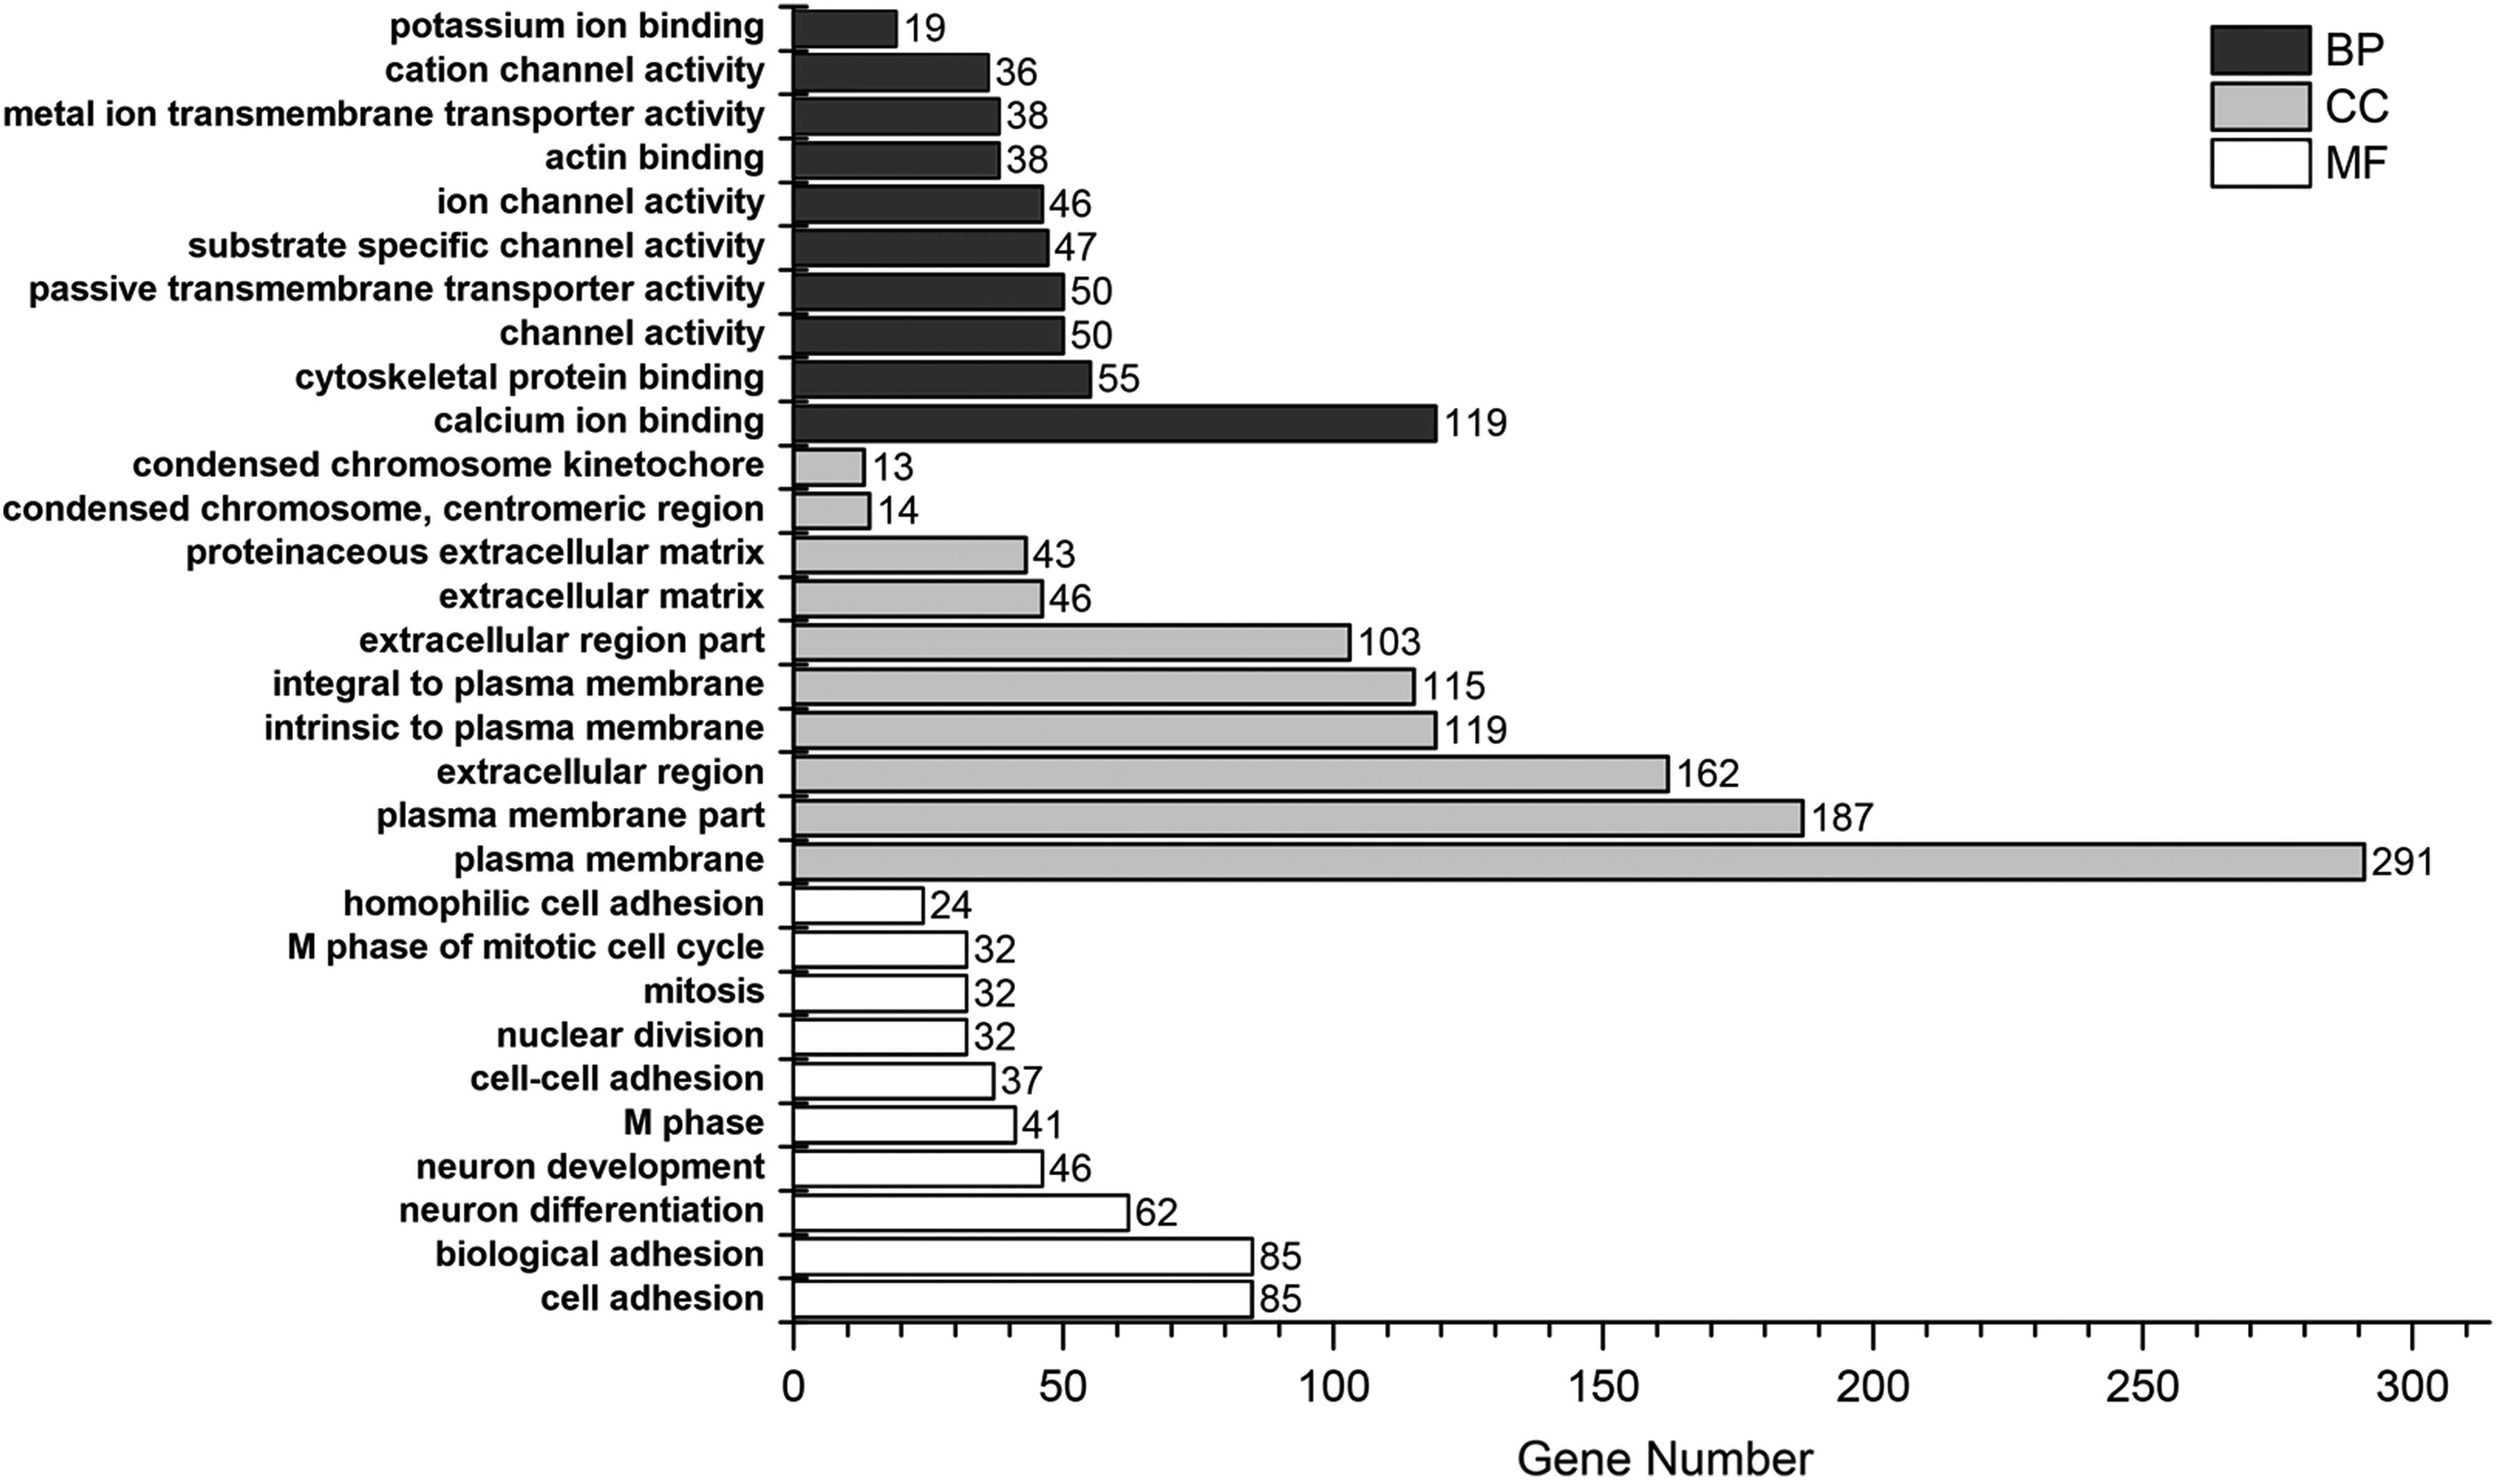
Distribution of differentially expressed genes in a significantly enriched gene ontology term.
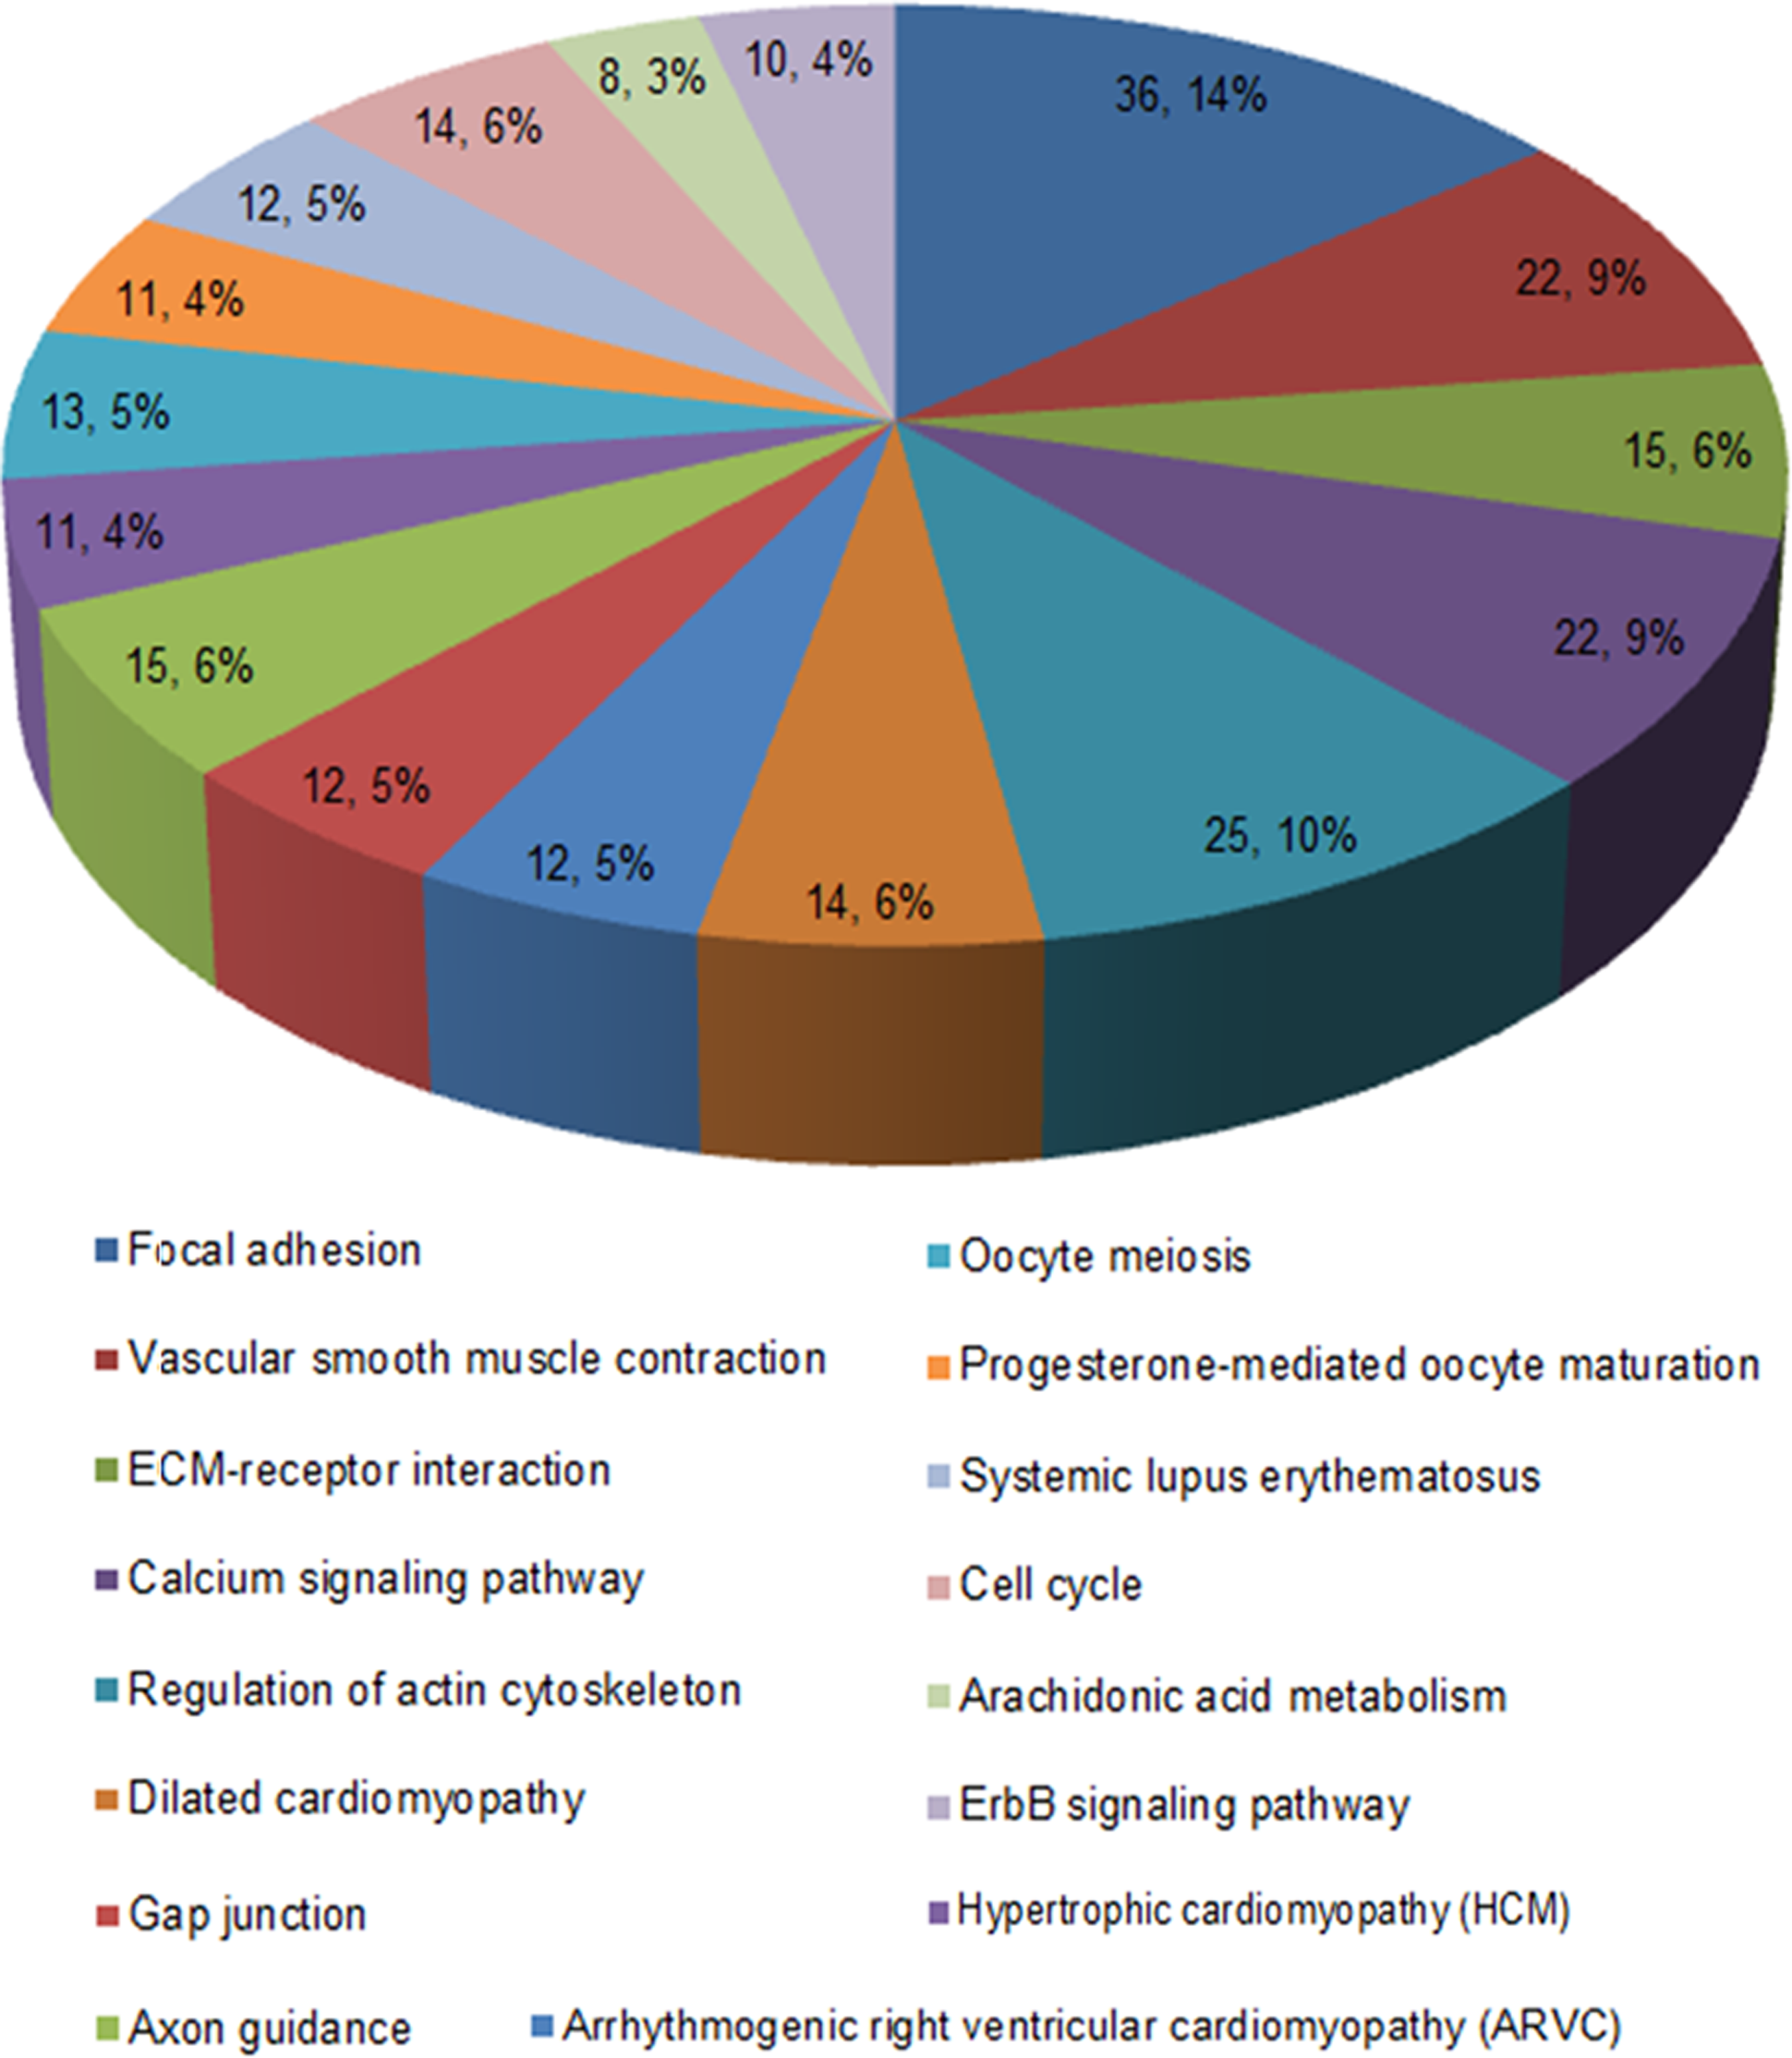
Differentially expressed genes in a significantly enriched kyoto encyclopedia of genes and genomes pathway.
3.3. Correlation analysis of miRNA and mRNA
Correlation analysis was conducted on each significantly differentially expressed miRNA and mRNA based on the analysis of differentially expressed miRNAs and mRNAs. Because miRNAs contribute to cell proliferation, differentiation, apoptosis, and other processes by inhibiting the translation of mRNA or degrading mRNA (Avgeris et al., 2013), negatively correlated miRNA and mRNA pairs were selected. In total, 9102 miRNA and mRNA pairs were identified for analysis of frequency distribution for the correlation of miRNA and mRNA (Fig. 4).
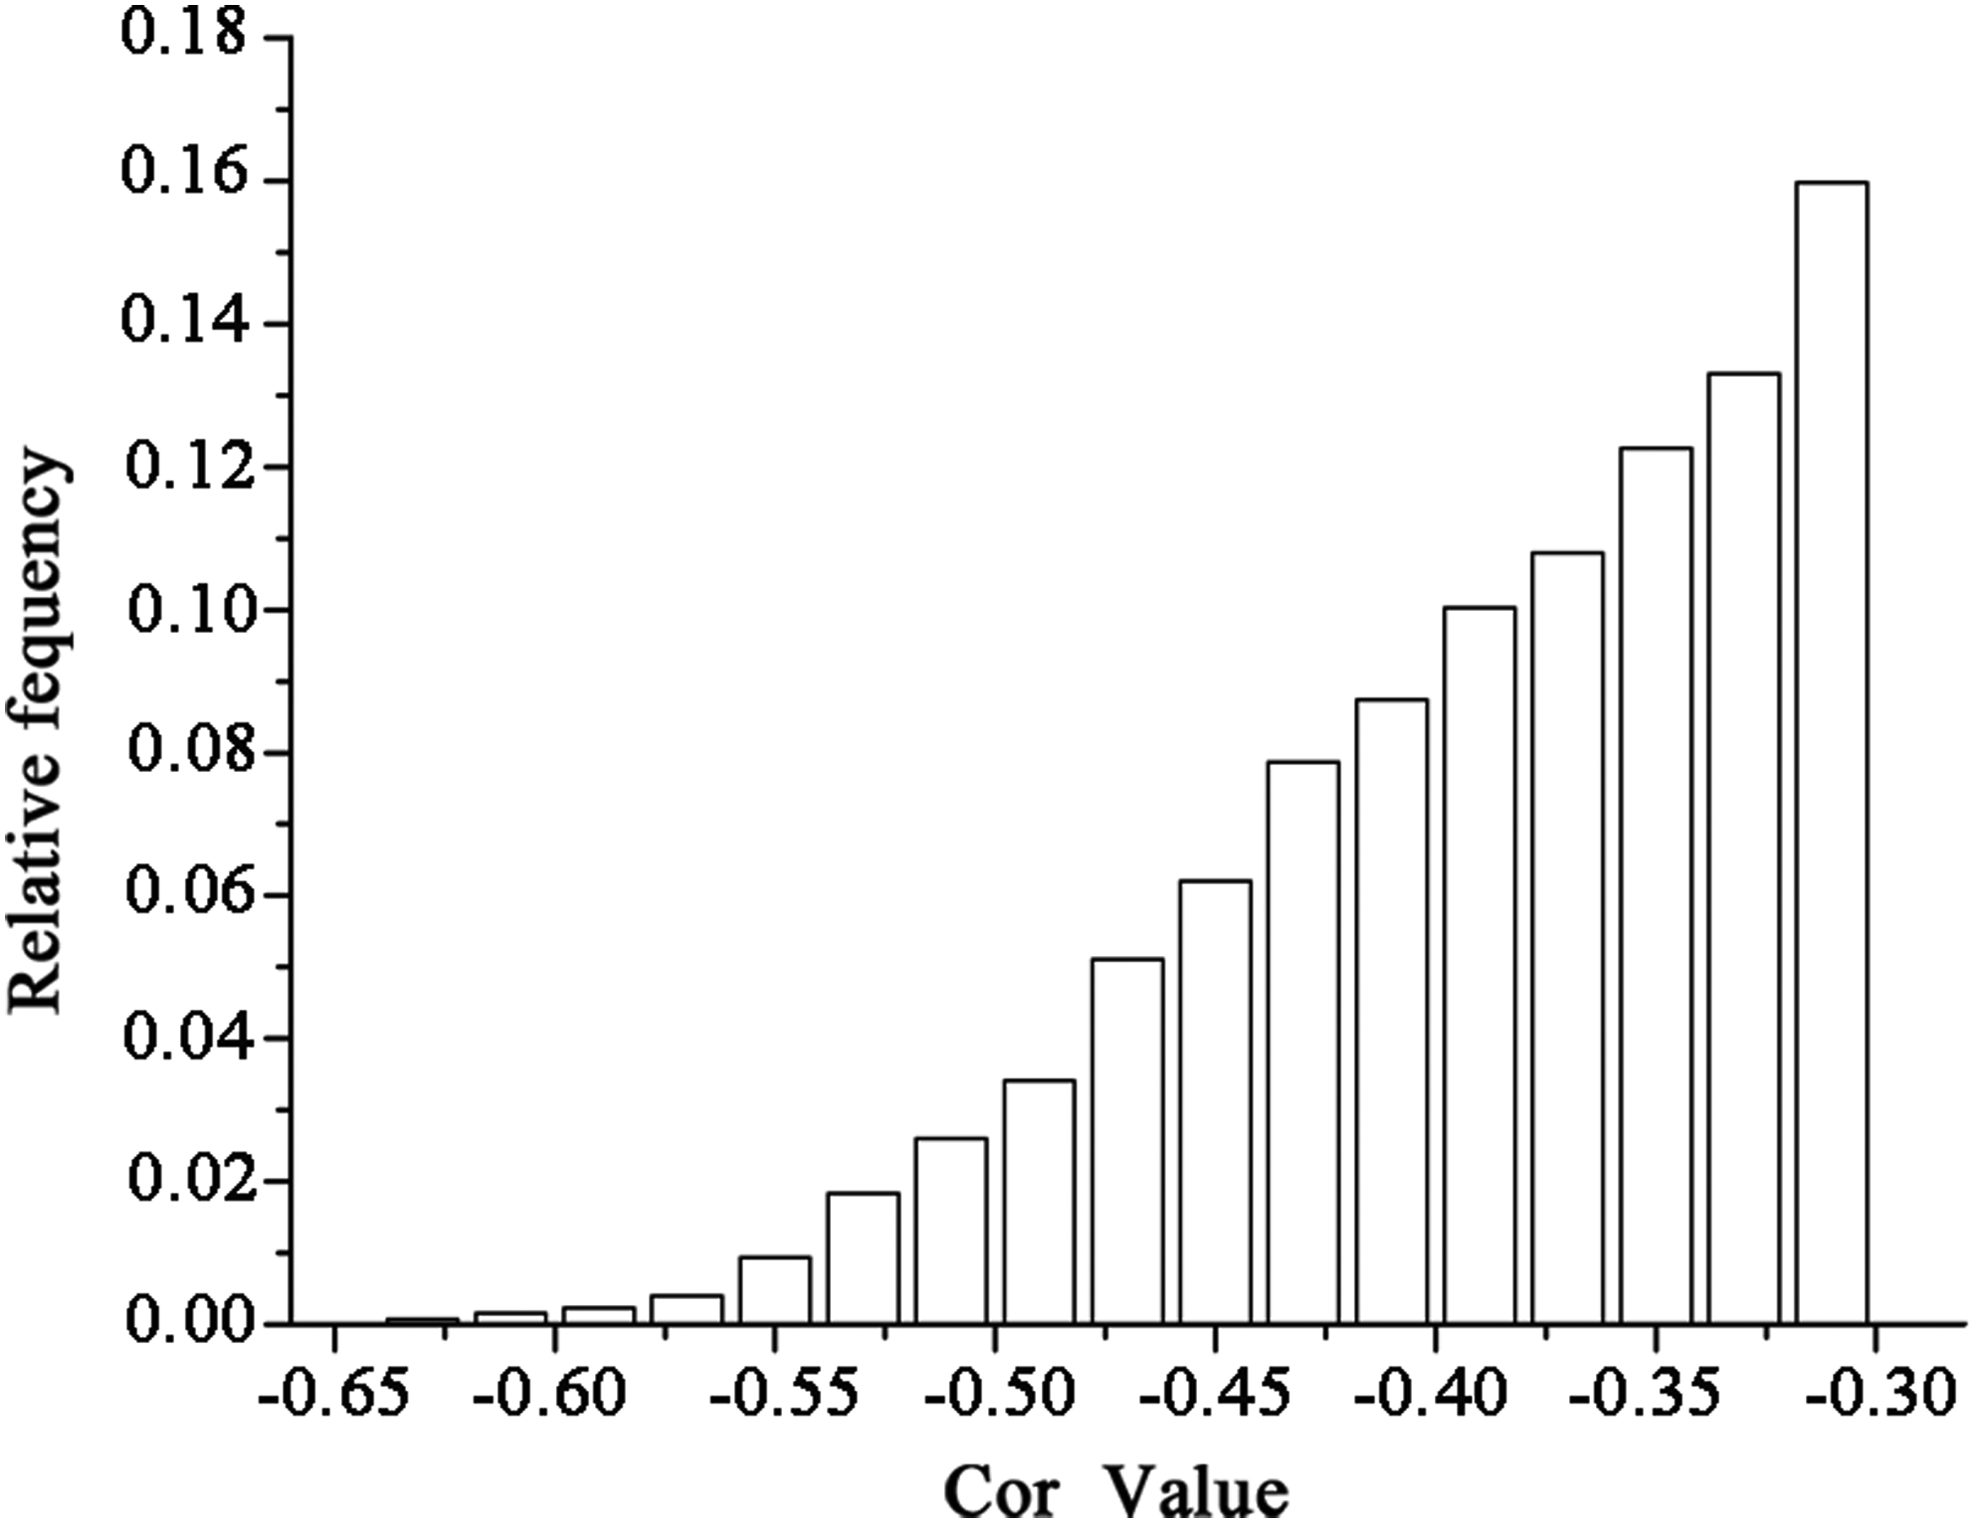
Frequency distribution diagram of miRNA and mRNA correlation coefficient.
3.4. Analysis of miRNA target gene database
Integrated analysis of five miRNA target gene predication databases (TargetScan, microcosm, miRanda, miRDB, and PicTar) was conducted and 7,099,255 miRNA-regulated target gene pairs were identified. The pairs supported by two or more databases were further processed and retained, and totaled 701,418. The pairs, respectively, supported by 2, 3, 4, and 5 databases were analyzed statistically; the results are shown in Figure 5. Integrated analysis was conducted for the pairs that met the conditions of correlation analysis and the pairs supported by at least two databases. A total of 1214 pairs were identified in the intersection of the two databases, including 52 miRNAs and 395 mRNAs. Partial results were shown in Table 1.
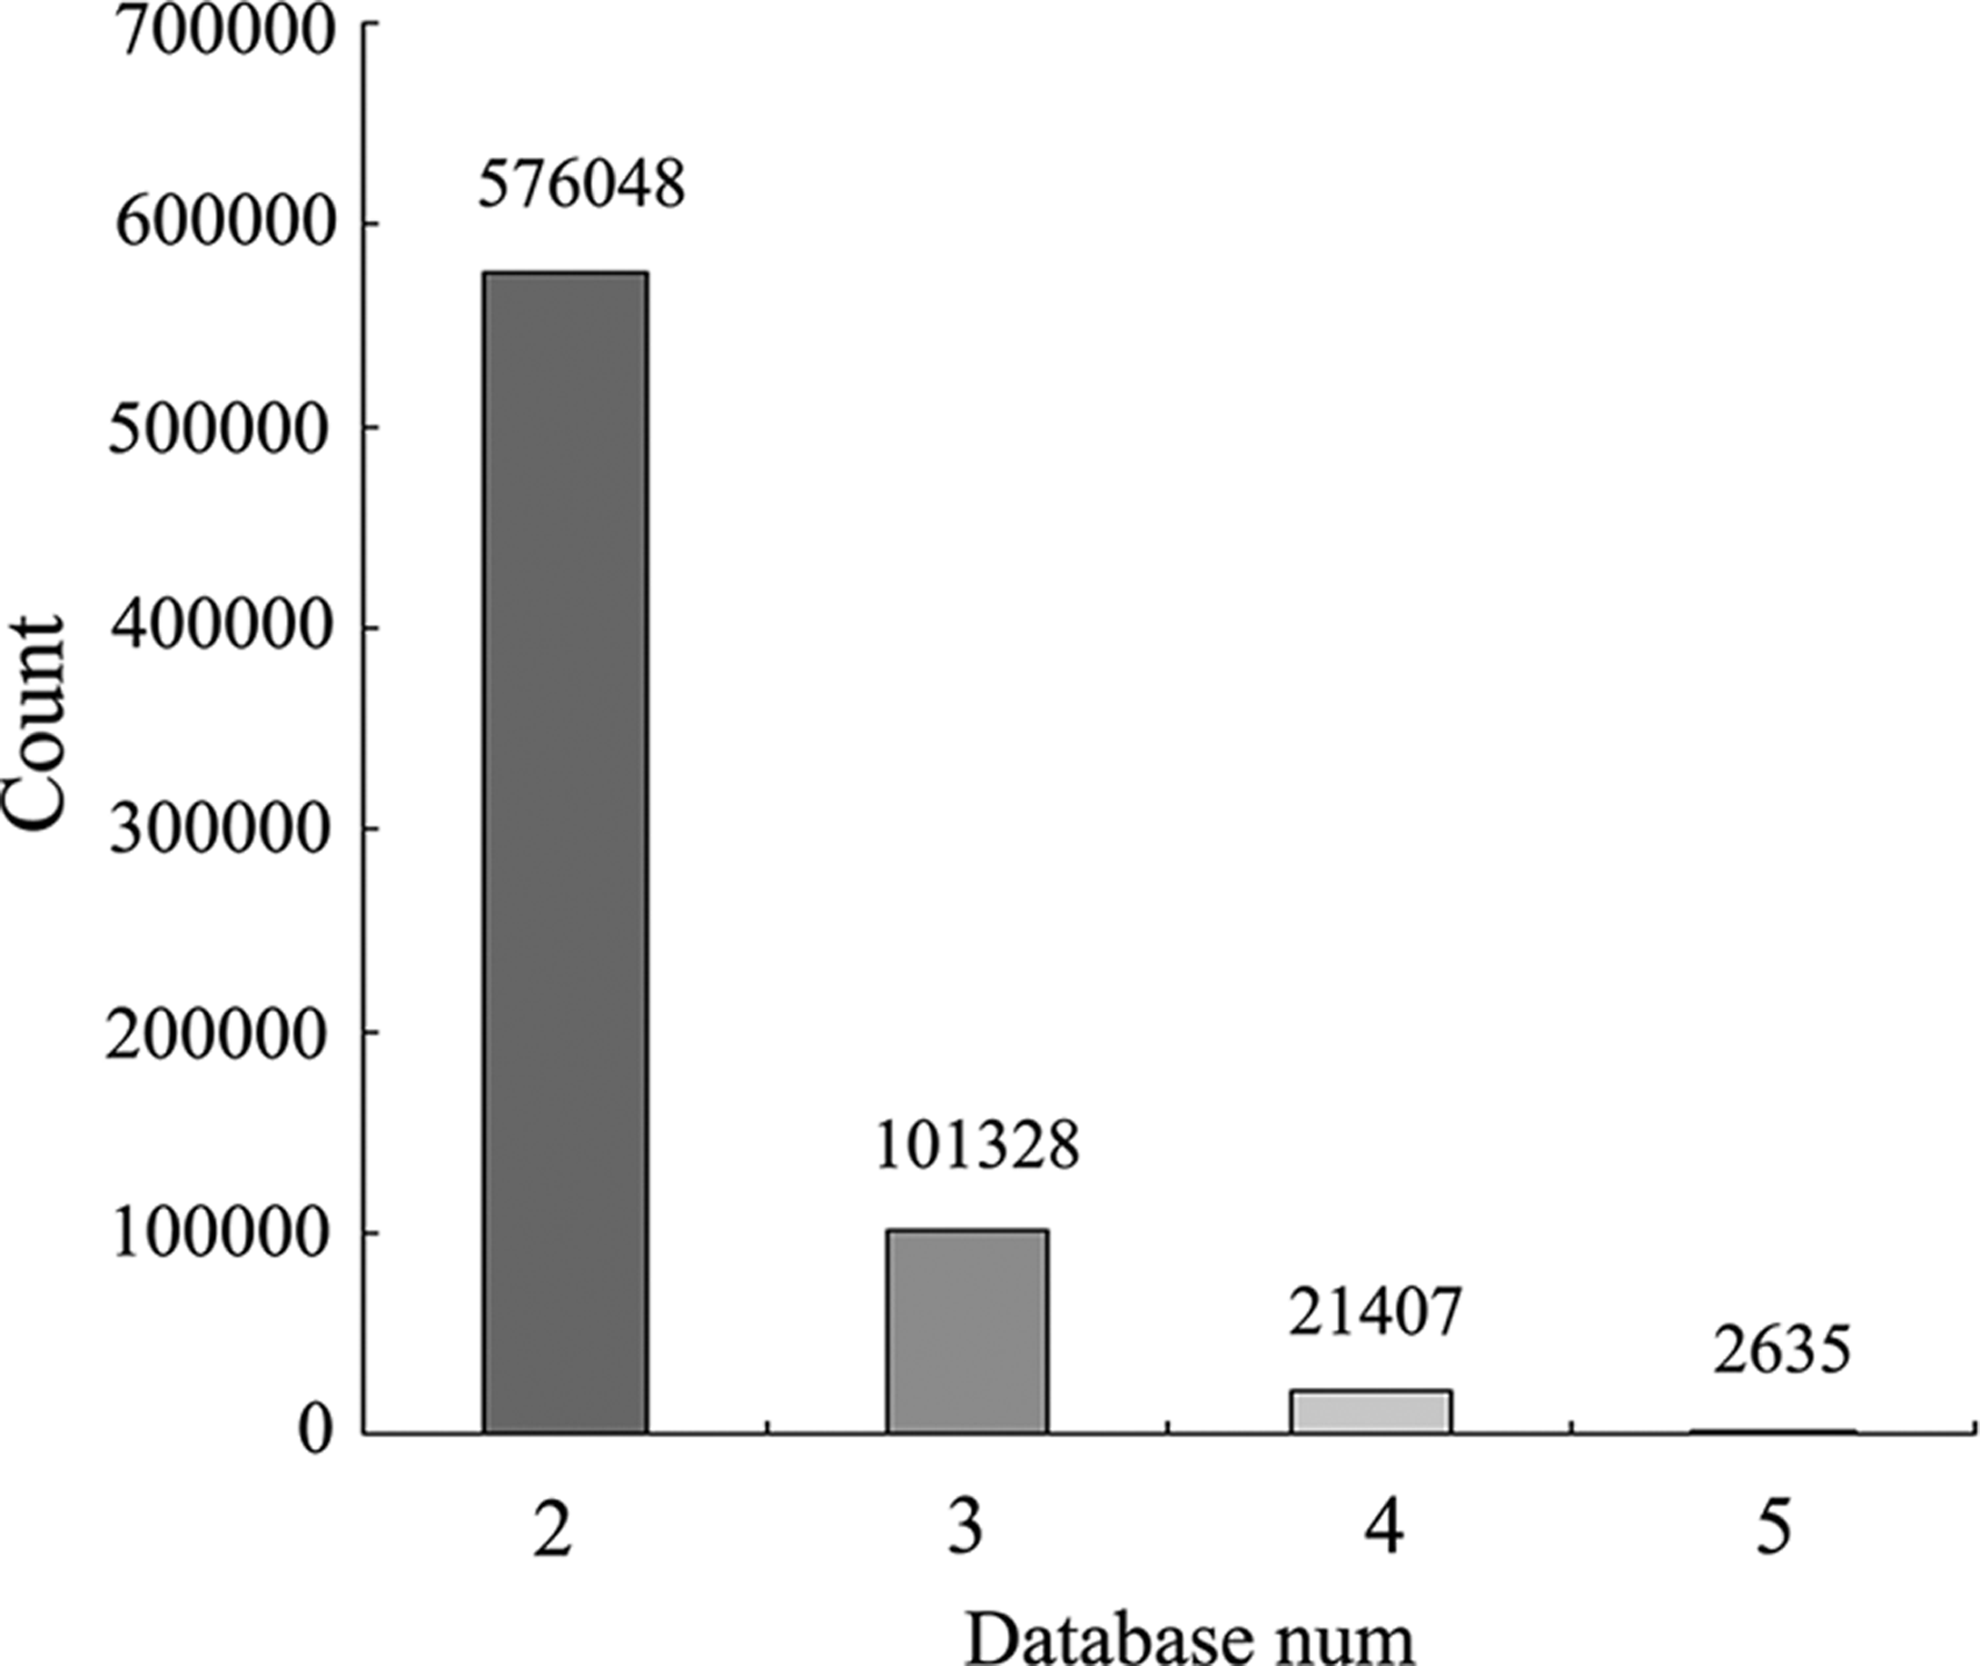
Integrated analysis of correlation and target gene prediction relation.
3.5. miRNA and mRNA regulatory network visualization
The core of Cytoscape is the network and each node is the gene, miRNA, or other analysis. The edge between nodes represents the interaction between these biomolecules (Shannon et al., 2003). To display the regulator network more clearly, Cytoscape was used to perform regulator network visualization for the first 200 pairs among the screened 1214 pairs, including 36 miRNAs and 88 mRNAs. The results are shown in Figure 6.

miRNA-mRNA regulator network.
3.6. Relationship analysis of TF, lncRNA, miRNA, and mRNA
The lncRNASNP database is an SNP database that records human lncRNAs and contains SNP information on lncRNAs, structural changes caused by SNP, and binding sites of lncRNA and miRNA. The database contains 72,000 lncRNA and miRNA pairs in total, including 5118 pairs that are validated by experiment. The naming method used in the LNCipedia database, which provides comprehensive annotation of the sequence and structure of human lncRNAs, was also used to name lncRNAs in the lncRNASNP database. LNCipedia 3.0 contains 113,513 human annotated lncRNAs (Volders et al., 2013, 2015). The regulatory relationship was screened out according to the corresponding relationships between lncRNAs and miRNAs and between miRNAs and mRNAs; a total of 19,705 regulatory relationships were identified. Cytoscape was used to perform regulator network visualization for the regulatory relationships of lncRNA-miRNA-mRNA, including 52 miRNAs, 395 mRNAs, and 197 lncRNAs (Fig. 7A). ChIPBase was further used and 32 TF genes were screened out of 395 mRNAs. Cytoscape was used to perform regulator network visualization for the regulatory relationship of TF-lncRNA-miRNA-mRNA (Fig. 7B).
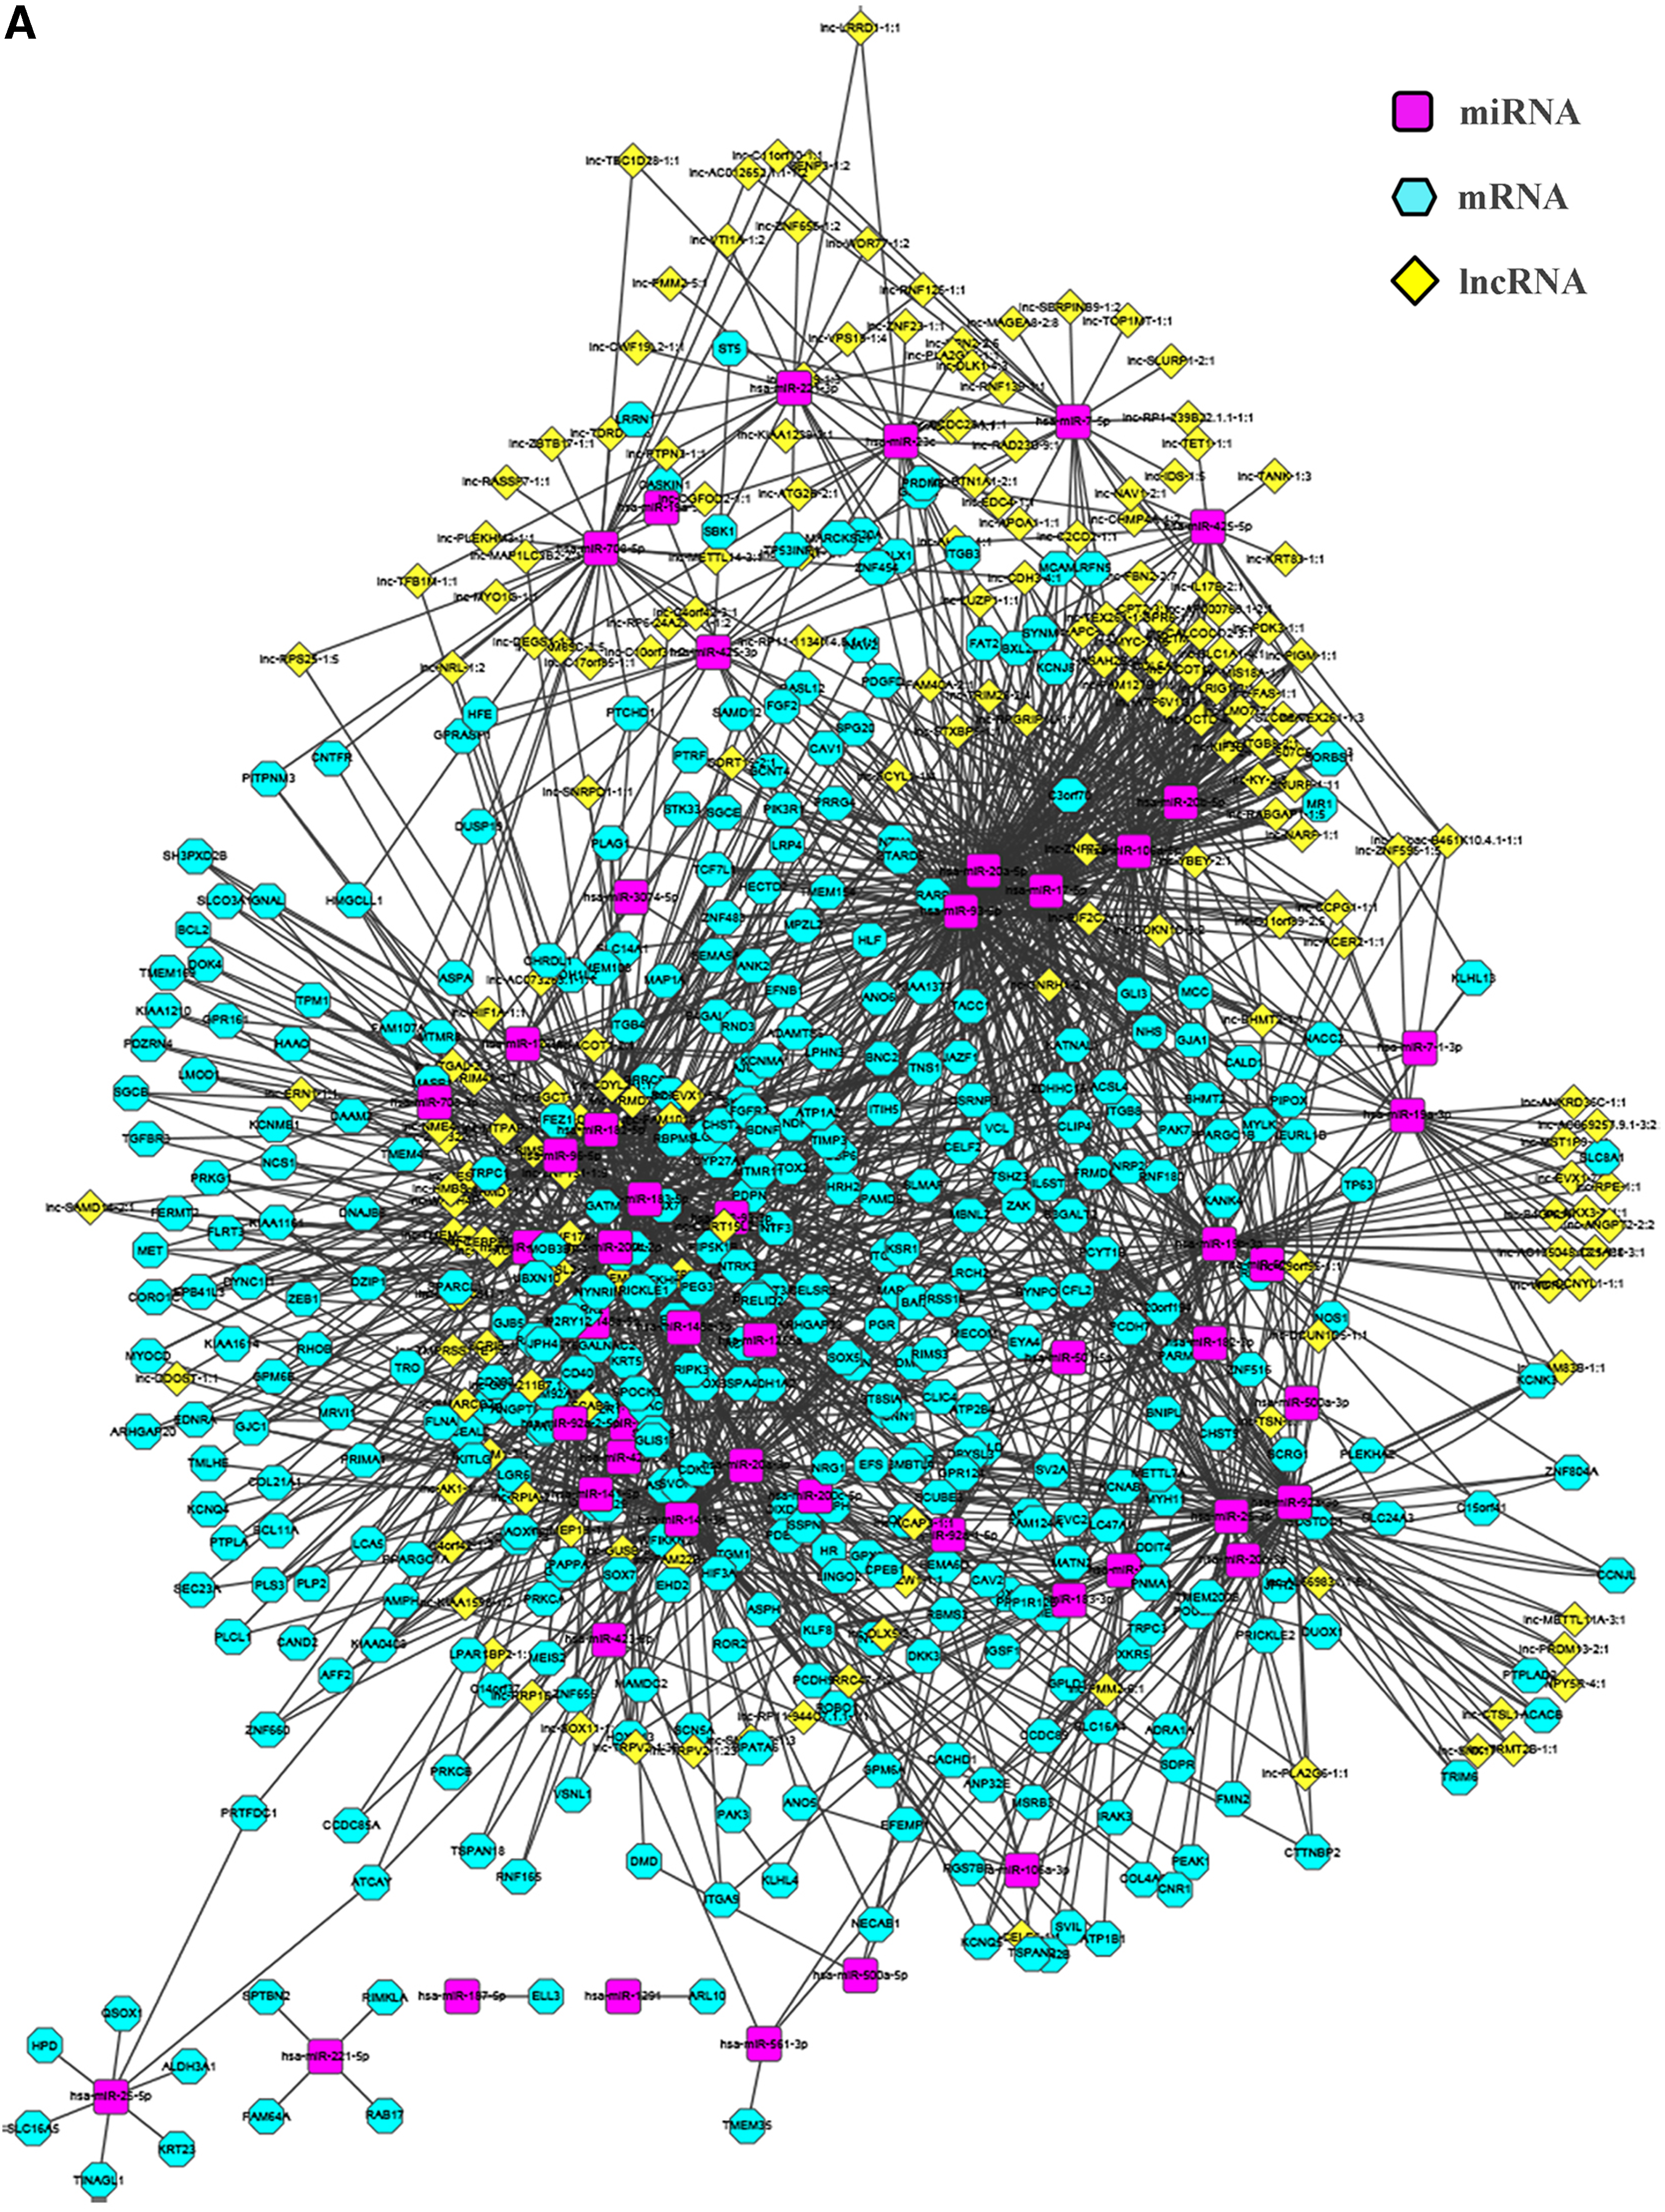
TF-lncRNA-miRNA-mRNA regulator network in prostate cancer.
4. Discussion
TCGA project was initiated by the National Cancer Institute and the National Human Genome Research Institute in 2006. It includes rich clinical data and large-scale data of mRNA/microRNA expression profiles, copy number variations, DNA methylation, and mutation. Full exploitation of TCGA database may lay foundation for our studies and clinical progress (Braun et al., 2013).
To explore the molecular mechanism of PCa pathogenesis, we downloaded the gene expression profiles of PCa in the TCGA database. In the selected 2101 DEGs, 719 were upregulated genes such as EPHA10 and HPN. PCA3, LRRC56, LRFN1, CAMKK2, and 691 were downregulated genes such as LURAP1, FGFR2, PAK7, ROR2, TMEM246, CD40, and so on. The upregulated genes were separately extracted to undertake KEGG pathway enrichment analysis using DAVID. HIST4H4, HIST1H2BC, C4A, HIST1H2BF, HIST1H2BG, etc., are involved in systemic lupus erythematosus. TTK, PKMYT1, ESPL1, CDC20, PTTG1, BUB1B, and CCNA2 are involved in oocyte meiosis. SPDYA, CCNB2, MAPK12, PLK1, BUB1, PKMYT1, CDC25C, and CCNA2 are involved in progesterone-mediated oocyte maturation. These findings allow us to infer that it is the changes of the related functions and pathways that caused the tumorigenesis of PCa.
MicroRNAs post-transcriptionally regulate the expression of their target genes through their complementarity with the mRNA sequence (Kim and Kim, 2007). miRNAs present tissue-specific expression, have many target genes, may regulate many protein-coding genes, and could be involved in many molecular pathways associated with tumor evolution and progression, which are associated with many cancers (Ling et al., 2013). Our studies identify 57 differentially expressed miRNAs by exploiting TCGA, such as hsa-mir-182, hsa-mir-92a-1, hsa-mir-204, hsa-mir-1224, hsa-mir-1251, hsa-mir-200c, hsa-mir-23c, hsa-mir-96, hsa-mir-323b, hsa-mir-423, and so on. miRNAs post-transcriptionally regulate the expression of their target genes through their incomplete complementarity with 3′ noncoding region of target mRNAs (Zhu and Xuan, 2014). Based on the analysis of differentially expressed miRNAs and mRNAs, negative correlation analysis was conducted on each significantly differentially expressed miRNA and mRNA. Through the integrated analysis of target gene prediction databases, our studies identified 1214 pairs (mRNA-miRNA), including 52 miRNAs and 395 mRNAs (Fig. 5 and Table 1), such as hsa-miR-182-5p:BDNF, hsa-miR-96-5p:ZEB1, hsa-miR-500a-5p:DMD, hsa-miR-106a-5p:CALD1, and hsa-mir-93:ANK2.
It was reported that miR-182 and miR-203 induce mesenchymal to epithelial transition features and growth-factor-independent growth through repression of SNAI2 in prostate cells (Qu et al., 2013). Hirata Hgroup showed that miR-182-5p might be an important therapeutic target and biomarker for clinical PCa progression. Several important tumor suppressor genes including FOX F2, RECK, and MTSS1 are unregulated after inhibition of mi-R-182-5p. The close correlation between miR-182-5p and PCa progression indicates clinical staging applications (Hirata et al., 2013). Our results suggest that as the important regulatory factors, the expression dysregulation of microRNAs (microRNA, miR) may affect the expression of functional genes and realize post-transcriptional regulation of PCa cell proliferation, apoptosis, differentiation, and metastasis.
lncRNAs regulate gene expression through a variety of mechanisms, including transcription, post-transcriptional processing, chromatin modification, genomic imprinting, and regulation of protein functions (Prensner and Chinnaiyan, 2011). Recent studies have suggested that lncRNAs may exert functions by targeting miRNAs. In our study, the regulatory relationship was screened out according to the corresponding relationship between lncRNA and miRNA and between miRNA and mRNA. The regulatory network visualization was performed for the screened corresponding relations. The regulatory networks included 52 miRNAs, 395 mRNAs, and 197 lncRNAs, such as lnc-AC073263:hsa-miR-182-5p:BDNF (Fig. 7a). Many studies have suggested that lncRNA and miRNA may competitively absorb the expression of mRNAs, which may cause tumor evolution and progression. For example, Bmi1 is an important target gene for miR-182-5p, and is highly expressed in gallbladder cancer (GBC). CCAT1 is highly expressed in GBC and works by competitively binding miR-182-5p releasing Bmi1 to act in the cell (Ma et al., 2015). It was previously demonstrated that linc-MD1 “sponges” miR-133, which regulates muscle differentiation (Cesana et al., 2011). A recently identified lncRNA, CHRF, was shown to regulate cardiac hypertrophy by targeting miRNA-489 (Wang et al., 2014). The interplay between lncRNAs and microRNAs and the importance of such interactions during the tumorigenic process provide new insight into the regulatory mechanisms underlying several ncRNA classes of importance in cancer.
Recent studies have increasingly suggested that lncRNA transcription can be regulated by both key TFs and epigenetic modifications. For example, p53 could promote lncRNA-p21 transcription and E2F1 regulates lncRNA ERIC expression (Huarte et al., 2010), whereas the core catalytic subunit of polycomb repressive complex 2 EZH2 could repress lncRNA SPRY4-IT1 transcription through epigenetic maintenance of H3K27me3 (Sun et al., 2014). In our study, Cytoscape was used to perform regulator network visualization for the regulatory relationship of lncRNA-miRNA-mRNA, including 52 miRNAs, 395 mRNAs, and 197 lncRNAs. Further analysis showed that there were 32 TF genes in 395 mRNAs and transcription factors might be bound onto lncRNA upstream promoter regions. Taken together, these findings allowed us to construct the regulatory network of TF-lncRNA-miRNA-mRNA in PCa (Fig. 7).
5. Conclusion
This study established a new PCa network to facilitate data mining. In addition, we conducted functional module analysis within the network. However, further analyses are still required to explore their mechanisms in the process of tumorigenesis and the development in PCa. In conclusion, our data provide a comprehensive bioinformatics analysis of genes and pathways that may be involved in the pathogenesis of PCa.
6. Availability of Data and Materials
We downloaded gene expression data batch8_9 from TCGA project webpage https://tcga-data.nci.nih.gov/tcga/; the transcription factors that had a regulatory relationship with lncRNA were exploited using ChIPBase (http://deepbase.sysu.edu.cn/chipbase/).
Footnotes
Acknowledgments
This work was supported by grants from the Technical New Star of Zhujiang, Pan Yu districts, Guangzhou (No. 2014-special-15-3.09 and No. 2013-special-15-6.09), the Natural Science Foundation of China (No. 81502557), the Administration of Traditional Chinese Medicine of Guangdong Province (No. 20151057), the Science and Technology Planning Project of Guangdong Province (No. 2015110), technology projects of Guangzhou medicine and healthcare (No. 2016A011112), and the Administration of Traditional Chinese Medicine of Guangdong Province (20162110). We would like to thank the anonymous reviewers for all the critical challenges and excellent suggestions.
Authors' Contributions
J.H.H. drafted the article. TCGA data loading was designed and developed by Z.P.H. M.-X.Z. analyzed R program language. M.R.C. made the figure. Y.B.L. and J.B.Z. revised the article. Y.G.L. supervised and coordinated the work. All authors read and approved the final article.
Author Disclosure Statement
No competing financial interests exist.