
Abstract
Abstract
The development of colorectal cancer (CRC)—the third most common cancer type—has been associated with deregulations of cellular mechanisms stimulated by both genetic and epigenetic events. StatEpigen is a manually curated and annotated database, containing information on interdependencies between genetic and epigenetic signals, and specialized currently for CRC research. Although StatEpigen provides a well-developed graphical user interface for information retrieval, advanced queries involving associations between multiple concepts can benefit from more detailed graph representation of the integrated data. This can be achieved by using a graph database (NoSQL) approach. Data were extracted from StatEpigen and imported to our newly developed EpiGeNet, a graph database for storage and querying of conditional relationships between molecular (genetic and epigenetic) events observed at different stages of colorectal oncogenesis. We illustrate the enhanced capability of EpiGeNet for exploration of different queries related to colorectal tumor progression; specifically, we demonstrate the query process for (i) stage-specific molecular events, (ii) most frequently observed genetic and epigenetic interdependencies in colon adenoma, and (iii) paths connecting key genes reported in CRC and associated events. The EpiGeNet framework offers improved capability for management and visualization of data on molecular events specific to CRC initiation and progression.
1. Introduction
A
A major characteristic of cancers, which affects both investigation and interpretation, is heterogeneity of the biological information that characterizes malignant systems. The representation of these systems involves relationships linking multiple interdependencies between genetic and epigenetic modifications that lead to cancer development. Relational databases that focus on various features of cancer pathways have appeared with increasing frequency [e.g., MethyCancer (He et al., 2008), Catalogue of Somatic Mutations in Cancer (COSMIC) (Forbes et al., 2015)]. While the relational data approach has proved useful for management of structured data, issues remain in moving forward. For example, (i) integration of multiple data types in relational databases is nontrivial as it involves redefinition of data schema where new information follows a different structure; (ii) in exploration of cancer-related hypotheses, different concepts may need to be linked. Using highly connected information (specific to malignant systems) can be inefficient for queries, which associate (join) data stored in a number of different tables with correspondingly slow response times. The graph database approach has demonstrated capability in facilitating not only both (i) and (ii) but also in (iii) exploration of context, characterized by wide diversity.
In a graph database, concepts are represented by nodes and their associations by edges. Thus, the approach provides a more natural way of representing highly interconnected data, with exploration of stored content benefitting additionally from the use of different graph algorithms. A key feature of graph databases is that traversal exploration is permitted [i.e., nodes can be accessed from neighbor nodes by means of edge connections (relationships)]. This gives a major advantage in terms of performance in comparison to relational databases, where such associations require loops on multiple table indexes. Examples of graph database frameworks include AllegroGraph (AllegroGraph url, n.d.), Sparksee (Sparksee url, n.d.), FlockDB (FlockDB url, n.d.), InfiniteGraph (InfiniteGraph url, n.d.), OrientDB (OrientDB url, n.d.), and Neo4j (Neo4j url, n.d.).
Neo4j is a well-established framework for “property graphs,” fundamental to graph databases specialized for directional relationships (directed edges) and “multirelational graphs” (with nodes linked by multiple different edges). Additional information on concept and relationships can be stored as properties (or attributes) of the nodes and edges. The Neo4j framework uses Cypher, a declarative query language (similar to SQL), to perform data interrogation. In Life Sciences, the Neo4j framework has been used to develop ecosystems that facilitate management (integration, visualization, and exploration) of various biological and medical data types. For example, HitWalker2 is an interactive framework that integrates different data types (such as gene expression, DNA methylation, and drug sensitivity) and can be used to investigate gene context in human diseases (Bottomly et al., 2015). HRGRN is a Neo4j-based framework developed for management of genome-scale data related to Arabidopsis systems (including information on metabolic and signaling pathways, gene regulation), which facilitates investigation of relationships (associations, interactions) among these data (HRGRN url, n.d.).
Neo4j-based models have been developed also to capture and explore semantic relationships among computational and mathematical models related to cancer and to other biological systems [e.g., Johnson et al. (2014) and Henkel et al. (2015)]. In Henkel et al. (2015), authors describe a Neo4j-based framework that facilitates identification, comparison, and ranking of in-silico models (encoded in SBML and CELL-ML standard formats and stored in major specialized resources such as BioModels Database) that correspond to specific categories.
In this study, we present a Neo4j graph database developed for the management of genetic–epigenetic interdependencies in CRC development. We provide Cypher query examples on the way in which the graph database can be applied to CRC initiation to identify (i) genetic–epigenetic modifications and (ii) molecular phenomena observed and reported in the specialized literature. In addition, we explore path connections associated with the highest “incidence score”; the score is computed as a product of the conditional probabilities of relationships between molecular events, with the highest scores associated with the most plausible pathways.
2. Brief Biological Background
CRC initiation is associated with aberrant cell growth rate in the colon epithelium leading to polyps (considered benign). If not removed, the colon adenomatous polyps may increase in size and become malignant over time. Thus, while the colon adenoma is a phenotype, characterized by benign modifications, malignant characteristics are already present at adenocarcinoma or carcinoma stages. As the tumor progresses, cancer cells feature the accumulative aberrant changes within polyps that facilitate cell proliferation and eventually migration. Finally, CRC can extend to other organs, including the liver and lungs, leading to metastasis.
Cancer initiation and progression have been linked, in recent years, to aberrant genetic and epigenetic changes. Epigenetic events are molecular phenomena that influence gene expression without modifying the DNA sequence [e.g., Allis et al. (2007)]. Epigenetic modifications have been observed to occur as part of the aging process and in the earliest stages of human diseases, including cancers and neurodegenerative disorders. Signatures include changes in DNA methylation, proteins known as histones (that contribute to nucleosome arrangement of the DNA sequence), and small noncoding RNAs (which contribute to cell protection) (Allis et al., 2007; Baylin and Jones, 2011). DNA methylation (DNAm) (or the addition of a methyl group to a cytosine ring) is a major epigenetic event with an important role in gene regulation (Allis et al., 2007). Two aberrant forms of DNA methylation, hyper- and hypomethylation (increased and decreased methylation relative to normal, respectively), have been detected in cancer development. Specifically, hypermethylation of the CpG islands 1 in the promoter of the tumor suppressor genes leads, in many cases, to gene silencing, while global hypomethylation influences proto-oncogene activation and chromosomal instability (Bjornsson et al., 2004; Allis et al., 2007; Baylin and Jones, 2011). Modification of histones is another major epigenetic event influencing chromatin dynamics (where chromatin is the combination of DNA and proteins that comprise the cell nucleus). Acetylation 2 and methylation of histones H3 and H4 (known as core 3 histones) are the most studied forms of modification to date.
Interdependency between DNAm and histone modifications also has been recently reported (Cedar and Bergman, 2009). Specifically, findings indicate that unmethylated DNA and histone acetylation determine an open chromatin form, while nonacetylated histones and DNAm induce a more compact chromatin structure. In addition, histone methylation can increase DNAm level. In terms of the dynamics, DNAm is known to change more slowly than histone proteins (Cedar and Bergman, 2009). In addition, small noncoding RNAs play a major role in cellular developmental phases, being involved in cell protection against viral infections and also in determining DNA methylation patterns (Carthew and Sontheimer, 2009; Ghildiyal and Zamore, 2009; Mattick et al., 2009).
Epigenetic modifications are notable, both for their reversibility potential and for faster dynamics compared to genetic alterations (Dworkin et al., 2009; Alegría-Torres et al., 2011). Over the last decade, development of drugs targeting different epigenetic changes has become a major area of interest for pharmaceutical companies. In epigenetic therapy, the focus is thus to identify molecular mechanisms, which can inhibit epigenetic alteration occurring or succeed in reversing that which has taken place, while minimizing side effects of dosage (Azad et al., 2013; Stein, 2014).
3. Methods
3.1. Data collection
The EpiGeNet framework has been developed using a graph database approach by integrating statistical data on molecular interdependencies observed in CRC development, mined from a manually curated and annotated database, StatEpigen (Barat and Ruskin, 2010; StatEpigen url, n.d.) (note: reference date for data integration from StatEpigen into EpiGeNet is November 30, 2015). In StatEpigen, information is structured by simple and conditional relationships between genetic and epigenetic events. Data on hyper/hypomethylation, mutation, histone modifications, loss of heterozygosity, and gene expression are included (for healthy phenotype) with additional detail on polyps, adenoma, carcinoma, or metastasis (for CRC development in aberrant cases). Note: the baseline data extracted from StatEpigen use the gene symbols (HUGO notation); full gene names used in this article are provided in Supplementary Table S1, where the gene symbol-full name mapping was resolved using the “Retrieve/ID mapping” tool from the UniProt database (Consortium, 2015). The simple relationships represent the probability of single molecular event occurrence at a specific oncogenesis stage; for example, from StatEpigen (Barat and Ruskin, 2010),
is the probability of hypermethylation at CpG islands in APC promoter = 0.459 in colon adenoma for the available data set. Simple relationships have general form giving values (val1)
where G = gene symbol, e = molecular event for gene G, s = oncogenesis stage. Thus, in Equation 1, G = APC gene, e = hypermethylation at promoter CpG islands, and s = adenoma. The conditional relationships are given by the Bayesian expression for the dependence of two molecular events, described by:
where G1, G2 = gene symbols, e1, e2 = molecular events for genes G1 and G2, respectively, s = oncogenesis stage, as before. For example, from StatEpigen (Barat and Ruskin, 2010),
is the conditional probability of KRAS mutation (based on empirical evidence from the literature), given APC hypermethylation at CpG islands in adenoma stage. Terms are defined similarly as above. In addition, conditional relationships between various events observed in the context for the same gene can be obtained from the curated literature and are available also in StatEpigen. For example, the relationship
indicates the empirical conditional probability (relative frequency) between two different mutation types of the KRAS gene, in polyps phenotype = 0.330. In this article, such conditional relationships are denoted as “self-relationships” (where G1 = G2 and e1 = e2). For both simple and conditional relationships, the molecular event is denoted by the pairwise list gene symbol (G) and event type (e).
3.2. Data model
In EpiGeNet, molecular events of conditional relationships are represented by the MolecularEvent nodes. The node identifier (key) is given by a pairwise (Gi ei) list; the relationship between molecular events is represented by an edge connecting the two MolecularEvent nodes. The edge type is determined by phenotype information (healthy phenotype or aberrant stages, including polyps, adenoma, carcinoma, metastasis) and edge direction by the conditionality of the relationship. Information on gene symbol and event type is stored as attributes of the MolecularEvent node, and the probability value is stored as a property of the edge (denoted as “CondProbValue”). Details on the experiments, providing information on the conditional relationship, are also stored as edge properties (attributes); specifically, these include the “TestedSampleNo” attribute (number of samples of the experimental analysis) and the “Pmid” attribute (the PubMed identifier of the publications describing the experiments). For example, the conditional relationship shown in Equation 4 is represented by two MolecularEvents nodes, connected by an ADENOMA edge with direction APC hypermethylation -> KRAS mutation, where CondProbValue = 0.269 (Fig. 1). The relationship (Equation 4) was reported in article with PubMed identifier (Pmid) = 16902913 (Judson et al., 2006), where APC hypermethylation was measured in 52 tumor samples. Thus, edge attribute: Pmid = 16902913 and TestedSampleNo = 52. The “self-relationships” (e.g., Equation 5) are represented similarly, with the edge linked in this case to the same node (Fig. 1).
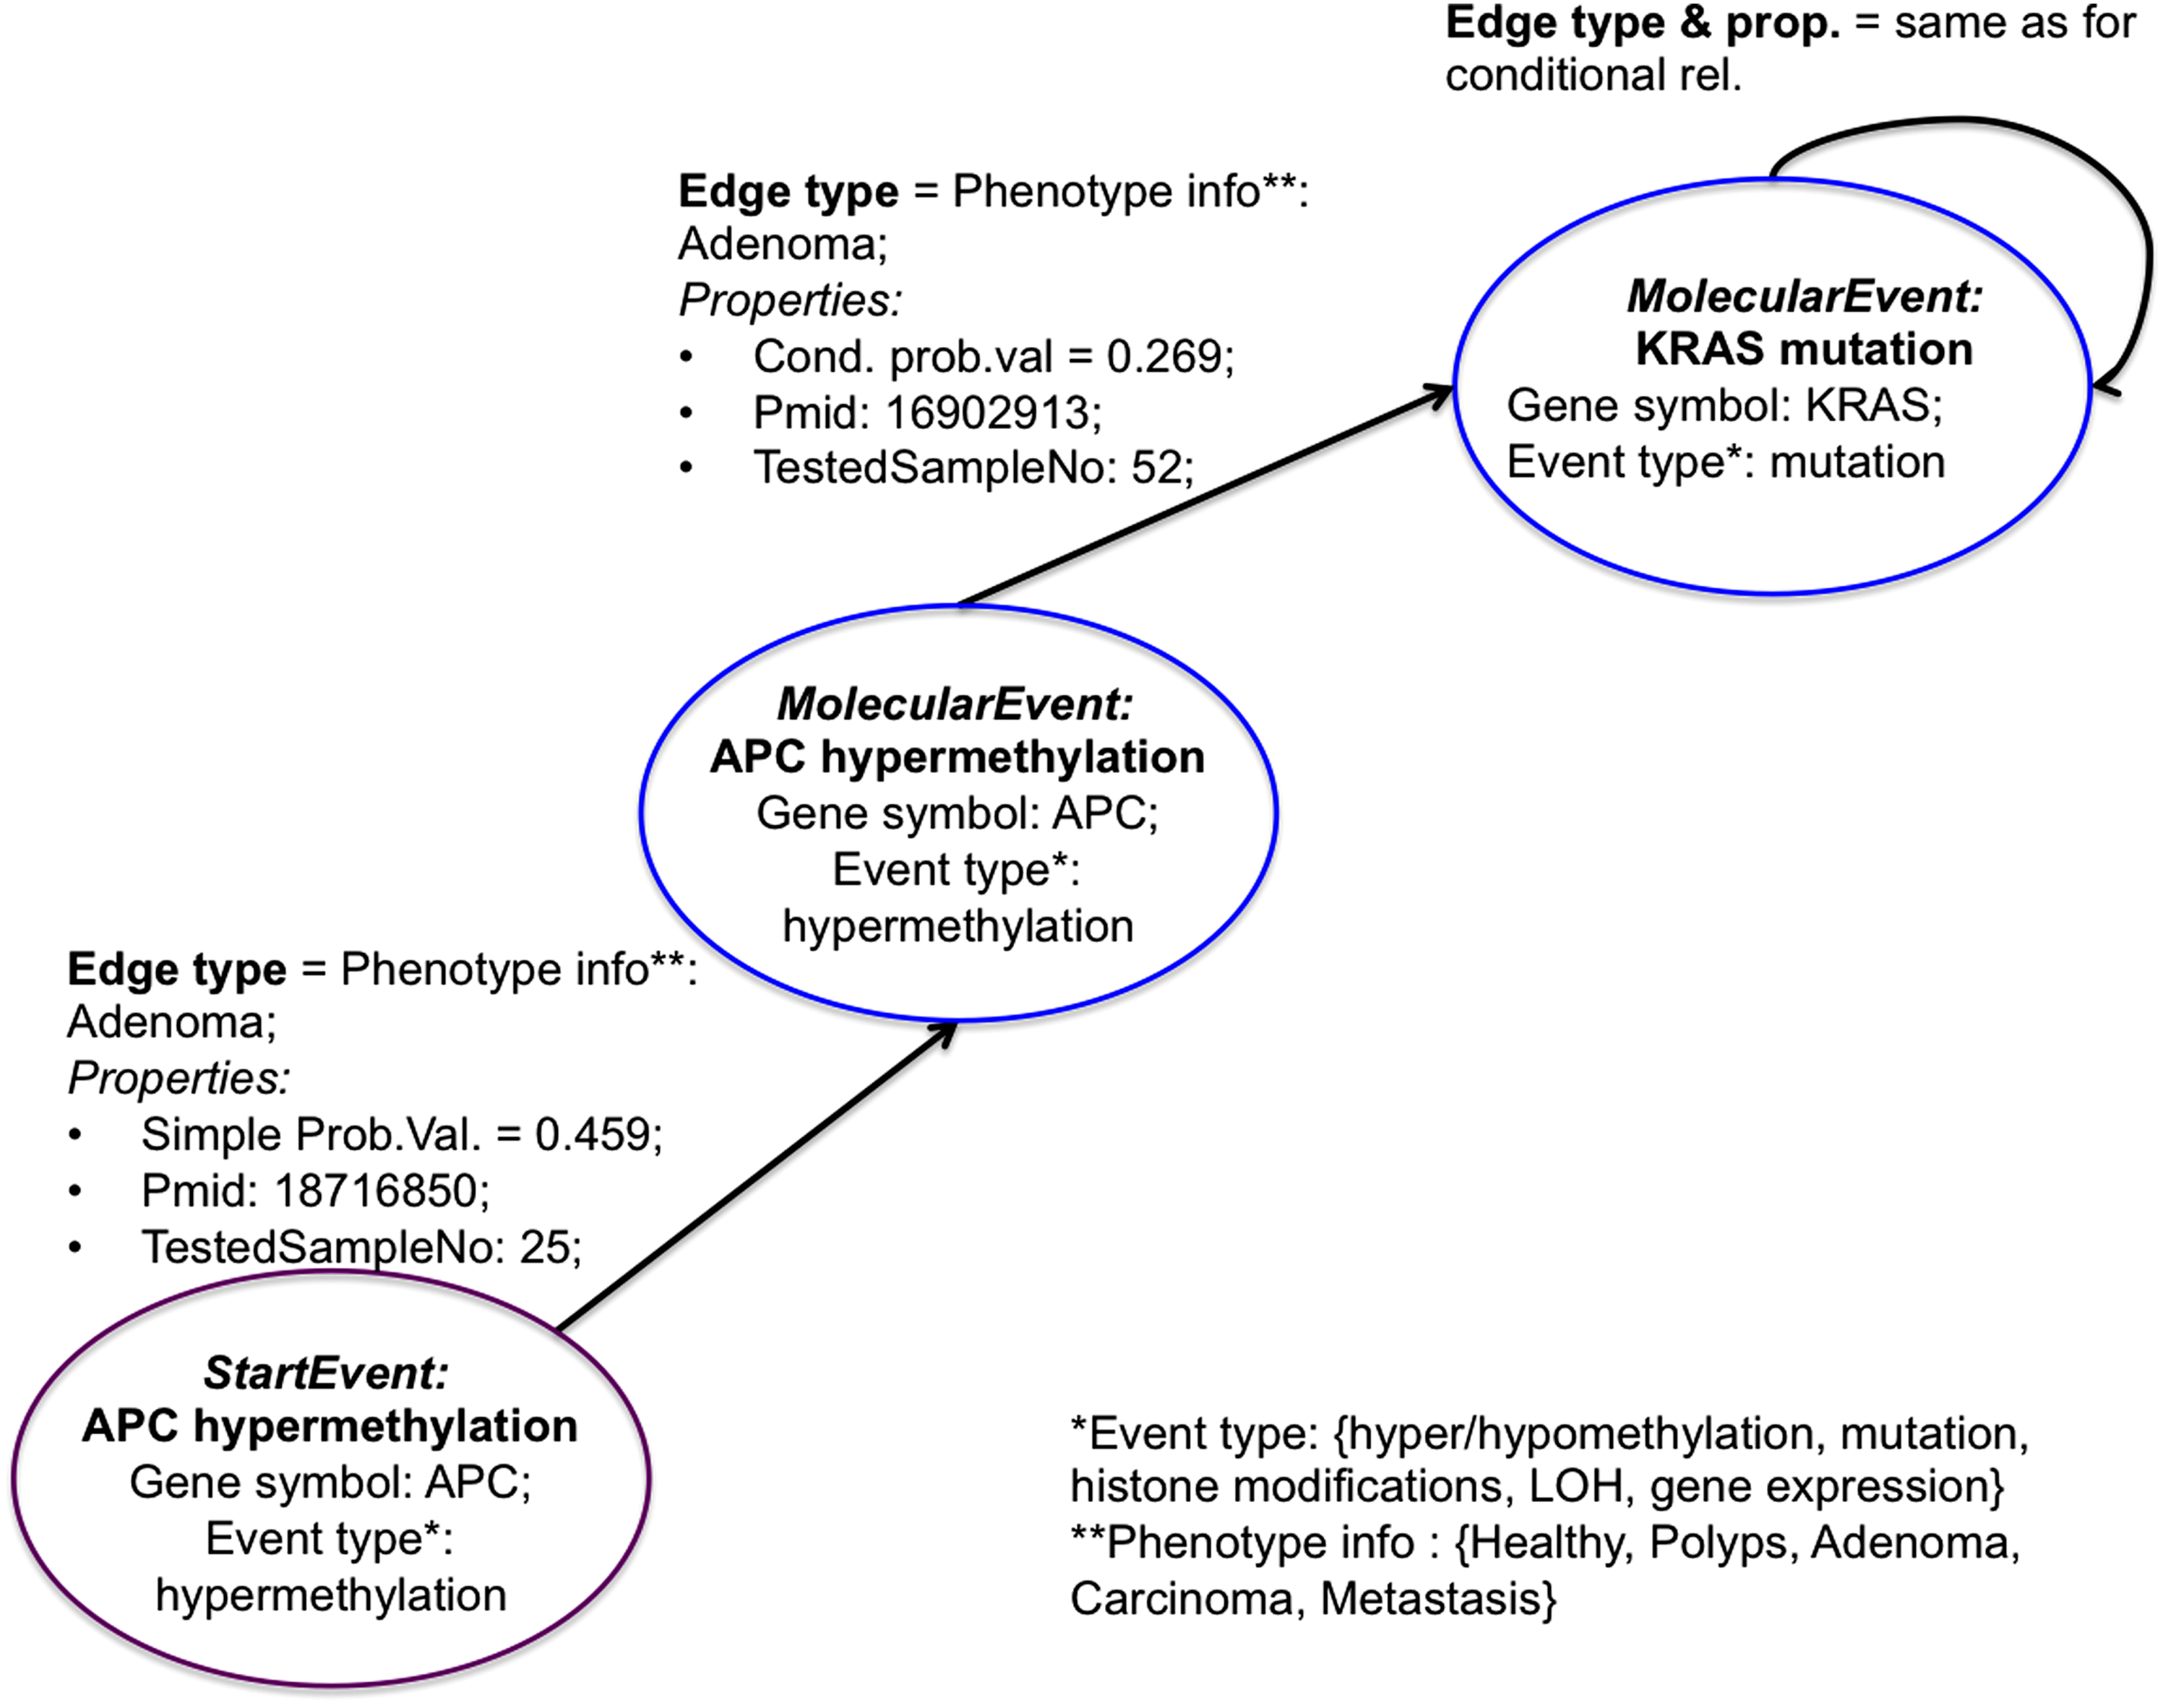
The data model representation. Schematic representation of genetic–epigenetic interdependencies in healthy phenotype and aberrant phenotype, indicating different stages of colon oncogenesis. The conditional relationships are represented by edges connecting two MolecularEvents nodes (blue circles); the simple relationships are represented by edges connecting a StartEvent node (violet circle) and a MolecularEvent node (blue circle). The edge type is given by the phenotype [i.e., healthy, aberrant (polyps, adenoma, carcinoma, or metastasis)], and the edge direction is indicated by the conditionality of the event relationship. Relationship probability value is stored as an edge attribute. Information on gene name and event type is stored as node attributes. Event types are genetic or epigenetic signals, including hyper/hypomethylation, mutation, histone modifications, gene expression, and loss of heterozygosity. In addition, details on experimental analysis (including publication identifier in the PubMed database and the sample number considered) are stored as edge attributes.
The StartEvent node label was introduced for representation of simple relationships [such as expression (Equation 1)] to facilitate distinction between these and self-relationship terms. Thus, a simple relationship is represented by an edge from a StartEvent node to a MolecularEvent node, where both nodes contain the same information on gene symbol and event type. Information on phenotype levels indicates edge type, with simple probability value stored as an attribute of the edge (denoted as the “SimpleProbValue”). Similar to conditional relationship, details on the publication identifier and sample number of the experimental analysis are stored as “Pmid” and “TestedSampleNo” edge attributes, respectively. Hence, the simple relationship shown in Equation 1 (which indicates the probability of gene APC being hypermethylated when phenotype is adenoma) is represented by an ADENOMA edge connecting a StartEvent node (with key = APC hypermethylation) to a MolecularEvent node with the same key (Fig. 1); this edge has attributes, Pmid = 18716850 (Dhir et al., 2008) and TestedSampleNo = 25.
Data from StatEpigen were filtered to include only results where both molecular events are present in the conditional relationships and information on the tested sample number is given. In cases where different studies have reported the same conditional/simple relationships, but with different probability values, these data were combined to give a single conditional/simple relationship with probability value calculated from a weighted arithmetic mean (expectation) based on the initial probability values and tested sample numbers. The data model is represented in Figure 1, and details on the number of edges corresponding to the phenotypes are given in Table 1.
3.3. Availability of the database
The framework described above was developed predominantly in JAVA (eclipse) using the Neo4j 2.3.1 functionality. It is available for noncommercial purposes, and the code files developed to populate the Neo4j graph database using the StatEpigen data are freely available (see the first Reference). The queries described further can be explored (see first Reference for url).
4. Results and Discussion
4.1. Identification of molecular conditional relationships observed in adenoma, but not reported for polyps phenotype (according to StatEpigen data)
Identification of abnormal molecular modifications, specific to adenoma (from empirical StatEpigen sources) together with corresponding polyps phenotype, may facilitate understanding of mechanisms leading to CRC initiation. In Listing 1, we use the Cypher language to address this question and to query events that are exclusively related to adenoma with no polyps phenotype information (based on StatEpigen curation).

The results, for Listing 1, include a set of 43 conditional relationships between genetic–epigenetic events in adenoma, with multiple interdependencies between signals affecting MGMT, APC, TP53, KRAS, and CDKN2A (P14 and P16) genes. The query can be modified to explore differences between different colorectal phenotypes (e.g., adenoma and carcinoma, carcinoma and metastasis) or to include filters on probability values [e.g., all conditional relationships for which the probability is above a given threshold, T = 0.60 (Listing 2)]. With this probability threshold, results from Listing 2 include a set of 26 conditional relationships only, where the subset of the multiply-connected molecular events affects APC, MGMT, and CDKN2A (P14 and P16) genes (Fig. 2).
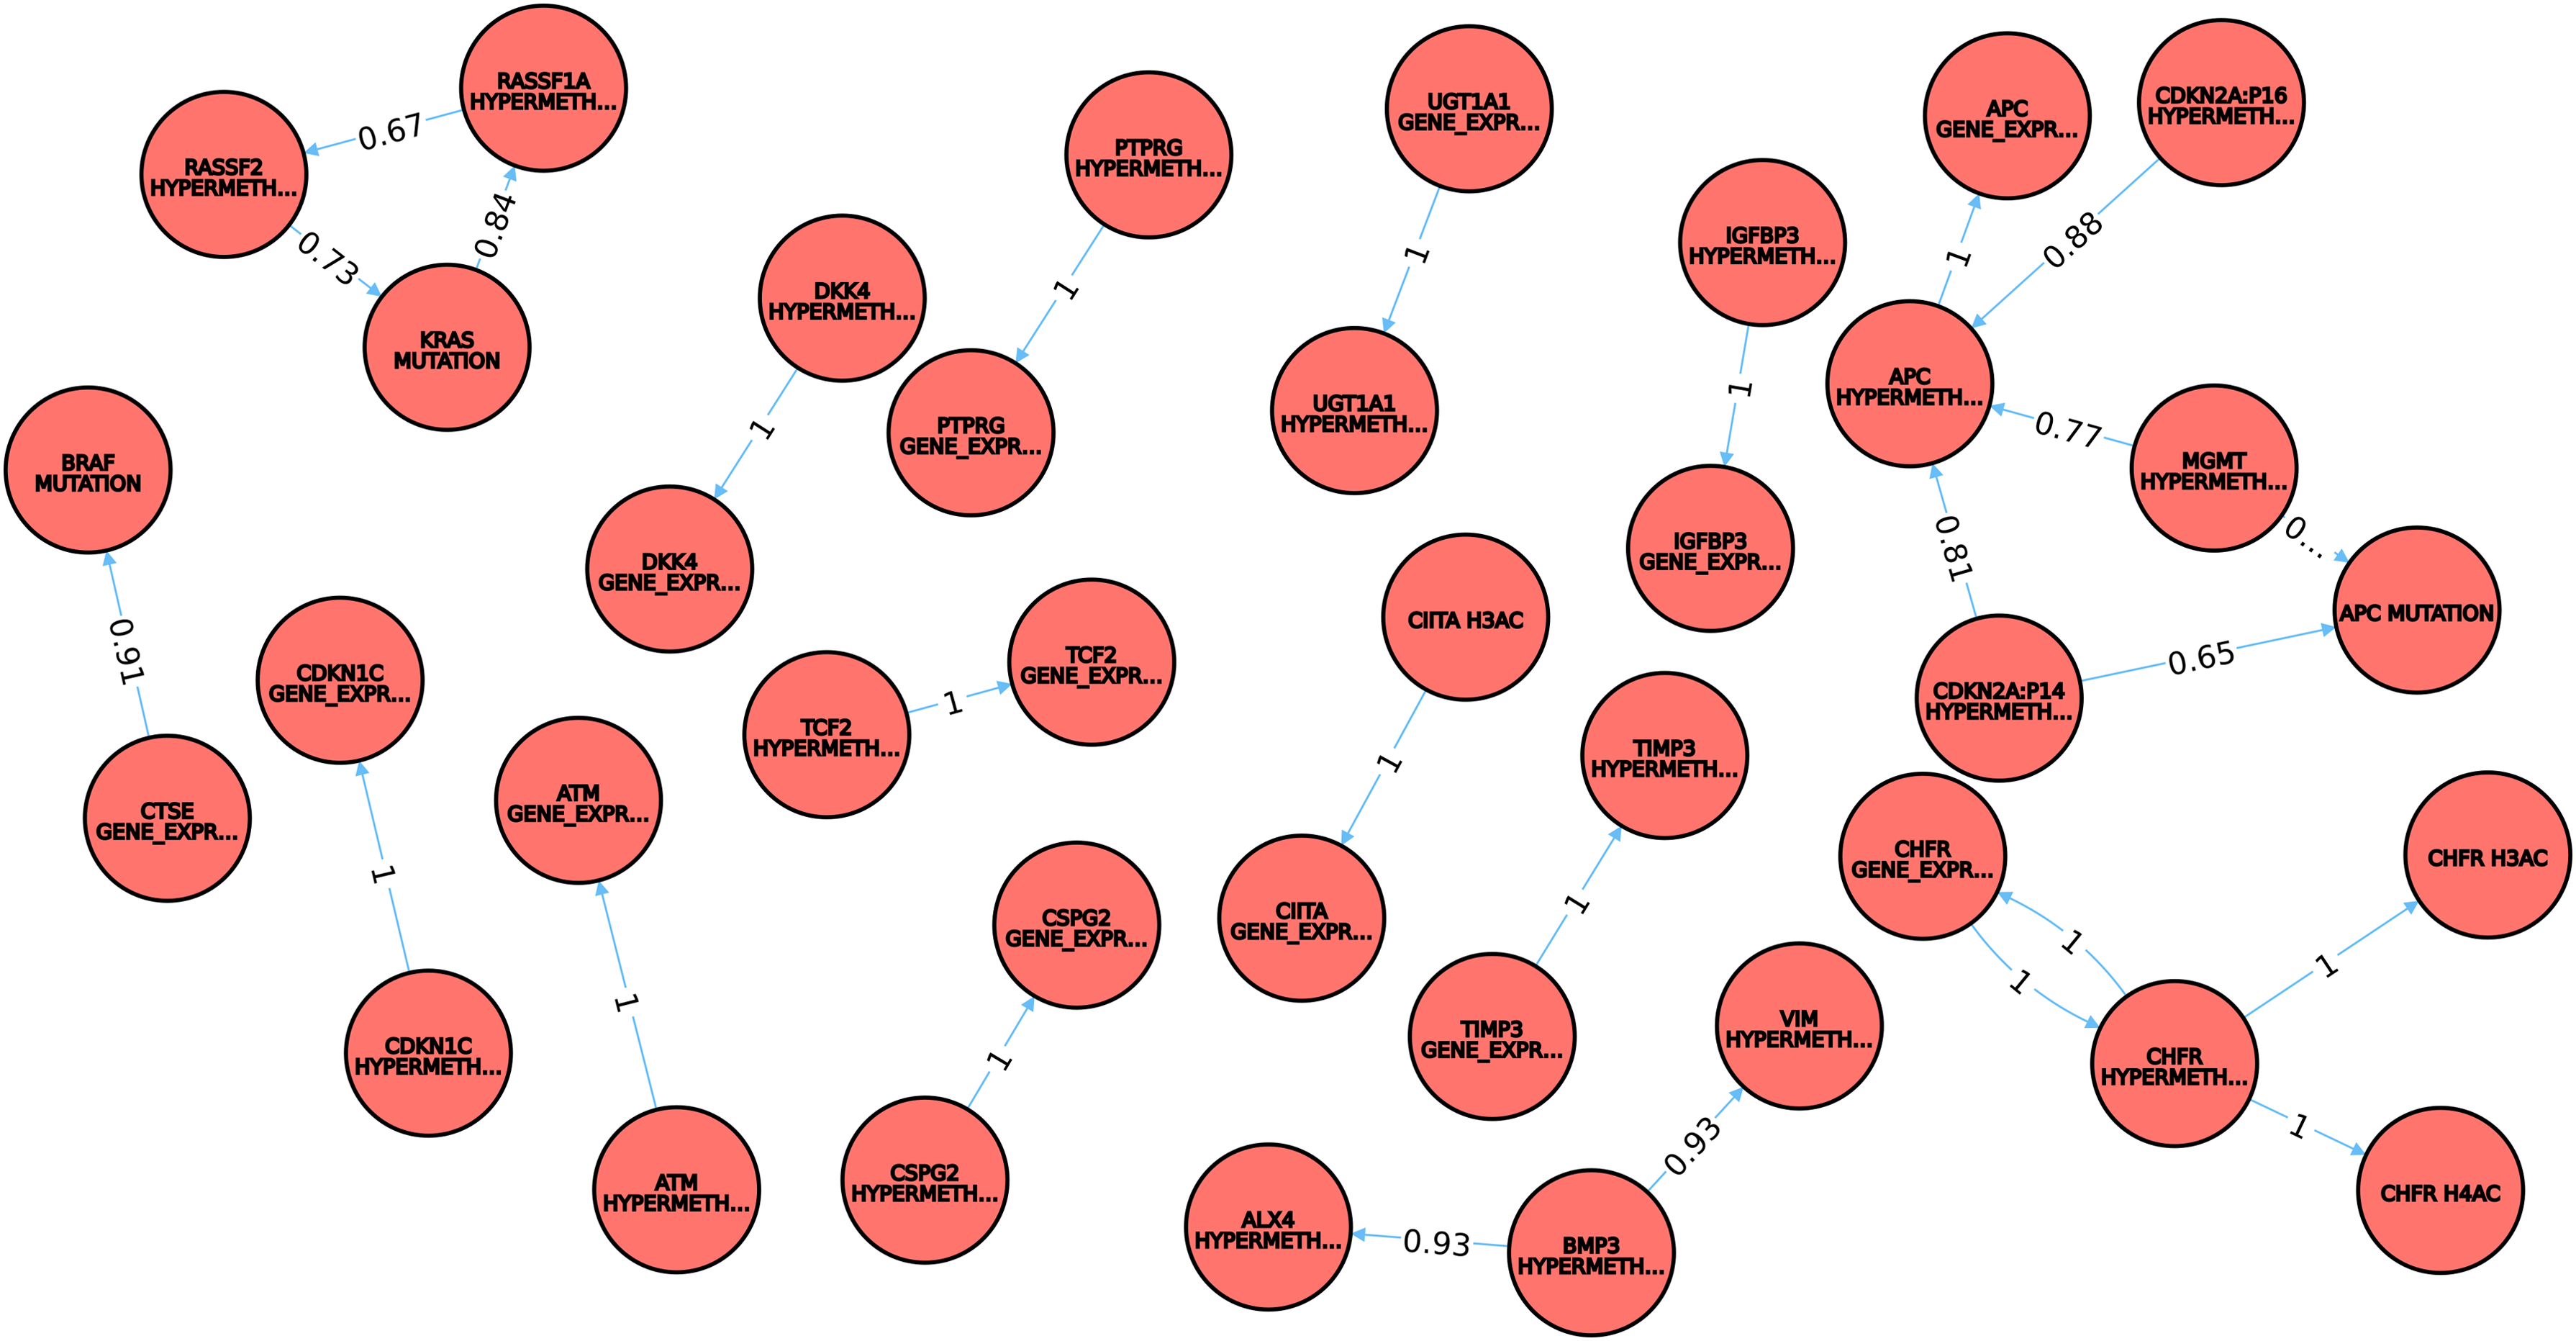
Subnetwork containing molecular conditional relationships observed in adenoma but unreported for the polyps phenotype; only the conditional relationships with probability T >0.60 (Listing 2) are displayed. Legend: nodes: epigenetic and genetic events (e.g., APC hypermethylation, KRAS mutation); edges: colon adenoma (i.e., the phenotype where the molecular signals were observed). Information on probability value of the conditional relationships is stored and displayed as edge's attribute.

4.2. Identification of molecular event neighborhood (in terms of connected nodes) in colon carcinoma
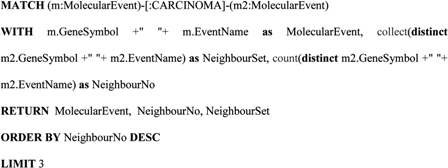
Over the last two decades, several key molecular events in CRC development have been identified. For example, mutation/deletion of TP53 (a cell cycle controlling gene) has been observed in more than 50% of human cancers (Knudson, 2001), and high mutation rates and increased methylation levels have been detected for RASSF1A, KRAS, BRAF, and MGMT genes in CRC (Grady and Markowitz, 2002; Suehiro et al., 2008; Dworkin et al., 2009). Abnormal modifications of the APC gene have been associated with very early CRC stages (Suehiro et al., 2008) and aberrant alterations of MLH1 and MCC genes found in hereditary and sporadic forms of CRC, respectively (Fukuyama et al., 2008). In Listing 3, we are interested in querying the EpiGeNet database for the highest interdependency between molecular events in carcinoma, based on conditional relationship data from StatEpigen. The objective is to explore potential hub events in CRC initiation. Results from this query (Table 2) indicate that MLH1 hypermethylation, JCVT gene expression, and CDKN2A:P16 hypermethylation are the three most frequently observed interdependent events (based on the genetic–epigenetic phenomena in carcinoma, curated from the literature, and stored in the StatEpigen database).
LOH, loss of heterozygosity.
4.3. The most plausible paths (with highest incidence) connecting specific key molecular events (e.g., KRAS mutation and APC hypermethylation) in e.g., adenoma
We are interested in querying for occurrence of the most plausible paths (in terms of the connected graph of conditional relationships between molecular events implicated in CRC) that connect KRAS mutation and APC hypermethylation events [known to be important in CRC development (Grady and Markowitz, 2002; Suehiro et al., 2008)]. The Cypher query is given in Listing 4, and results are shown in Figure 3.
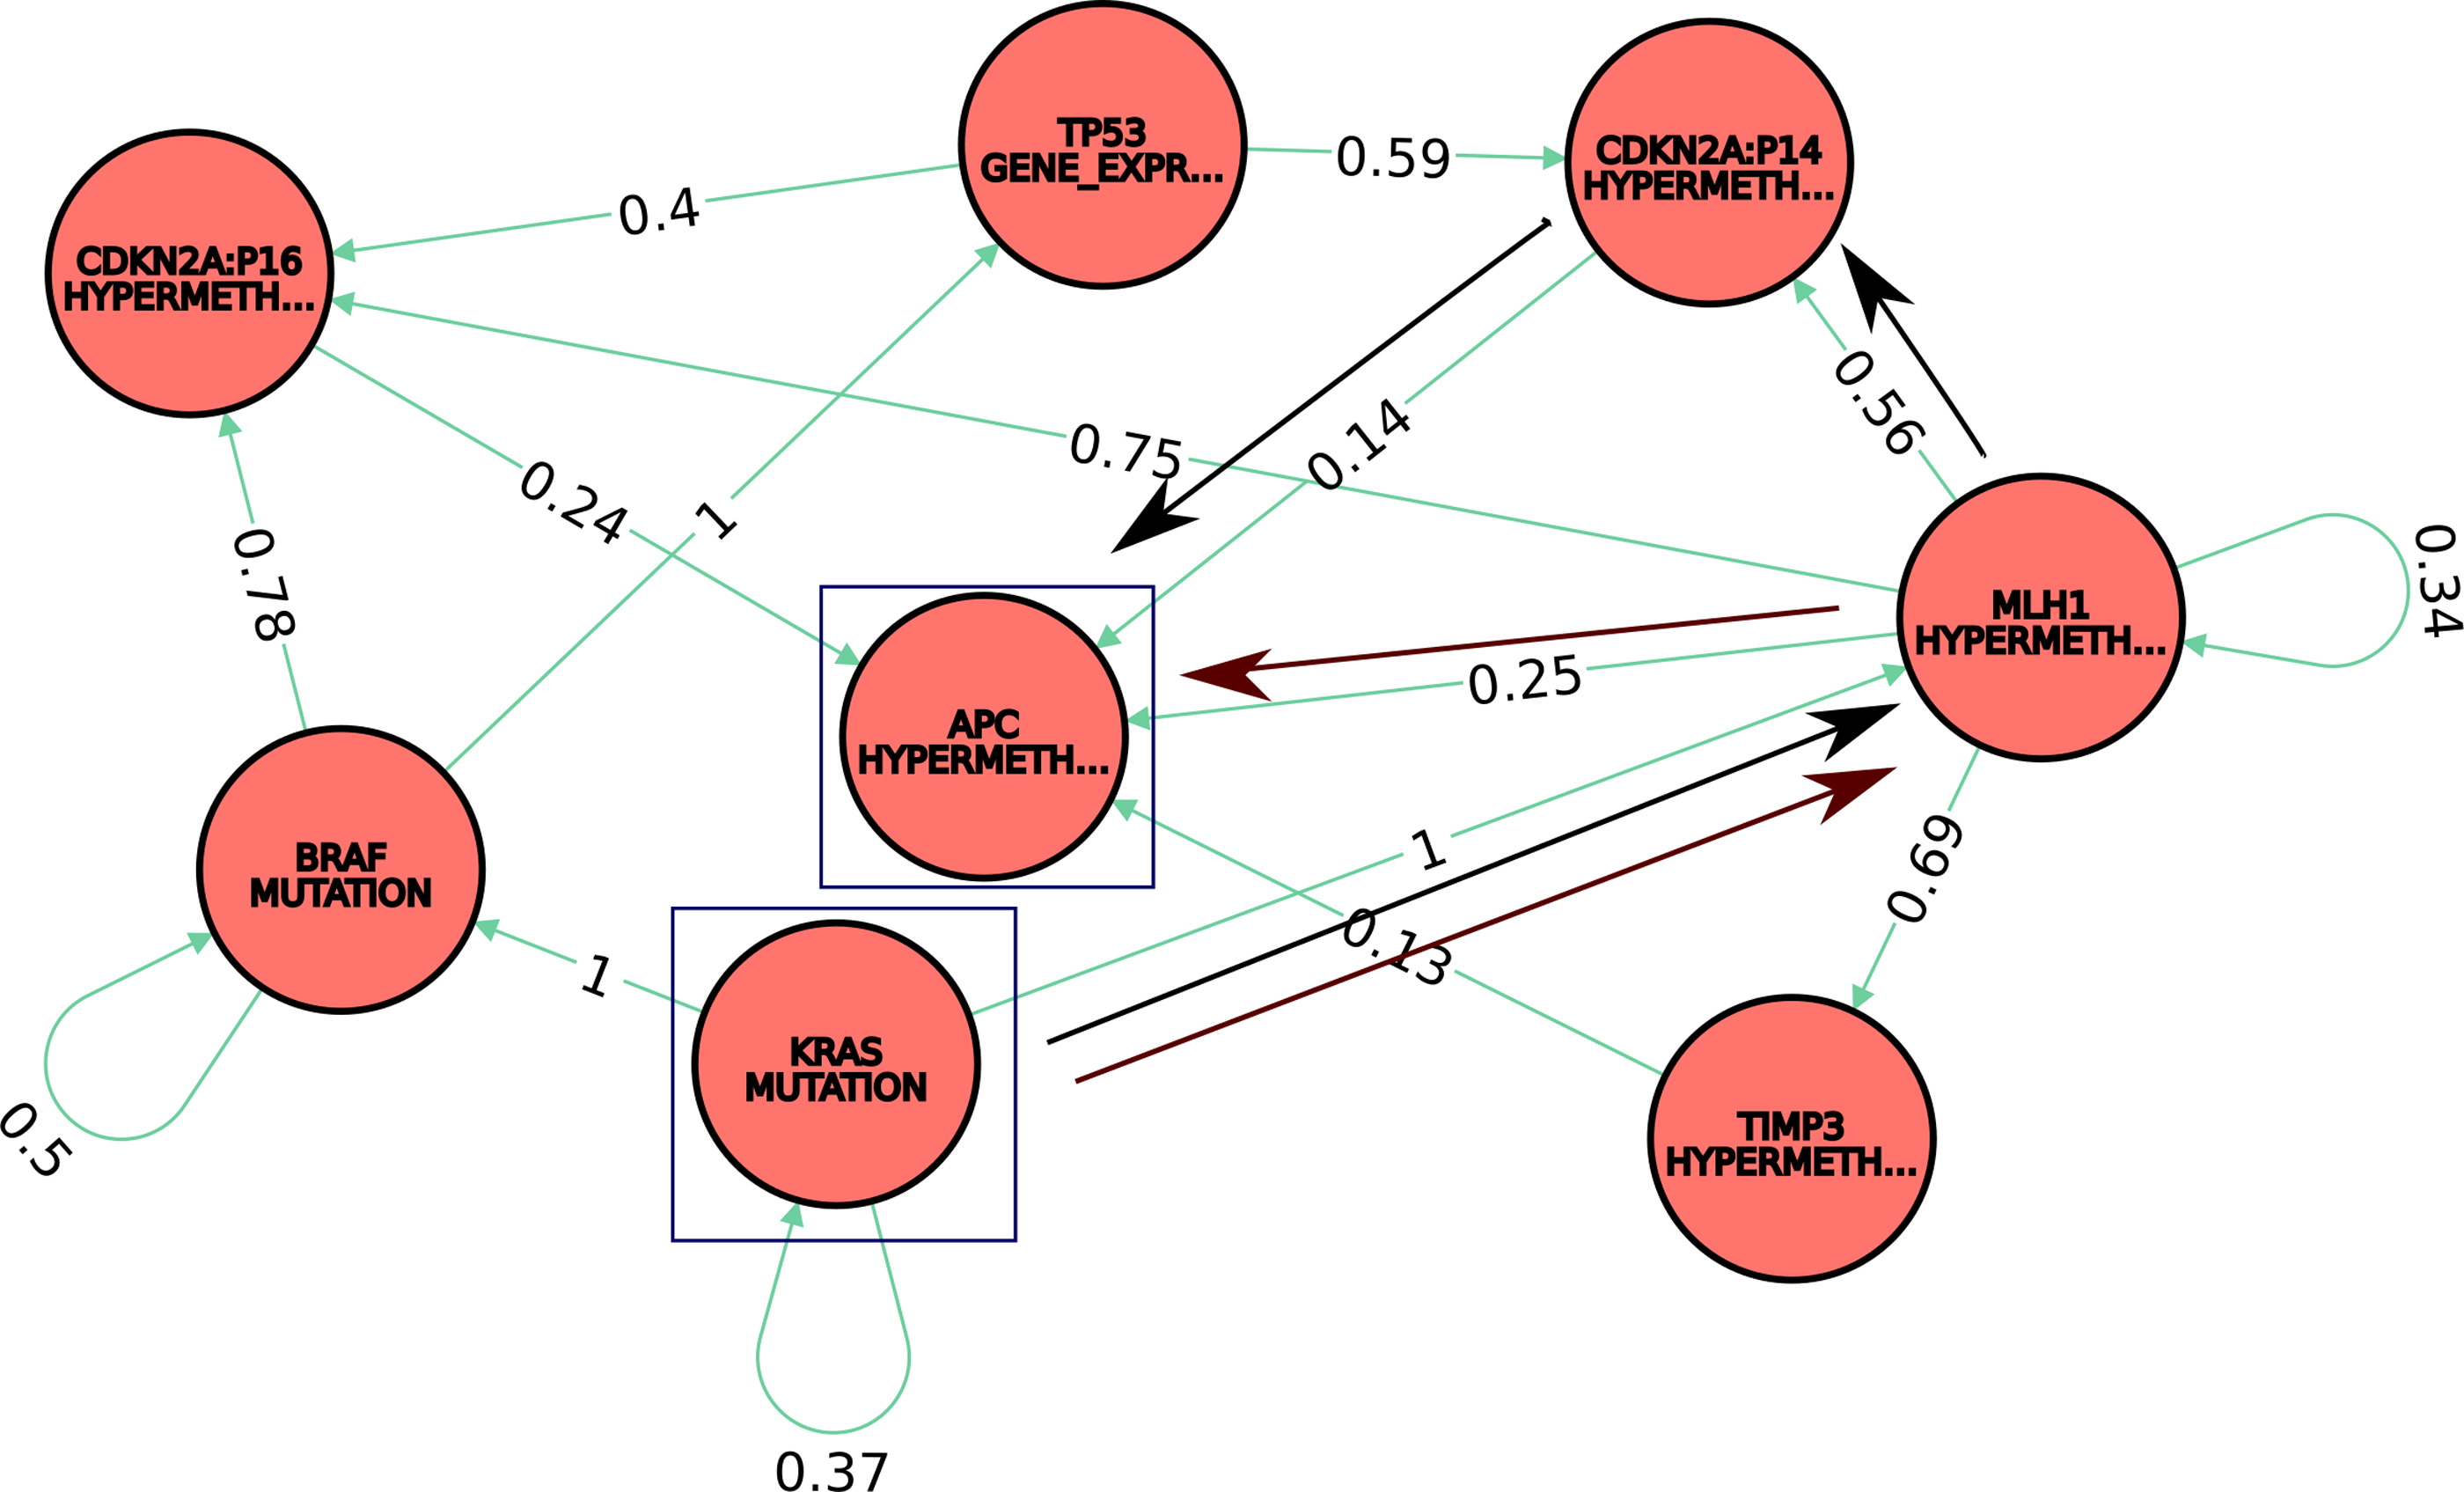
Subnetwork with the most plausible paths between KRAS mutation and APC hypermethylation (blue contour), two molecular modifications known to be important in CRC. Legend: nodes: epigenetic and genetic events (e.g., APC hypermethylation, KRAS mutation); edges: colon carcinoma (i.e., the phenotype where the molecular signals have been observed). Information on conditional relationship probabilities of the molecular events is stored and displayed as edge attribute. Two examples of plausible pathways are highlighted in figure: Path1: KRAS mutation -> MLH1 hypermethylation -> APC hypermethylation (brown arrows) and Path2: KRAS mutation -> MLH1 hypermethylation -> CDKN2A:p16 hypermethylation -> APC hypermethylation (black arrows).
Specifically, the query returns the top 10 most plausible pathways (based on a pathway overall score), composed of a maximum of five conditional molecular relationships connecting the two molecular signals of interest, KRAS mutation, and APC hypermethylation—highlighted by the blue contour in Fig. 3. For example, one such plausible pathway is
Path1: KRAS mutation -> MLH1 hypermethylation -> APC hypermethylation (marked with brown arrows in Fig. 3). The overall score of Path1 indicates the probability of APC hypermethylation given MLH1 hypermethylation and KRAS mutation, that is,
Given that the conditional probabilities were measured independently, expression (Equation 6) can be written as a product of conditional probabilities as follows:
Similarly, an another pathway example (black arrows in Fig. 3) is
Path2: KRAS mutation -> MLH1 hypermethylation -> CDKN2A:p16 hypermethylation -> APC hypermethylation, with the overall score
(based on Fig. 3).
Thus, the pathway overall score is computed as a product of the constituent conditional relationship probabilities. The “reduce” command in Listing 4 (below) computes automatically the scores of plausible pathways and returns the top 10 plausible pathways according to their score values. The maximum number of steps to be included in the plausible pathway ( = 5 in the current case) and the ranked list (LIMIT = 10 in the current example) can be changed to other values if required.

5. Conclusions and Future Work
In comparison with relational databases, the graph database approach facilitates integration of heterogeneous and highly connected biodata and offers a natural representation of relationships among various concepts specific to biological systems (Have and Jensen, 2013). In addition, inspection of the diversity of the biological context, including traversal exploration in networks, identification of key elements (hubs) within systems, and creation of modules to integrate concepts with high degree of similarity (e.g., based on common features, functions, and associations), can benefit from the use of graph-based algorithms. Consequently, results from this type of analysis can help generation of new hypotheses (linking diverse and differently structured concepts) that would be more difficult to formulate without the use of graph-based approaches. In this article, we have described EpiGeNet, a graph database that integrates data on genetic–epigenetic interdependencies observed at different pathological levels in CRC development. First, we used the Cypher language to query differences between polyps and adenoma phenotypes with respect to molecular modifications. Results indicate a set of 43 genetic–epigenetic conditional relationships, with 26 such relationships having probability of occurrence = T > 0.60. These events can be explored further to facilitate interpretation and identification of the mechanisms that differentiate between healthy phenotypes and those specific to CRC initiation. In Listings 3 and 4, details were queried on highly connected conditional molecular changes in carcinoma and on the most plausible paths connecting two major events.
Probabilistic computational models, reliant on available StatEpigen data (StatEpigen url, n.d.), were developed to investigate the most plausible pathways for cancer progression, based on genetic–epigenetic modifications at different stages of colorectal tumor. Variants of these models have also been used previously for exploration of DNA methylation dynamics during CRC initiation and progression [e.g., Roznovăţ and Ruskin (2013) and Barat and Ruskin (2015)]. The results from the EpiGeNet model adaptation can be incorporated into future computational and mathematical models of CRC development, with the added benefits of the combined probability basis for different event types (including those classified as self-aware or consecutive for same node) and graph algorithms for investigation of the gene connections and events involvement.
We have presented also a complementary graph database framework for integration of multiple heterogeneous biological types (Lysenko et al., 2016). This framework, which integrates data from major public resources [including DisGeNet (Bauer-Mehren et al., 2011), DrugBank (Knox et al., 2011), UniProt (Consortium, 2015)] and creates associations between different concepts (e.g., drugs-proteins-diseases), can be complemented by the EpiGeNet database for exploration in the context of human colonic disease.
While EpiGeNet has been developed initially using data available from the publicly accessible StatEpigen database (Barat and Ruskin, 2010), which indicates conditionality for epigenetic–genetic events in CRC, the future aim is integration of data on causality in molecular signals in CRC (i.e., the order in which these events occur). To achieve these further steps, text mining approaches will be utilized together with the Biological Expression Language (BEL) (BEL url, n.d.) to extend EpiGeNet with contextual information on CRC development (extracted from peer-reviewed publications) and enhance current available information.
Footnotes
Acknowledgments
Authors would like to acknowledge access to the Neo4j 2.3.1 framework and the StatEpigen database. They would also like to thank the team of the CNRS/IN2P3 Computing Centre, Mr. J. Bussery, Mr. B. Guillon, Dr. G. Marchetti, and Dr. G. Rahal for their support in deploying and accessing the Neo4j graph database.
Funding
This work has been supported by the Innovative Medicines Initiative Joint Undertaking under grant agreement no. IMI 115446 (eTRIKS), resources of which are composed of financial contribution from the European Union's Seventh Framework Programme (FP7/2007-2013) and EFPIA companies. A.L. and C.J.R. acknowledge support from the BBSRC through their strategic funding of Rothamsted Research.
Author Disclosure Statement
The authors declare that no competing financial interests exist.
References
Supplementary Material
Please find the following supplemental material available below.
For Open Access articles published under a Creative Commons License, all supplemental material carries the same license as the article it is associated with.
For non-Open Access articles published, all supplemental material carries a non-exclusive license, and permission requests for re-use of supplemental material or any part of supplemental material shall be sent directly to the copyright owner as specified in the copyright notice associated with the article.