
Abstract
Abstract
As a result of a high rate of mutations and recombination events, an RNA-virus exists as a heterogeneous “swarm” of mutant variants. The long read length offered by single-molecule sequencing technologies allows each mutant variant to be sequenced in a single pass. However, high error rate limits the ability to reconstruct heterogeneous viral population composed of rare, related mutant variants. In this article, we present two single-nucleotide variants (2SNV), a method able to tolerate the high error rate of the single-molecule protocol and reconstruct mutant variants. 2SNV uses linkage between single-nucleotide variations to efficiently distinguish them from read errors. To benchmark the sensitivity of 2SNV, we performed a single-molecule sequencing experiment on a sample containing a titrated level of known viral mutant variants. Our method is able to accurately reconstruct clone with frequency of 0.2% and distinguish clones that differed in only two nucleotides distantly located on the genome. 2SNV outperforms existing methods for full-length viral mutant reconstruction.
1. Introduction
M
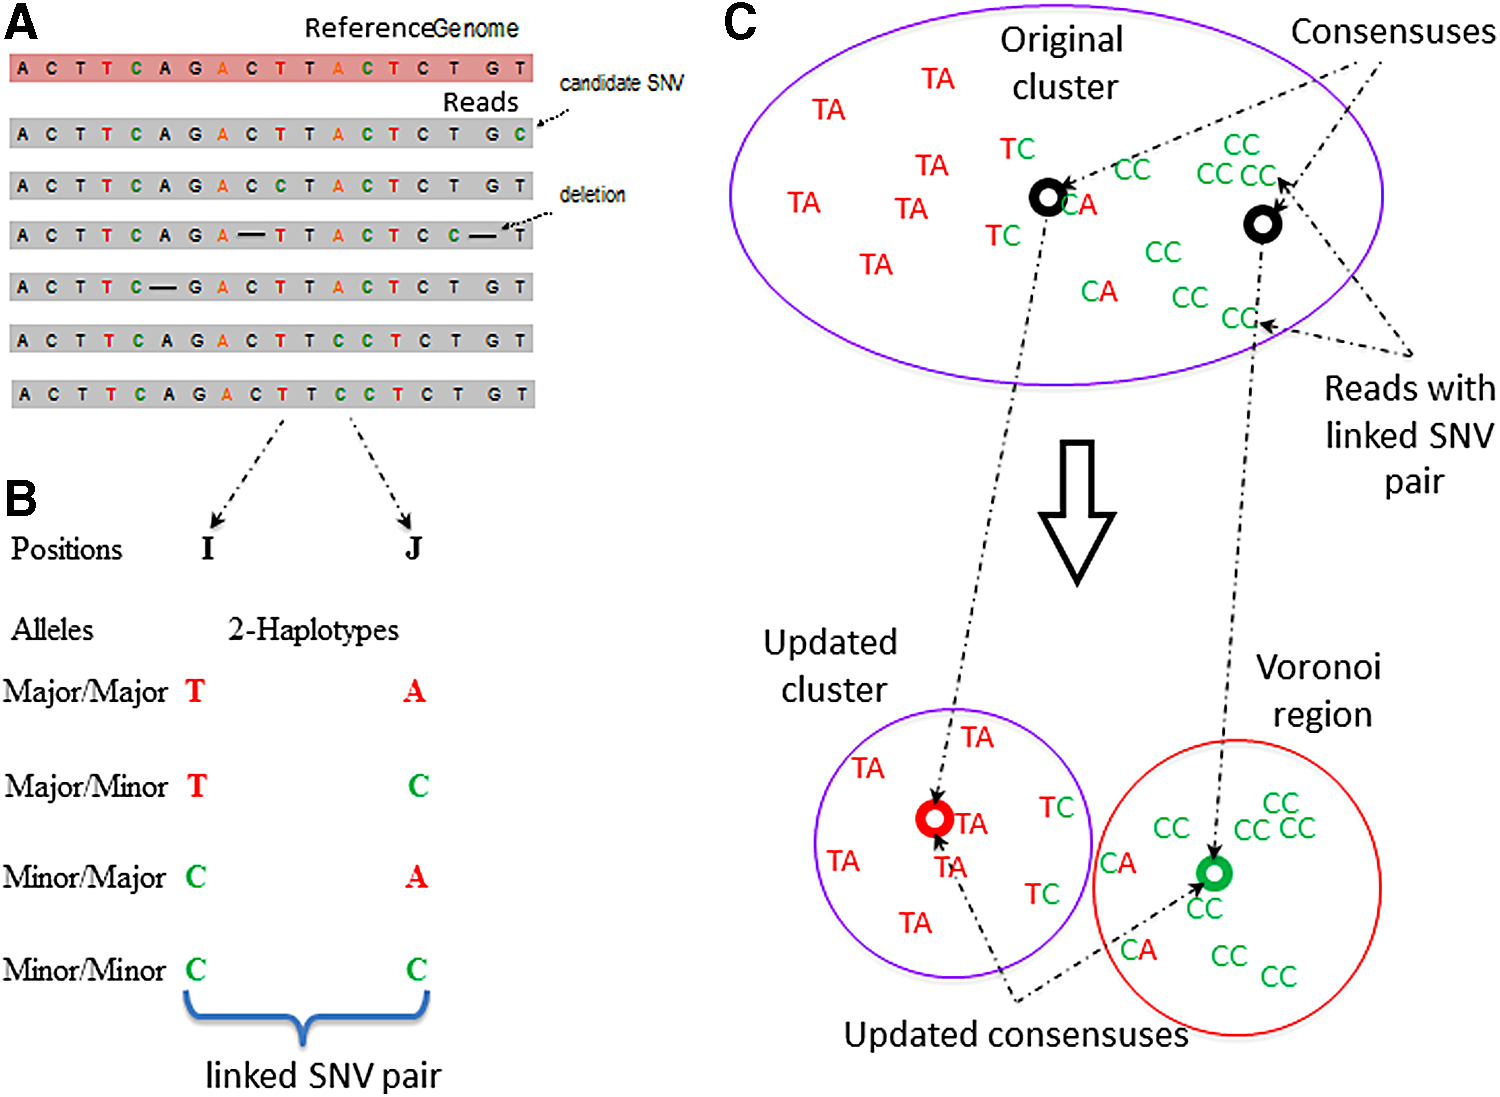
Short reads offered by commonly used fragmentation-based protocols are well suited to detect discrete genome components, such as the frequency of each single-nucleotide polymorphism. However, high similarity of the individual viral genomes imposes a huge challenge to assemble discrete components into a population of full-length viral genomes. In particular, mutations are often located on the distances unreachable by the short reads (Fig. 1). Therefore, even hybrid technologies based on error correction of PacBio reads with Illumina reads were not applied to sequencing of viral variants. Indeed, short reads cannot tell the allele—the same short read is equally well mapped to a variant with the major allele and a variant with the minor allele.

Overview of the long single-molecule sequencing protocol.
Single-molecule real-time (SMRT) sequencing is a parallelized single-molecule DNA sequencing method. PacBio SMRT sequencing reads are much longer than sequencing reads provided by Illumina, however, its throughput is much lower and the error rate is significantly higher. The read length offered by a single-molecule sequencing protocol (Eid et al., 2009) is comparable to the genome size of most RNA viruses. It allows each genome variant to be sequenced in a single pass, providing an accurate phasing of the distant mutations. The main drawbacks of the long single-molecule technologies are the high error rate and comparatively low throughput, limiting ability of those technologies to study the heterogeneous viral populations. Thus, a complete profiling of all viral genomes within a mutant spectrum is not yet possible.
Recently, this problem has been addressed using various computational and statistical approaches implemented in QuasiRecomb (Töpfer et al., 2013), PredictHaplo (Prabhakaran et al., 2014), HaploClique (Töpfer et al., 2014), VGA (Mangul et al., 2014), and k GEM (Skums et al., 2015). These methods perform reasonably well on short reads with high coverage and low error rate, but our experimental validation shows far from satisfactory performance on the sequencing data provided by single-molecule technologies. Also, a workflow for reconstruction of closely related variants from raw reads generated during SMRT sequencing was proposed in Dilernia et al. (2015). Note that a recent method for haplotyping using PacBio reads proposed in Tilgner et al. (2014) is only applicable for diploid organisms and is not suitable for viral haplotyping with numerous variants.
In this article, we present two single-nucleotide variants (2SNV), a comprehensive method for the accurate reconstruction of the heterogeneous viral population from the long single-molecule reads. The 2SNV method hierarchically clusters together reads containing pairs of correlated (i.e., linked) SNVs until no cluster has correlated SNVs left and outputs consensus of each cluster. It allows to reduce error rate and differentiate true biological variants from sequencing artifacts, thus providing increased accuracy to study diversity and composition of the viral spectrum. To benchmark the sensitivity of 2SNV, we performed a single-molecule sequencing experiment on a sample containing a titrated level of known viral mutant variants. We were able to reconstruct a haplotype with a frequency of 0.2% and distinguish clones that differed in only two nucleotides. We also showed that 2SNV outperformed existing haplotype reconstruction tools. With a high sensitivity and accuracy, 2SNV is anticipated to facilitate not only viral quasispecies reconstruction but also other biological questions that require detection of rare haplotypes, such as genetic diversity in cancer cell population, and monitoring B cell and T cell receptor repertoire. The open source implementation of 2SNV is freely available for download (see the first Reference).
2. Methods
Any method for reconstruction of viral variants from single-molecule reads should overcome low volume and high error rate of sequencing data combined with very high similarity and very low frequency of viral variants. This challenge is equivalent to extraction of an extremely weak signal from very noisy background with signal-to-noise ratio approaching zero. However impossible this task may seem, a satisfactory solution can be based on distinguishing randomness of the noise from systematic signal repetition. Previously, linkage between SNVs was used for distinguishing sequencing errors from SNVs (Macalalad et al., 2012), however, to the best of our knowledge, it was never applied for haplotyping.
Since all reads are from the same RNA region of very similar sequences, they can be reliably aligned to each other. In general, the errors in different positions are independent from each other and the further these positions are from each other the less likely any dependency can be caused by systematic errors. Therefore, even slightly more than expected co-occurrence of two rare alleles in nonadjacent positions may serve as a trustful signature of one or more rare variants having both rare alleles. Such single-nucleotide variations (SNVs) are called linked.
The proposed 2SNV method recursively clusters reads containing pairs of linked SNVs until no pair of SNVs exhibits statistically significant linkage in any cluster. Then, each cluster should contain just a single viral variant, which can be simply reconstructed as the consensus of all reads in the cluster.
In the remainder of the section, we derive statistical conditions of SNV linkage and then give detailed description of the 2SNV method that identifies rare variant-based SNV pairs satisfying these conditions.
2.1. Linkage of SNV pairs
In this section, we analyze statistical significance of the linkage between a pair of SNVs, which allows to distinguish reads emitted by a rare variant from background errors.
We assume that errors are random and a rare variant has at least two mismatches with other variants. Let us consider an arbitrary pair of two distinct positions
Overview of the 2SNV method.
Let
The inequality (Equation 1) becomes an equality if at least one of 2-haplotypes
Let
To prove (Equation 1), it is sufficient to show that
Note that only coefficients for
The last inequality holds since observing the true allele is more probable than observing the erroneous allele and, therefore,
Note that Theorem 1 does not require linkage disequilibrium of haplotypes—the lack of linkage is explained by errors. The 2SNV method uses Theorem 1 to decide if the alleles I2 and J2 are linked as follows. Let
is the largest probability of observing the 2-haplotype
Since we are looking for a pair of SNVs among
where p is defined in Equation (2) and
Finally, when the cluster is too small, the statistical test (Equation 4) may be not stringent enough to weed out spurious linkages. Therefore, we require the number of reads
Note that the binomial model used in Equation (4) may not be stringent enough to compensate for reducing PPV caused by overdispersion especially for higher coverage. In future releases of our tool, we plan to take into account additional variance modeling unknown experimental data processes contributing to variance, e.g., replacing the binomial distribution with the beta-binomial distribution.
2SNV Algorithm
2.2. 2SNV method for viral variant reconstruction
The input to 2SNV consists of a set of aligned PacBio reads (Fig. 2a). Alignment required to be in a form of multiple sequence alignment (MSA). The MSA algorithms are too slow to handle PacBio data sets; so instead, we use pairwise alignment by BWA (Li and Durbin, 2009) and b2w from Shorah (Zagordi et al., 2011) to transform pairwise alignment to MSA format.
The main novel step of the 2SNV algorithm identifies a pair of linked SNVs (Fig. 2b) with higher than expected portion of reads containing the 2-haplotype with both minor alleles according to Equations (2)–(4).
The 2SNV method maintains a partition of all reads into clusters. Each cluster is assumed to consist of the reads emitted by the single variant coinciding with the cluster consensus (Fig. 2c). Until no pair of SNVs in the cluster C is linked, we recursively partition C into two clusters C1 and C2. C1 consists of reads with the linked pair of SNVs and C2 consists of the remaining reads of C. We further modify C1 and C2 by replacing them with the Voronoi regions of their consensuses, where the Voronoi region of the consensus c1 of C1 consists of reads that are closer to c1 than to the consensus of C2. Finally, k GEM finds maximum likelihood estimates of frequencies of haplotypes represented by cluster consensuses using expectation-maximization algorithm (Skums et al., 2015).
Algorithm 1 describes the formal pseudocode of the 2SNV algorithm.
3. Results
We were using three data sets: PacBio reads from a single IAV clone and 10 IAV clones, and simulated PacBio reads from 20 HCV clones.
Error-prone PCR was performed on the influenza A virus (A/WSN/33) PB2 segment using the GeneMorph II Random Mutagenesis Kits (Agilent Technologies, Westlake Village, CA) according to the manufacturer's instruction. The 2 kb region was amplified from the IAV viral population and subjected to PacBio RS II sequencing using two SMRT cells with P4-C2. The average read length was 1973 bp and ranges from 200 bp to 5 kb. Some reads are much longer than the amplified region due to long insertions that are sequencing errors. Raw sequencing data have been submitted to the NIH short read archive under accession number: BioProject PRJNA284802. The nucleotide sequences of the 10 clones are freely available (see the first Reference).
3.1. The data set with a single IAV clone
The total number of reads was 11,907 and the average Hamming distance between the true haplotype and reads is 14.4%.
3.2. The data set with 10 IAV clones
Ten independent clones, ranging from 1 to 13 mutations from the original single, were selected. These 10 clones were mixed at a geometric ratio with a twofold difference in occurrence frequency for consecutive clones starting with the maximum frequency of 50% and the minimum frequency of 0.1%. The pairwise edit distance between clones is given in the heat map on Figure 3. In total, there were 33,558 reads generated from 10 clones.

The heatmap representing pairwise edit distance between the 10 IAV clones.
3.3. The simulated data set with 20 HCV clones
21K simulated PacBio reads were generated from 1739-bp-long fragment from the E1E2 region of 20 HCV sequences (Von Hahn et al., 2007) using simulator pbsim (Ono et al., 2013). The reads were simulated with mean accuracy 98% and minimum accuracy 95% reflecting advancements in PacBio technology. We have generated reads 10 times for two distributions of the clone frequencies—uniform (all frequencies are 5%) and skewed (a single clone has 90.5% and every other clone has frequency of 0.5%).
3.4. Reconstruction of viral variants
2SNV was compared with two tools originally tuned to handle HIV variants [PredictHaplo; Prabhakaran et al. (2014), QuasiRecomb; Töpfer et al. (2013), and k GEM; Skums et al. (2015)] tuned for a short HCV amplicon. We could not compare with HaploClique (Töpfer et al., 2014) since it is no longer maintained by the authors. A workflow (Dilernia et al., 2015) is not currently available and we were not able to run it on our data. Also, the experimental data in Dilernia et al. (2015) are also not fully available and we were not able to run 2SNV on these data.
For the data set with a single IAV clone 2SNV, k GEM and PredictHaplo were able to reconstruct no more than a single variant, which perfectly matches the original clone. QuasiRecomb reported multiple variants, none fully matching the original clone.
For the data set with 10 IAV clones, 2SNV reported 10 haplotypes: the 9 most frequent haplotypes exactly matching 9 most frequent clones and the least frequent haplotype (1%) not matching any clone. The correlation between the estimated and true frequencies of the nine correctly reconstructed haplotypes is 99.4%. PredictHaplo was able to reconstruct only six true variants missing four variants with total frequency of 8% while not having any false positives. To reliably compare the reconstruction rate of two methods, we have applied them to 40 subsamples of the original data (each subsample consists of 33,558 reads randomly selected with repetition from the original data). The results are presented in Figure 4 and Table 1. k GEM was able to reconstruct only two most frequent clones, and QuasiRecomb failed to reconstruct even a single clone.
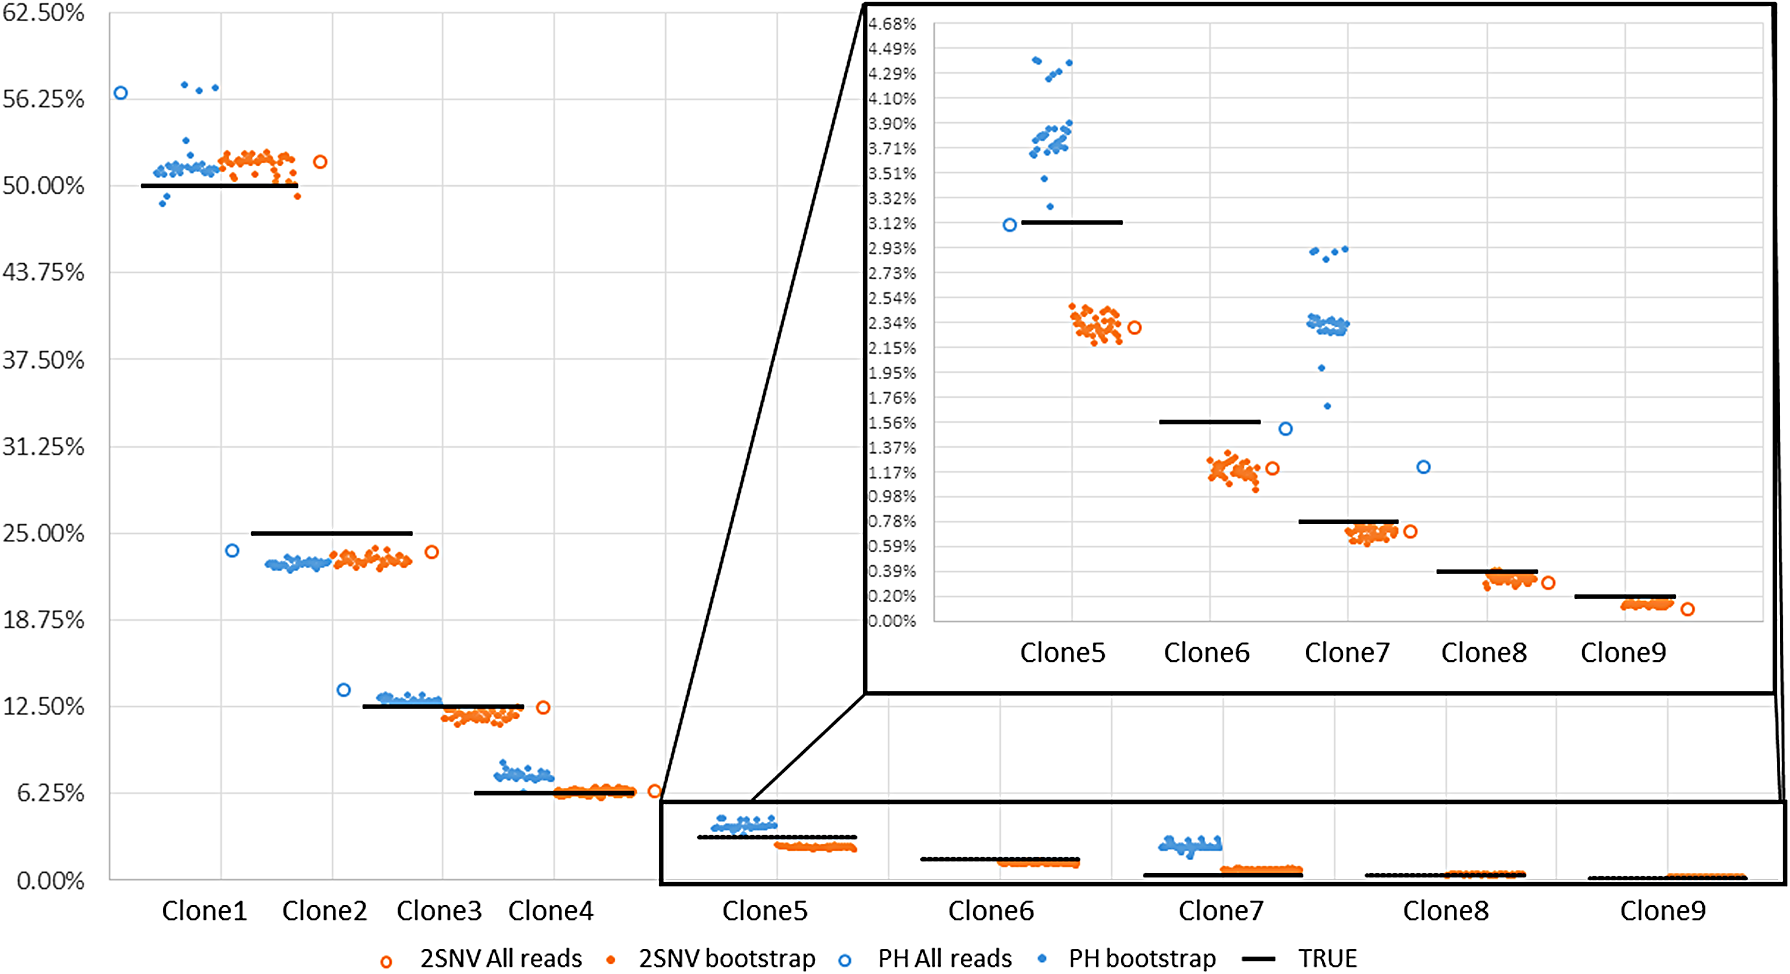
The results of running 2SNV and PredictHaplo (PH) on the original sample with all 33,558 reads and on 40 bootstrapped samples (only 35 runs of PH were successful), y axis labels are clone frequencies and x axis labels are clone ids. Horizontal black bars are representing true clone frequency and colored dots are representing frequency reported by corresponding method in each of 40 runs. Clones 6 and 9 were never reconstructed by PH and clone 8 was reconstructed only on full data.
For all 33.5K reads, the sign “✓” (respectively, “ × ”) denotes fully matched (respectively, unmatched) true variant and the column FP reports the number of incorrectly predicted variants (false positives) and their total frequency. 95 CI showing results on 40 bootstraps, “—” means variant was never reconstructed.
2SNV, two single-nucleotide variants; CI, confidence interval.
To estimate how accuracy of reconstruction methods depends on the coverage, we have randomly subsampled N reads (

Dependency of accuracy on coverage represented by the number of reads. N reads (N = 500, 1000, 2000, 4000, 8000, 16,000) were randomly selected 10 times from the original data and both methods 2SNV and PredictHaplo were applied. For N = 500 and N = 1000, PredictHaplo gave results only in 5 and 9 runs, respectively. Each dot represents the reconstructed frequency of the clone in the respective runs.
For all 33.5K reads, the sign “✓” (respectively, “ × ”) denotes fully matched (respectively, unmatched) true variant and the column FP reports the number of incorrectly predicted variants (false positives) and their total frequency. For each subsample size (16K, …, 0.5K), the table reports the percent of runs when a variant is completely matched and its average frequency. Similarly, the column FP reports the average number of false-positive variants and their average total frequency.
For the simulated data set with 20 HCV variants, we have compared 2SNV only with PredictHaplo. For the uniform frequency distribution, the average sensitivity and PPV for 2SNV are 85% and 100%, respectively, while for PredictHaplo, the corresponding values are 72% and 53%, respectively. For the skewed frequency distribution, the average sensitivity and PPV for 2SNV are 99% and 69%, respectively, while for PredictHaplo, the corresponding values are 36% and 46%, respectively.
3.5. Runtime
The runtime of 2SNV is linear with respect to the number of reads, however, implementation is
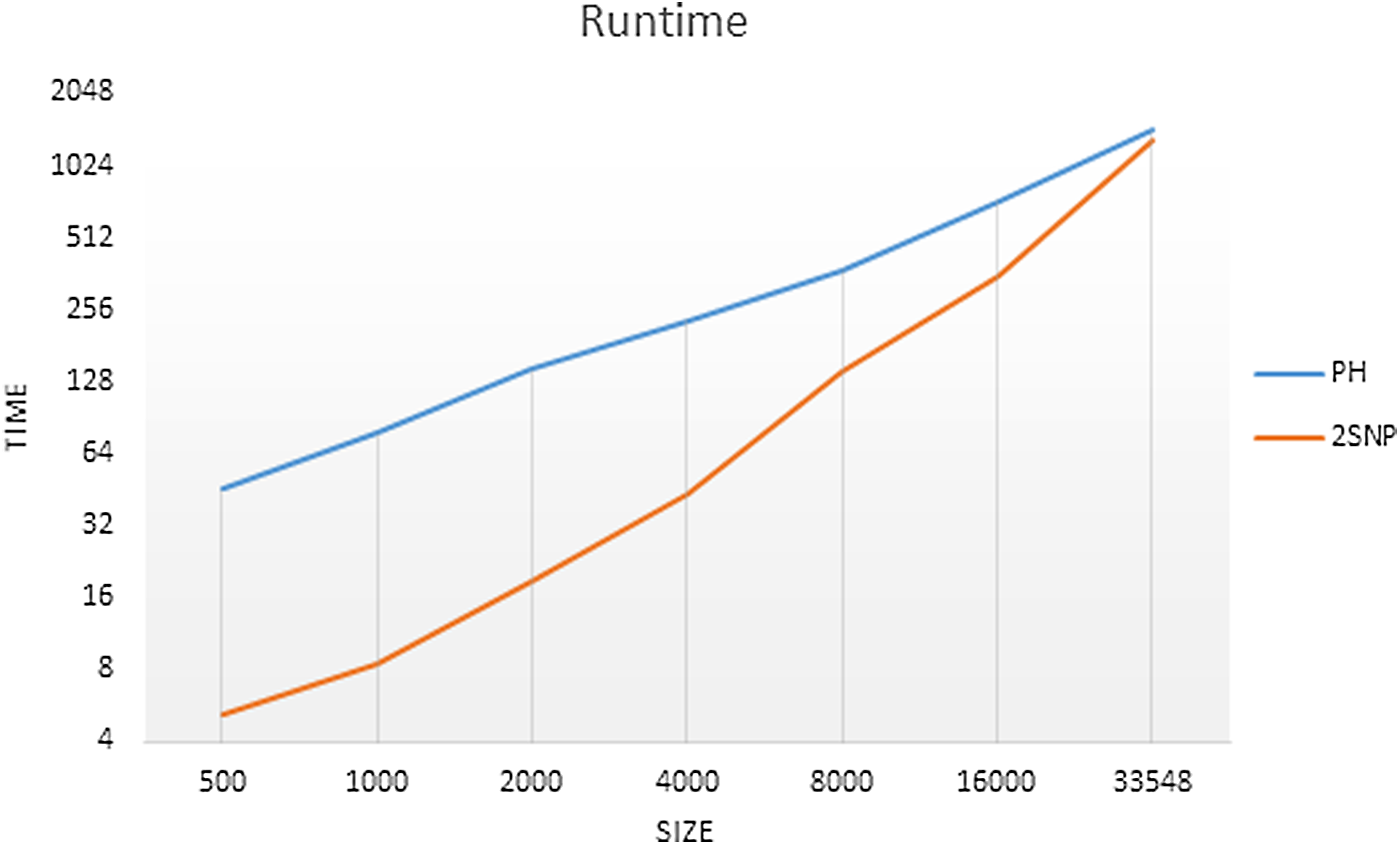
Runtime of PredictHaplo (PH) and 2SNV on data sets with different sizes. The runtime of 2SNV includes processing of alignment with b2w.
4. Discussion
Haplotype phasing represents one of the biggest challenges in next-generation sequencing due to the short read length. The recent development of single-molecule sequencing platform produces reads that are sufficiently long to span the entire gene or small viral genome. It not only benefits the assembly of genomic regions with tandem repeat (Doi et al., 2014; Ummat and Bashir, 2014; Krsticevic et al., 2015) but also offers the opportunity to examine the genetic linkage between mutations. In fact, it is shown that the long read in single-molecule sequencing aids haplotype phasing in diploid genome (Pendleton et al., 2015), and in polyploid genome (Aguiar and Istrail, 2013). Nonetheless, the sequencing error rate of single-molecule sequencing platform is extremely high (
In this study, we have developed 2SNV, which allows quasispecies reconstruction using single-molecule sequencing despite the high sequencing error rate. The high sensitivity of 2SNV permits the detection of extremely rare haplotypes and distinguishes between closely related haplotypes. Based on titrated levels of known haplotypes, we demonstrate that 2SNV is able to detect a haplotype that has a frequency as low as 0.2%. This sensitivity is comparable to many deep sequencing-based point mutation detection methods (Harismendy et al., 2011; Flaherty et al., 2012; Forshew et al., 2012; Li and Stoneking, 2012). In addition, 2SNV successfully distinguishes between Clone5 and Clone6 in this study, which are only two nucleotides away from each other. It highlights the sensitivity of 2SNV to distinguish closely related haplotypes. Our results also show that the sensitivity is coverage dependent, implying that the sensitivity of 2SNV may further improve when sequencing depth increases. Therefore, the constant increase of sequencing throughput offered by single-molecule sequencing technology provides the unprecedented resolution promising to increase number of discovered rare haplotypes.
The ability to accurately determine the genomic composition of the viral populations and identify closely related viral genomes makes our tool applicable for dissecting evolutionary trajectories and examining mutation interactions in RNA viruses. Evolutionary trajectories and mutation interactions have been shown to play an important role in viral evolution, such as drug resistance (Beerenwinkel et al., 2002; Wang et al., 2007; Bushman et al., 2008; Margeridon-Thermet et al., 2009), immune escape (Goepfert et al., 2008), and cross-species adaptation (Herfst et al., 2012; Imai et al., 2012). An unbiased and accurate understanding of the genomic composition of the RNA viruses opens a new avenue to study the underlying mechanism of adaptation, persistence, and virulence factors of the pathogen, which are yet to be comprehended.
While viral quasispecies reconstruction is used as a proof-of-concept in this study, the application of 2SNV can be extended to detect haplotype variants in any sample with high genetic heterogeneity and diversity, such as B cell and T cell receptor repertoire, cancer cell populations, and metagenomes. It is shown that monitoring B cell and T cell receptor repertoire helps investigate virus–host interaction dynamics (Wu et al., 2011; Klarenbeek et al., 2012; Miconnet, 2012; Zhu et al., 2013a,b). Furthermore, examining the genetic composition of the cancer cell populations in high sensitivity can facilitate diagnosis and treatment (Mardis and Wilson, 2009). Therefore, we anticipate that 2SNV will benefit different subfields of biomedical research in the genomic era. We also propose that 2SNV can be applied to increase the resolution of metagenomics profiling from species level to strain level. In summary, 2SNV is a widely applicable tool as a single-molecule sequencing technology being popularized.
Footnotes
Acknowledgments
We thank H. Hao for performing the PacBio sequencing at Johns Hopkins Deep Sequencing & Microarray Core Facility. A.A. was supported by GSU Molecular Basis of Disease Fellowship. A.A. and A.Z. were supported by NSF grants 1619110 and 1564899. S.M. and E.E were supported by NSF grants 0513612, 0731455, 0729049, 0916676, 1065276, 1302448, 1320589, and 1331176, and NIH grants K25-HL080079, U01-DA024417, P01-HL30568, P01-HL28481, R01-GM083198, R01-ES021801, R01-MH101782, and R01-ES022282. E.E. is supported, in part, by the NIH BD2K award, U54EB020403. S.M. was supported, in part, by the Institute for Quantitative & Computational Biosciences Fellowship, UCLA.
Author Disclosure Statement
No competing financial interests exist.