
Abstract
Abstract
Inference of intra-tumor heterogeneity can provide valuable insight into cancer evolution. Somatic mutations detected by sequencing can help estimate the purity of a tumor sample and reconstruct its subclonal composition. Although several methods have been developed to infer intra-tumor heterogeneity, the majority of these tools rely on variant allele frequencies as estimated via ultra-deep sequencing from multiple samples of the same tumor. In practice, obtaining sequencing data from a large number of samples per patient is only feasible in a few cancer types such as liquid tumors, or in rare cases involving solid tumors selected for research. We introduce CTPsingle, which aims at inferring the subclonal composition by using low-coverage sequencing data from a single tumor sample. We show that CTPsingle is able to infer the purity and the clonality of single-sample tumors with high accuracy, even restricted to a coverage depth of ∼30 × .
1. Introduction
I
Recently, we developed a tool named CITUP to tackle this problem in the existence of multiple samples from the same tumor. Using simulations and real data, we showed that CITUP is able to reconstruct the tumor phylogeny when supplied with deep sequencing data on multiple samples from a single patient (Malikic et al., 2015). Although targeted deep sequencing and high-coverage exome sequencing are feasible alternatives to whole-genome sequencing, obtaining multiple samples from solid tumors is a challenge in most clinical settings.
In fact, the majority of the tumor cohort currently analyzed by PCAWG (Weinstein et al., 2013) have single-sample, low-to-medium coverage sequencing data. Unfortunately, for CITUP and similar tools that exploit multiple samples to infer clonality, the ability to robustly determine the subclonal architecture of tumors deteriorates with the decreasing number of samples per tumor (Malikic et al., 2015). To overcome this challenge and improve the purity and subclonal composition estimation in single-sample tumors, we introduce a new tool named CTPsingle that is specifically designed to work with low-coverage sequencing data from a single sample.
CTPsingle features a robust clustering framework based on a beta-binomial mixture model and infers possible phylogenies by using a fast mixed integer linear programming (mILP) formulation. Currently, CTPsingle is also used to infer clonality as a part of the Tumor Evolution and Heterogeneity working group of PCAWG (Weinstein et al., 2013). The core functionality of CTPsingle is implemented in R by using open-source packages DPpackage (Jara et al., 2011) and lpSolve (Buttrey, 2005). CTPsingle is freely available from https://github.com/sfu-compbio/ctpsingle
1.1. Related work
CTPsingle is partially based on CITUP, which uses a mixed Quadratic Integer Programming (mQIP) framework. Like CITUP, CTPsingle works on somatic single nucleotide variants (sSNVs) on copy neutral regions of the genome. However, unlike CITUP, which takes variant allele frequencies (VAFs) as input, CTPsingle takes reference and variant read counts as input and clusters sSNVs by using a beta-binomial mixture model. This allows CTPsingle to infer the number of subclones in advance of phylogeny search and account for the higher noise in VAFs associated with low coverage. In addition, CTPsingle employs a simplified, iterative mILP formulation that is implemented by using the freely available lpSolve library (Buttrey, 2005) and does not rely on any commercial libraries such as IBM CPLEX™.
CTPsingle is also related to TrAp (Strino et al., 2013), PhyloSub (Jiao et al., 2014), rec-BTP (Hajirasouliha et al., 2014), Clomial (Zare et al., 2014), BayClone (Sengupta et al., 2015), PyClone (Roth et al., 2014), LICHeE (Popic et al., 2015), and AncesTree (El-Kebir et al., 2015). The majority of these methods are designed to work with SNVs in copy neutral regions and are developed specifically for multiple samples, whereas a few of them can also work with single-sample datasets. Other relevant tools such as THetA2 (Oesper et al., 2014), TITAN (Ha et al., 2014), CLONET (Prandi et al., 2014), and PhyloWGS (Deshwar et al., 2015) are designed to work on copy number data, although some of them allow the use of an additional type of mutation calls.
Although rec-BTP is also exclusively designed for single-sample tumors, we had previously shown that this method has inferior performance compared with CITUP even on single-sample datasets (Malikic et al., 2015). Moreover, this tool does not report which mutations are assigned to which subclones, prohibiting us from calculating some of the evaluation measures we use in this article. Instead, we compare CTPsingle with AncesTree, LICHeE, and PyClone, which can also take single-sample data as input. AncesTree has an integer linear programming framework where it formulates the problem of clonality inference as a variant allele factorization problem (El-Kebir et al., 2015). LICHeE works by constructing an evolutionary constraint network and finding the best scoring spanning trees (Popic et al., 2015). Although PyClone does not attempt to infer tree topologies, it has a similar clustering framework to CTPsingle that is based on a Dirichlet process (Roth et al., 2014). We show that CTPsingle outperforms these methods, even when they are supplied with more than one sample per tumor. In addition, we compare CTPsingle with CITUP and demonstrate that CTPsingle performs better than CITUP in low-coverage datasets.
2. Methods
2.1. Input processing
As input, CTPsingle takes reference and variant read counts for single nucleotide variant (SNV) calls. These calls can be obtained from whole-genome, whole-exome, or targeted sequencing data. CTPsingle expects only somatic SNVs in its input; all germline mutations should be discarded in advance. CTPsingle also expects the mutations to reside in copy number neutral regions. In other words, CTPsingle assumes all mutations to be heterozygous in diploid regions, although mutations on nonautosomal (i.e., X and Y) chromosomes can be included if the gender of the patient is given. Tri-allelic mutations should also be discarded from the input.
2.2. Robust clustering using beta-binomial mixture modeling
The clustering of mutations is performed via a beta-binomial model in CTPsingle. Suppose we have M mutations in a tumor sample. Let yi denote the number of variant read counts for mutation i and ni denote the number of total reads covering the same position (i.e., reference + variant reads). The following assumes that yi is binomial distributed with an unknown (i.e., variable) probability of success pi:
We further assume that the probability parameter pi is generated from a Dirichlet Process (DP) as given next:
The concentration parameter
Since the prior beta distribution is conjugate to the binomial distribution, resulting in a beta-binomial posterior, inference can be performed by using a standard Markov Chain Monte Carlo (MCMC) method (MacEachern, 1998).
The model parameters
2.2.1. Mutations on haploid regions
Since clustering is performed in read count space rather than in cellular prevalence space, read counts for trivially homozygous mutations (such as those in X and Y chromosomes in men) should be properly adjusted. In CTPsingle, this is done by adjusting the total read count of the position. Let vi and ri denote the variant and reference read counts, respectively, for mutation i. Suppose ti is the copy count of the region containing mutation i in the tumor sample and hi is the copy count of that region in the normal sample. Then, ni is set to be:
In essence, this formulation mimics “phantom” chromosomes that emit reads containing the reference allele whenever appropriate and can be applied to clonal single copy deletions in addition to nonautosomal chromosomes. Finally,
2.3. Estimation of tumor purity and phylogeny inference
From the clustering stage, we obtain the number k of subclones (i.e., clusters) and the mean allelic frequency sj for each subclone
Similar to CITUP, CTPsingle considers all tree topologies. An mILP formulation is applied to each tree topology independently to find the optimal assignment of the clusters subject to phylogenetic constraints. As the number of clusters k is determined in advance, CTPsingle only processes those trees with k nodes. The detailed mILP formulation is described in Supplementary Appendix SA1.
3. Results
3.1. Simulations
To evaluate CTPsingle in a controlled environment and compare its performance with AncesTree, LICHeE, and PyClone, we performed two sets of simulations: (1) with low coverage (∼32 × ) as routinely observed in whole-genome sequencing experiments; and (2) with ultra-high coverage (∼2800 × ) as typically obtained from deep sequencing experiments. As the other methods are primarily intended for multi-sample datasets, for each coverage depth, we also generate two sets of simulations: (a) with a single sample per tumor; and (b) with two samples per tumor. Although CTPsingle cannot exploit the additional information that can be obtained from the second sample, our results demonstrate that it achieves better results in all four experiment settings. For each experiment setting, we simulate 50 instances. The rest of the simulation details are given in Supplementary Appendix SA2.
We compare the performance of the tools by using three measures: (i) estimated tumor purity; (ii) number of subclones predicted; and (iii) root mean square error (RMSE) of CCFs.
The RMSE measure is calculated by using the CCFs of mutations reported by each method as follows. Let
where S represents the set of mutations reported by the tool. The CCFs for each tool is computed by using the subclonal frequencies reported by the tool and adjusted by the tumor purity estimated in the same way as is done in CTPsingle. We note that both AncesTree and LICHeE discard a small number of mutations in some cases, possibly giving them an unfair advantage in the calculation of RMSE. CTPsingle and PyClone report all mutations. The calculation of tumor purity, number and frequency of the subclones, and the running parameters for the tools are described in Supplementary Appendix SA2.
Figure 1 shows the comparison of the true versus predicted tumor purities for each experiment. As can be seen from the plots, CTPsingle outperforms other methods in all experiments. For the low-coverage datasets, both AncesTree and LICHeE tend to underestimate the purity, although AncesTree also calls near 1.0 purity in some cases. The purity estimates are significantly improved for AncesTree in the case of deep coverage, whereas LICHeE estimates show little difference for deep coverage. This is probably due to the fact that this method directly works with VAFs; hence, it cannot distinguish between high- and low-coverage data. In contrast, CTPsingle estimates purity with almost 100% accuracy in the deep-coverage samples. The two outliers in the case of the multi-sample deep-coverage experiment belong to the same tumor instance, and it is due to the fact that this tumor contains a subclone consisting of only two mutations. We also note that PyClone appears to report a purity greater than 1.0 for some samples. This is because this tool reports allelic frequencies rather than cellular frequencies. Thus, we multiply the frequencies reported by PyClone by a factor of 2 to calculate the purity estimated by this tool. However, for some samples, the original frequencies seem to be closer to the true purity. Nevertheless, we choose to keep this practice, as it improves the overall correlation between the predicted and true purities for this tool, especially for the low-coverage samples. In addition, this problem does not affect the RMSE evaluation, as CCFs are already normalized (i.e., the highest CCF will always be 1.0).
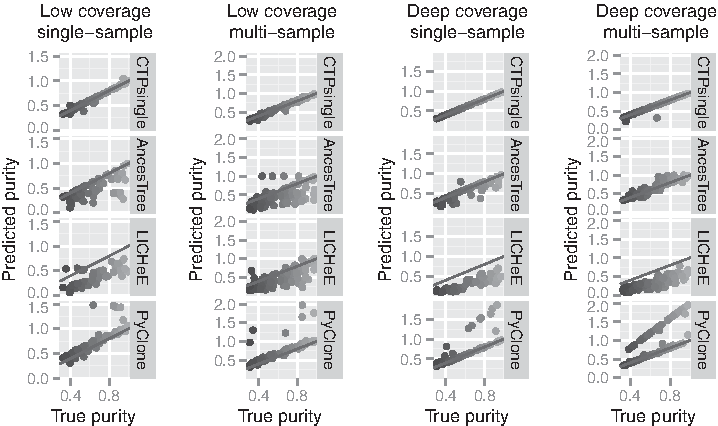
Comparison of true versus predicted tumor purity across the simulation experiments. Each dot represents a distinct sample and is colored based on its real tumor purity. The red lines illustrate the
Figure 2 shows the distribution of #subclones error for each method across the experiments. #subclones error is simply calculated as the absolute difference between the predicted number of subclones versus the true number of subclones. Once again, the plots show that CTPsingle outperforms the other methods in all experiment settings. In deep-coverage datasets, CTPsingle correctly estimates the number of subclones in all but a few cases.
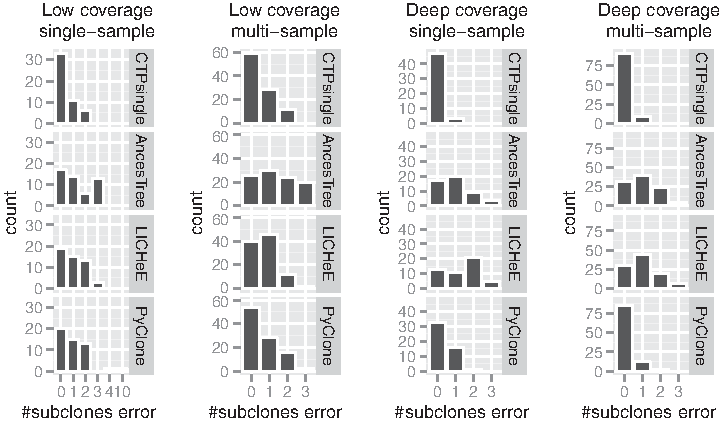
Comparison of the absolute difference between the true and the predicted number of subclones across the simulation experiments. The single-sample experiments contain 50 samples, and the multi-sample experiments contain a total of 100 (
The histogram of the RMSE values for each sample is shown in Figure 3. In the low-coverage datasets, RMSE values are typically below 0.3 for CTPsingle, whereas this measure can range up to 0.8 for AncesTree and LICHeE. Note that the samples with low RMSE often represent the cases where the number of subclones are correctly identified, although RMSE can also be low if two subclones with very similar frequencies are merged into one cluster. Hence, this measure penalizes methods that tend to merge subclones with very different frequencies. For the deep-coverage datasets, CTPsingle has less than 0.1 RMSE.

The histogram of RMSE values across the simulation experiments. For each sample, RMSE is calculated between the true CCF of mutations and the predicted CCF based on the subclone assignments reported by the method. The bin size for the histogram is set to 0.1 for each plot. The single-sample experiments contain 50 samples, and the multi-sample experiments contain a total of 100 (
We also compare CTPsingle with CITUP on the same simulation datasets. To save computation time, we run CITUP only on trees with the correct number of nodes. Despite this advantage, we observe that CTPsingle performs better than CITUP on the low-coverage datasets, although the performance of the two methods is very similar on the deep-coverage datasets (Supplementary Fig. S3; Supplementary Appendix SA2).
In terms of running time, we observe that LICHeE is the fastest tool and is typically completed within a couple of minutes on our simulation datasets. Although CTPsingle is slower than LICHeE, it completed all but a few samples within 30 minutes and did not exceed 1 hour on any sample. In contrast, AncesTree and PyClone took several hours on many samples.
3.2. CTPsingle identifies subclonal populations in prostate tumors
To illustrate the possible use of CTPsingle in a real clinical setting, we also report the results of CTPsingle on two prostate tumors processed in-house. Clinical details of these tumors are given in Table 1. For each patient, fresh frozen (FF) and formalin-fixed paraffin-embedded (FFPE) tissue taken at the time of radical prostatectomy were subjected to whole-exome sequencing. Since blood samples were not available for these patients, we also obtained whole-exome sequencing data from adjacent benign tissue. Sequencing and mutation calling details are given in Supplementary Appendix SA3. Full clinical details and genomic analysis for these tumours will be described elsewhere.
Coverage is calculated as the mean total read depth of called mutations. The percentage of the genome under copy number alterations (% CNA) is calculated based on the whole-exome sequencing on the fresh frozen sample for each patient. Purity denotes the estimated tumor purity by CTPsingle. Next, the Gleason score and PSA levels are given as measured at diagnosis.
CAN, copy number alteration; FFPE, formalin-fixed paraffin embedded; PSA, prostate-specific antigen; sSNV, somatic single nucleotide variants.
The percentage of the genome with copy number alterations (CNAs), the number of somatic SNVs, and the tumor purity estimated by CTPsingle for each patient are given in Table 1. We remark that due to the high degradation level of FFPE samples, less somatic mutations are detected compared with FF samples. In addition, we determine the CNAs—thus copy number neutral regions—using the FF samples only, since the copy number segmentations obtained from FFPE samples tend to be noisier.
Despite the difficulty of calling mutations from highly degraded FFPE tissues, we observed a reasonable consistency between the predictions in FF and FFPE samples from the same patient. We also remark that confidently calling somatic mutations is particularly challenging in this dataset due to a lack of pure normal sample obtained from blood. Since adjacent benign tissue can be contaminated with cancer cells, less stringent criteria have to be employed while calling mutations, resulting in a higher number of false positives in addition to false negatives.
Figure 4 illustrates the subclonal composition of each sample as predicted by CTPsingle. Although the number of inferred subclones and their frequencies differ between FF and FFPE samples, the figure shows that the order of the mutations is conserved as expected. Note that, although branching tree topologies are also possible in these samples, these cannot be confidently determined without additional samples or information. Therefore, we only report the linear expansion topologies.

Subclonal composition of two prostate tumors using fresh frozen and FFPE samples as predicted by CTPsingle. Known cancer-related genes containing nonsynonymous coding mutations are shown next to nodes based on their subclonal assignments. The numbers in parentheses give the total number of mutations assigned to each node, including synonymous mutations. The PTEN mutations in the FF and FFPE samples of DP1566 represent distinct mutations. The rest of the mutations are identical between FF and FFPE in both patients. FFPE, formalin-fixed paraffin embedded.
In the FF sample of patient DP1566, we see that a TP53 mutation is placed at the starting clone, whereas a PTEN mutation is placed at a secondary level. In the FFPE sample, in addition to the same TP53 mutation, a distinct PTEN mutation is also placed at the top level, suggesting a convergent evolution in these two samples.
In patient DP1570, a TP53 mutation is placed at the secondary level in both FF and FFPE samples. Interestingly, for this patient, CTPsingle predicts an ARID1B mutation at the top level. ARID1B is a protein coding gene involved in transcriptional regulation of select genes by chromatin remodeling, and it has been previously implicated in pancreatic cancer (Khursheed et al., 2013). This patient also contains a high-impact KDM5A mutation that results in a stop codon loss. KDM5A is a histone demethylase that specifically demethylates Lys-4 of histone H3 and is known to interact with many other proteins, including retinoblastoma (Klose et al., 2007). Although this mutation is only detected in the FFPE sample, this may be due to the very low tumor purity of the FF sample for this patient. An alternative explanation could be that this mutation is contained by a private subclone that is only present in the FFPE sample.
It is intriguing that this patient contains predicted mutations in two separate genes related to chromatin regulation. As chromatin remodeling is crucially involved in the fine-tuning of cell growth, DNA repair, and chromosome segregation, mutations in these genes may act as cancer drivers. Indeed, a comparison of the epigenetic profiles of the tumor samples to that of the adjacent benign samples, as assayed by ChiP-on-ChiP or ChiP-Seq experiments, could provide valuable insight into the progression of this patient's cancer. Validating these mutations and investigating the epigenetic profile of this tumor is part of our plans as future work.
4. Conclusion
In this work, we introduce CTPsingle as a robust alternative to existing clonality inference methods in cases where obtaining multi-sample sequencing from tumors is unfeasible. Using realistic simulations, we show that CTPsingle achieves satisfactory results on single-sample datasets even with low sequencing depths and is able to reconstruct the subclonal composition of tumors with high accuracy on deep sequencing data. Our preliminary results on two prostate tumors also suggest that CTPsingle can help identify the presence of subclones on real exome sequencing data.
Although our simulations include a wide range of parameters such as varying tumor purity and number of mutations (including highly disproportionate number of mutations and CCFs per subclone, Supplementary Fig. S2; Supplementary Appendix SA2), we acknowledge that real clinical datasets have additional challenges such as DNA degradation and sequencing errors. However, some of these challenges can be mitigated by careful post-processing of sequencing data and are typically taken into account by state-of-the-art mutation calling software. Furthermore, we observe that CTPsingle is still able to accurately infer the subclonal composition of tumors in the presence of a small fraction of false-positive SNVs (Supplementary Fig. S4; Supplementary Appendix SA4). Nevertheless, we acknowledge that a larger cohort with experimental validation is necessary to further demonstrate CTPsingle's performance in a clinical setting.
Like several other tools, CTPsingle is limited to somatic SNVs in copy-neutral regions and, hence, is not applicable to tumors with high chromosome instability. On the other hand, our experiments suggest that its performance does not deteriorate significantly on moderately copy-number altered genomes (Supplementary Fig. S4; Supplementary Appendix SA4). Nonetheless, we are currently working to extend our methods to include CNAs and hoping to release a comprehensive tool that is applicable to all tumors in the near future.
Footnotes
Acknowledgments
This project was funded by a Prostate Cancer Canada Movember Team grant and the Terry Fox Research Institute New Frontiers Program to C.C.C.; NSERC Discovery Frontiers Grant on the Cancer Genome Collaboratory, Genome Canada Bioinformatics and Computational Biology Program Grant and NSERC Discovery Grant to S.C.S.; and NSERC CREATE (139277) fellowship and Vanier Canada Graduate Scholarship to S.M.
Author Disclosure Statement
No competing financial interests exist.
References
Supplementary Material
Please find the following supplemental material available below.
For Open Access articles published under a Creative Commons License, all supplemental material carries the same license as the article it is associated with.
For non-Open Access articles published, all supplemental material carries a non-exclusive license, and permission requests for re-use of supplemental material or any part of supplemental material shall be sent directly to the copyright owner as specified in the copyright notice associated with the article.