
Abstract
Abstract
Owing to wide application of RNA sequencing (RNA-seq) technology, more and more eukaryotic genomes have been extensively annotated, such as the gene structure, alternative splicing, and noncoding loci. Annotation information of genome is prevalently stored as plain text in General Feature Format (GFF), which could be hundreds or thousands Mb in size. Therefore, it is a challenge for manipulating GFF file for biologists who have no bioinformatic skill. In this study, we provide a web server (GFFview) for parsing the annotation information of eukaryotic genome and then generating statistical description of six indices for visualization. GFFview is very useful for investigating quality and difference of the de novo assembled transcriptome in RNA-seq studies.
1. Introduction
O
For a representative eukaryote species, genome sequence would be more than 1500 Mb in size and is associated with a large amount of annotation information (Huang et al., 2016). To efficiently store and share such enormous information, therefore, a standard General Feature Format (GFF) was proposed and designed as tab-delimited text file (http://gmod.org/wiki/GFF3), which contains both mandatory and optional fields. The GFF has been widely used by not only the popular public databases (Derrien et al., 2012; Yates et al., 2016) but also a large number of bioinformatic tools (Li and Dewey, 2011). Despite this, GFF file would be very large in size, and for which it is difficult to manipulate by biologists who have no bioinformatic skill. For example, the plain text file in GFF for recording annotation information of human genome is 1343 Mbp in size and has 2,575,499 line records in total for current release of Ensembl (Yates et al., 2016). In addition to GFF, the Gene Transfer Format (GTF) is also a similar but more specific format for recording information in relation to gene structure. However, there is no essential difference between GFF and GTF, both of which could be transformed from each other. In this study, we develop a web server for parsing and visualizing annotation information of eukaryotic genome as being stored in GFF or GTF, which could be easily used for schematically generating whole-transcriptome landscape.
2. Design and Implementation of GFFview
2.1. Parsing of GFF or GTF file
The initial step of GFFview is to parse annotation information of genome in GFF or GTF (Fig. 1A). First, we extract all features with biological types as being labeled as gene, transcript/messenger RNA, exon, or UTR (Untranslated Regions). Second, chromosomal locations for each feature are individually determined. Finally, different annotation information, such as the gene structure and isoforms, could be fully constructed on the basis of these recorded locations. Because we ignore other features of genome annotation such as CDS (Coding Sequence), start code, and end code, the computational memory usage would be largely reduced.
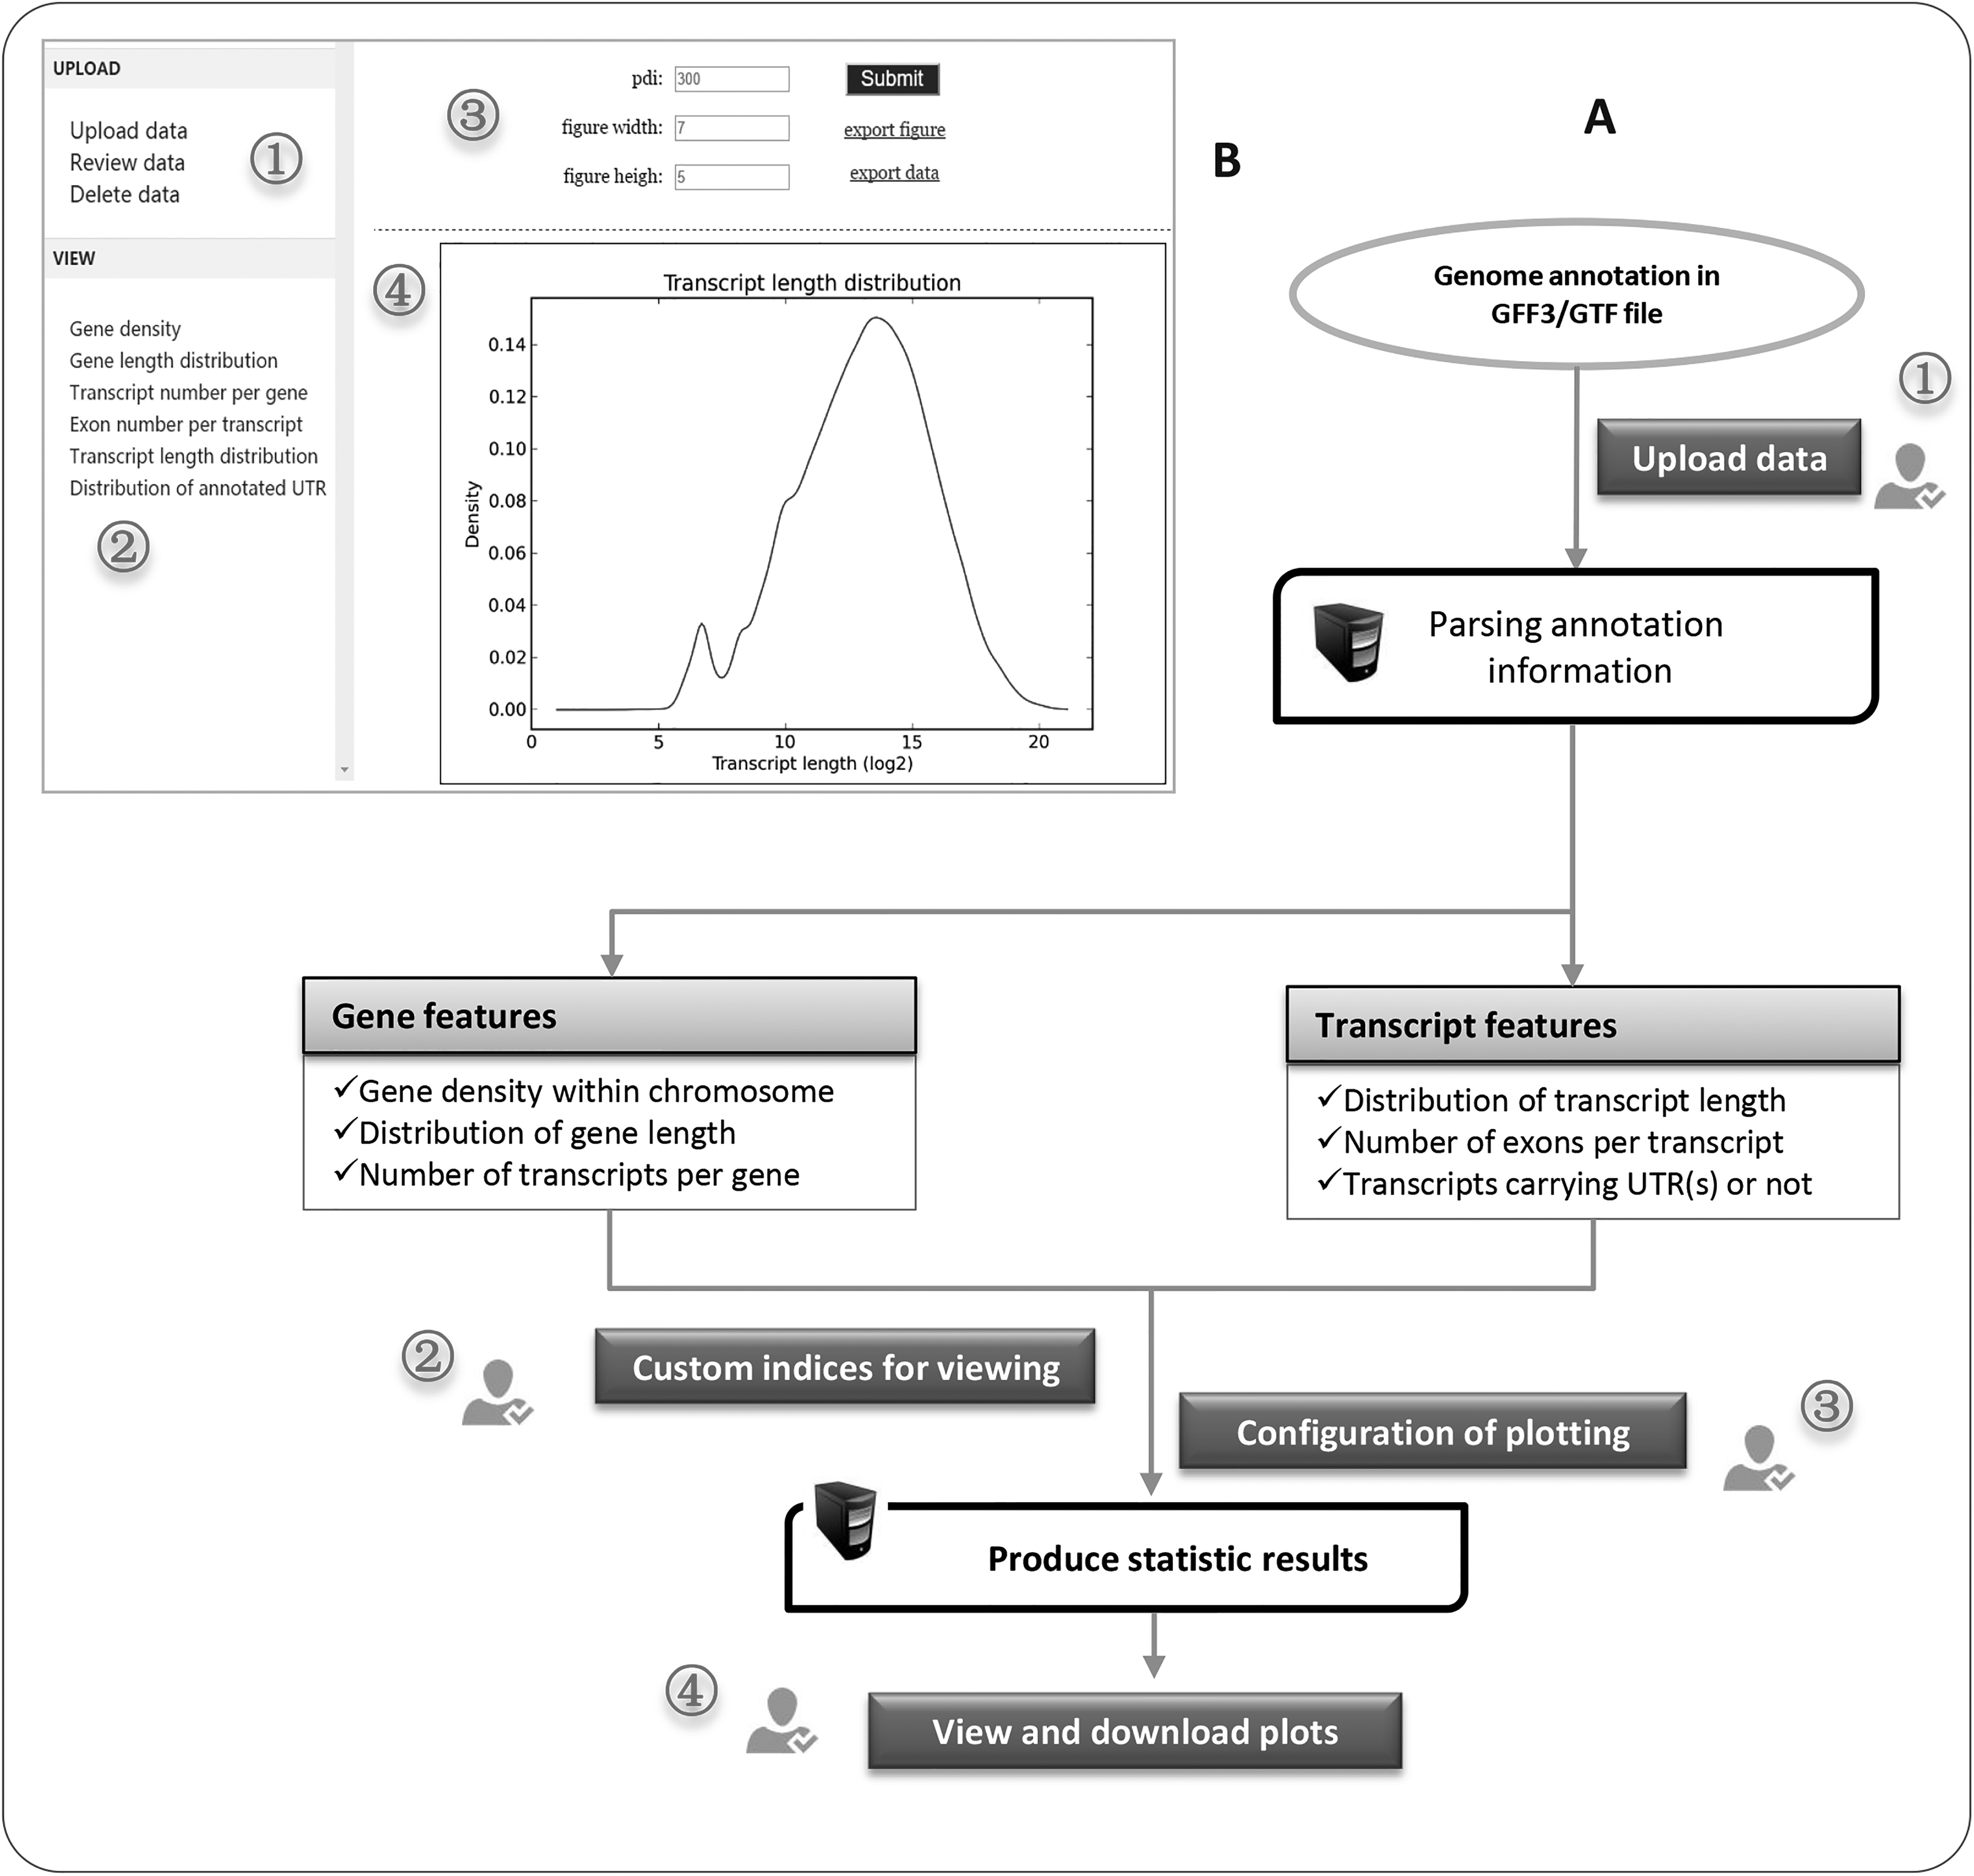
Schematic view of GFFview workflow.
2.2. Statistical description and visualization
After getting the parsed metadata, we herein produce six descriptive indices, such as (1) density of the annotated gene within chromosome, (2) distribution of gene length, (3) number of transcripts per gene, (4) distribution of transcript length, (5) number of exons per transcript, and (6) number of transcripts that have already been annotated for UTR(s) or not. For these statistical results, appropriate statistical graphics, such as bar, pie, histogram, line, and circos, were adopted for visualizing them. To guarantee flexible application, of course, the metadata for each analyzed index could be directly retrieved with or without visualization.
2.3. Data submitting and management
In addition to raw GFF/GTF file, GFFview also accepts the compressed format with suffix of “.tar.gz” to facilitate data uploading. The first submitted data will be temporarily retained for 1 week and assigned a unique ID, for which a user could easily reanalyze these data without redundant submission. Of course, the user could also absolutely delete the uploaded data.
2.4. Implementation of GFFview
GFFview is implemented as a web application because of free installation and easy use (Fig. 1B). The backend service of GFFview is written using Python program language, during which the matplotlib (Hunter et al., 2014), a popular Python 2D plotting library, was employed for drawing statistical graphics. In addition, circos (Krzywinski et al., 2009) was used to generate a graph that shows gene density within chromosomes. To provide a reliable web server, all codes and the required Python libraries were distributed on cloud server.
3. Result and Discusion
We prepared a demo data containing complete annotation information of human chromosomes in GTF, which totally has 1,713,977 line records (Yates et al., 2016). Six indices were generated with GFFview and individually shown in Figure 2. Based on these results, we can easily obtain overall landscape at the whole-transcriptome level, which would be very useful when checking quality and difference of the de novo assembled transcriptome in RNA-seq studies.

GFFview images showing profile of human genome annotation in GTF file. We demonstrated the gene density within each chromosome
In contrast to the existing softwares such as Integrative Genomics Viewer (Thorvaldsdóttir et al., 2013) and gff2ps (Abril and Guigó, 2000), which tend to focus on structural details of specific gene, GFFview was developed to provide an overall view for describing annotation information of genome. Of course, functions provided by GFFview could be implemented with R package and Python library. However, the web-based application of GFFview would largely facilitate use by biologists. One potential issue for using GFFview is that the data need to be uploaded, which would be a time-consuming and expensive task when the file is considerable in size. Furthermore, a user can delete the uploaded file thoroughly or completely, the web server will not store any data in private.
Footnotes
Acknowledgments
This work was financially supported by Science and Technology Department of Sichuan Province (Grant No. 2016NYZ0046) and Earmarked Fund for China Agriculture Research System (Grant No. CARS-44-A-2).
Author Disclosure Statement
The authors declare that no competing financial interests exist.