
Abstract
Abstract
Breast cancer is a complex disease that can be classified into at least 10 different molecular subtypes. Appropriate diagnosis of specific subtypes is critical for ensuring the best possible patient treatment and response to therapy. Current computational methods for determining the subtypes are based on identifying differentially expressed genes (i.e., biomarkers) that can best discriminate the subtypes. Such approaches, however, are known to be unreliable since they yield different biomarker sets when applied to data sets from different studies. Gathering knowledge about the functional relationship among genes will identify “network biomarkers” that will enrich the criteria for biomarker selection. Cancer network biomarkers are subnetworks of functionally related genes that “work in concert” to perform functions associated with a tumorigenic. We propose a machine learning framework that can be used to identify network biomarkers and driver genes for each specific breast cancer subtype. Our results show that the resulting network biomarkers can separate one subtype from the others with very high accuracy.
1. Introduction
B
In this study, we propose a machine learning framework that can be used to identify differential NBs specific to each BC subtype. First, we select and combine relevant features using CNV, copy number aberration (CNA), and GE data, to obtain a set of candidate genes for each BC subtype consisting of (1) genes that are differentially expressed in the subtype and (2) genes that have significant copy numbers in the subtype. Then, each gene in the candidate set is used to seed the search for discriminative NBs in an input protein–protein interaction (PPI) network. We have devised different methods for identifying NBs that best separate each subtype.
2. Methods
We have used the METABRIC data set (Curtis et al., 2012), which contains the copy number values and GE levels of 2000 primary breast tumors with long-term clinical follow-up. It can be accessed from the European Genome-Phenome Archive using the accession number EGAS00000000083. In Curtis et al. (2012), the CNAs and CNVs generated using Affymetrix SNP 6.0 arrays and GE data were obtained using Illumina HT 12 technology. The data set contains two sets of data, validation set and discovery set. Due to the lack of class labels in the validation set, in this paper. We only use the discovery set, which contains 997 samples from 10 subtypes of BC. Each sample contains expression data for 48,803 probe IDs. The expression of all probes corresponding to the same gene has been merged based on the median expression of those probes, which maps all the probes to 24,351 unigenes. The number of samples corresponding to each subtype is listed in Table 1.
To obtain an NB corresponding to each subtype, we consider each subtype as positive class and the remaining subtypes as negative class. Thus, by performing a one-against-all classification scheme, separately for each subtype, we can obtain the specific NB that best discriminates that subtype from the other subtypes. Figure 1 illustrates the proposed framework for finding NBs corresponding to each subtype.

The proposed framework for finding NBs corresponding to each subtype. CAN, ; CNV, copy number variation; GE, gene expression; NBs, network biomarkers; PPI, protein–protein interaction.
2.1. Obtaining candidate genes
In the first step, we use CNA, CNV, and GE data to find the most informative genes, separately for each subtype, which are used later as seeds to find the best separating NBs of a given subtype. To do so, we first use CNA/CNV information to find those genes that have very high genotypic aberration in each subtype based on their GISTIC score (Beroukhim et al., 2007). GISTIC identifies significant aberrations using two steps. In the first step, it calculates the G-score statistic, which involves both the frequency of occurrence and the amplitude of the aberration. In the second step, it assesses the significance of each aberration using Fisher's exact test (Raymond and Rousset, 1995). To make sure that we only target aberrations in the copy number and not common variations across different populations, we use the HapMap database (Consortium et al., 2010). HapMap is a catalog of common genetic variants that occur in human. We only consider those genes for a significant test that have CNA but no CNV. We also use GE data to identify the top differentially expressed genes for each subtype. For this, we used Chi2 (Liu and Setiono, 1995) to rank genes based on their ability to separate each subtype from the remaining subtypes. At the end, after obtaining the top genes using CNA/CNV and GE data separately, if CNA/CNV analysis determined N genes as significant in terms of their genomic aberrations, we select the top N genes from GE data; then out of these two gene sets, we take the intersection as candidate genes, which will be used as seeds in our PPI network data.
2.2. Obtaining NB for each subtype
In this step, we use the candidate genes obtained from the previous step as seeds in the PPI network data. First, we combined the human PPI network data obtained from BioGrid (Stark et al., 2011), HPRD (Prasad et al., 2009), Intact (Kerrien et al., 2012), DIP (Xenarios et al., 2002) and MINT (Ceol et al., 2010) into a single unified large PPI network consisting of 230,000 PPIs and 15,823 proteins as the union of all aforementioned databases.
Second, we mapped all candidate genes onto our PPI network to be used as seeds for finding the NBs. Starting from a given seed node v, the search for the best separating NB proceeds as follows. We iteratively aggregate its neighboring nodes u in a greedy manner, using breath-first search algorithm. A neighbor u is inserted into the current aggregate N if and only if its inclusion (i.e., the new aggregate
Since the order of candidate genes may alter the expansion of subnetworks, depending on which candidate gene reaches a certain gene first, we shuffle the candidate genes 100 times and obtain the network for each case individually. At the end, we merge all 100 networks. In this case, each individual interaction has a confidence score from 1 to 100, which represents the number of times each interaction appeared in all 100 networks. We categorize interactions in three groups, low, medium, and high confidence, which contain those interactions that present in less than 30%, between 30% and 70%, and >70% of the networks, respectively. Table 2 shows the distribution of the interactions in each subtype NB.
Interactions have been categorized into three groups: low, medium, and high confidence, which contain interactions that are present in less than 30%, between 30% and 70%, and >70% of the networks, respectively.
2.3. Evaluating the predictive performance of each NB
The following measures are used for evaluating the predictive performance of each NB.
F-measure uses both precision and recall measures to compute the score as follows:
where
Another measure, the area under the receiving operating characteristics (ROC) curve, AUC, shows the trade-off between Specificity and Sensitivity (Recall), where
Above TP, TN, FP, FN means true positive, true negative, false positive, and false negative, respectively.
3. Results
Table 3 shows the number of selected genes and interactions in the obtained NB corresponding to each of the 10 BC subtypes. Since the classes are highly imbalanced, using a more robust performance measure such as AUC provides less bias insight regarding the performance of the NBs for each subtype. As shown in the table, the AUC of the NBs for almost all of the subtypes is >0.95, which indicates the excellent predictive performance of each NB.
We trained a random forest classifier containing 50 trees along with a 10-fold cross-validation scheme to evaluate the effectiveness of candidate and high-confidence genes involved in each subtype's NB in discriminating each subtype individually. Tables 4 and 5 show the performance of candidate genes and high-confidence genes in each subtype, respectively. As shown in the tables, although candidate genes themselves can provide an accurate gene signature for each subtype of BC, adding high-confidence genes to candidate gene sets increases the classification performance.
MCC,.
Figure 2 shows the genes with medium and high confidence in Subtype-1 NB. As shown in the figure, some of the hub genes in the subnetwork such as cyclin-dependent kinase 1 (CDK1) are known indicators in BC prognosis (Kim et al., 2008) and further investigations for determining their possible roles in Subtype-1 of BC are in progress.

The NB of Subtype-1, including medium- and high-confidence interactions.
We used IntOGen's mutational breast cancer driver genes and compared them with the genes that we identified in the NBs of each BC subtype. Table 6 shows all mutational driver genes and their overlap with NB corresponding to one of the subtypes. As shown in the table, out of 184 mutational driver genes, our model covered 125 of them as part of NBs in different BC subtypes. This is impressive since our model covered these genes without having access to any mutational data corresponding to the METABRIC data set.
We also computed the odds ratio (Scotia, 2010) of having a deletion or amplification in each candidate gene and compared their relationship to the expression of that specific gene across different subtypes. Figure 3 shows the odds ratio and GE of candidate genes for Subtype-1 of BC. Odds ratio shows how a deletion/amplification in a specific gene is likely to separate a subtype from the others; the higher the ratio, the more effective is that aberration in separating one subtype from the rest. In most of the cases, we found the CNA and GE as two independent factors, which means that having a high odds ratio for a gene does not necessarily mean that the GE pattern for that gene has totally different patterns in one subtype against the other subtypes (see Supplementary Data for odds ratio and GE of candidate genes for Subtypes-2–10).

The odds ratio and GE of candidate genes for Subtype-1.
Some of genes appeared in more than one subtype as a high-confidence gene. Figure 4 depicts these genes along with the subtypes these genes belong to. As shown in the figure, some of the genes such as
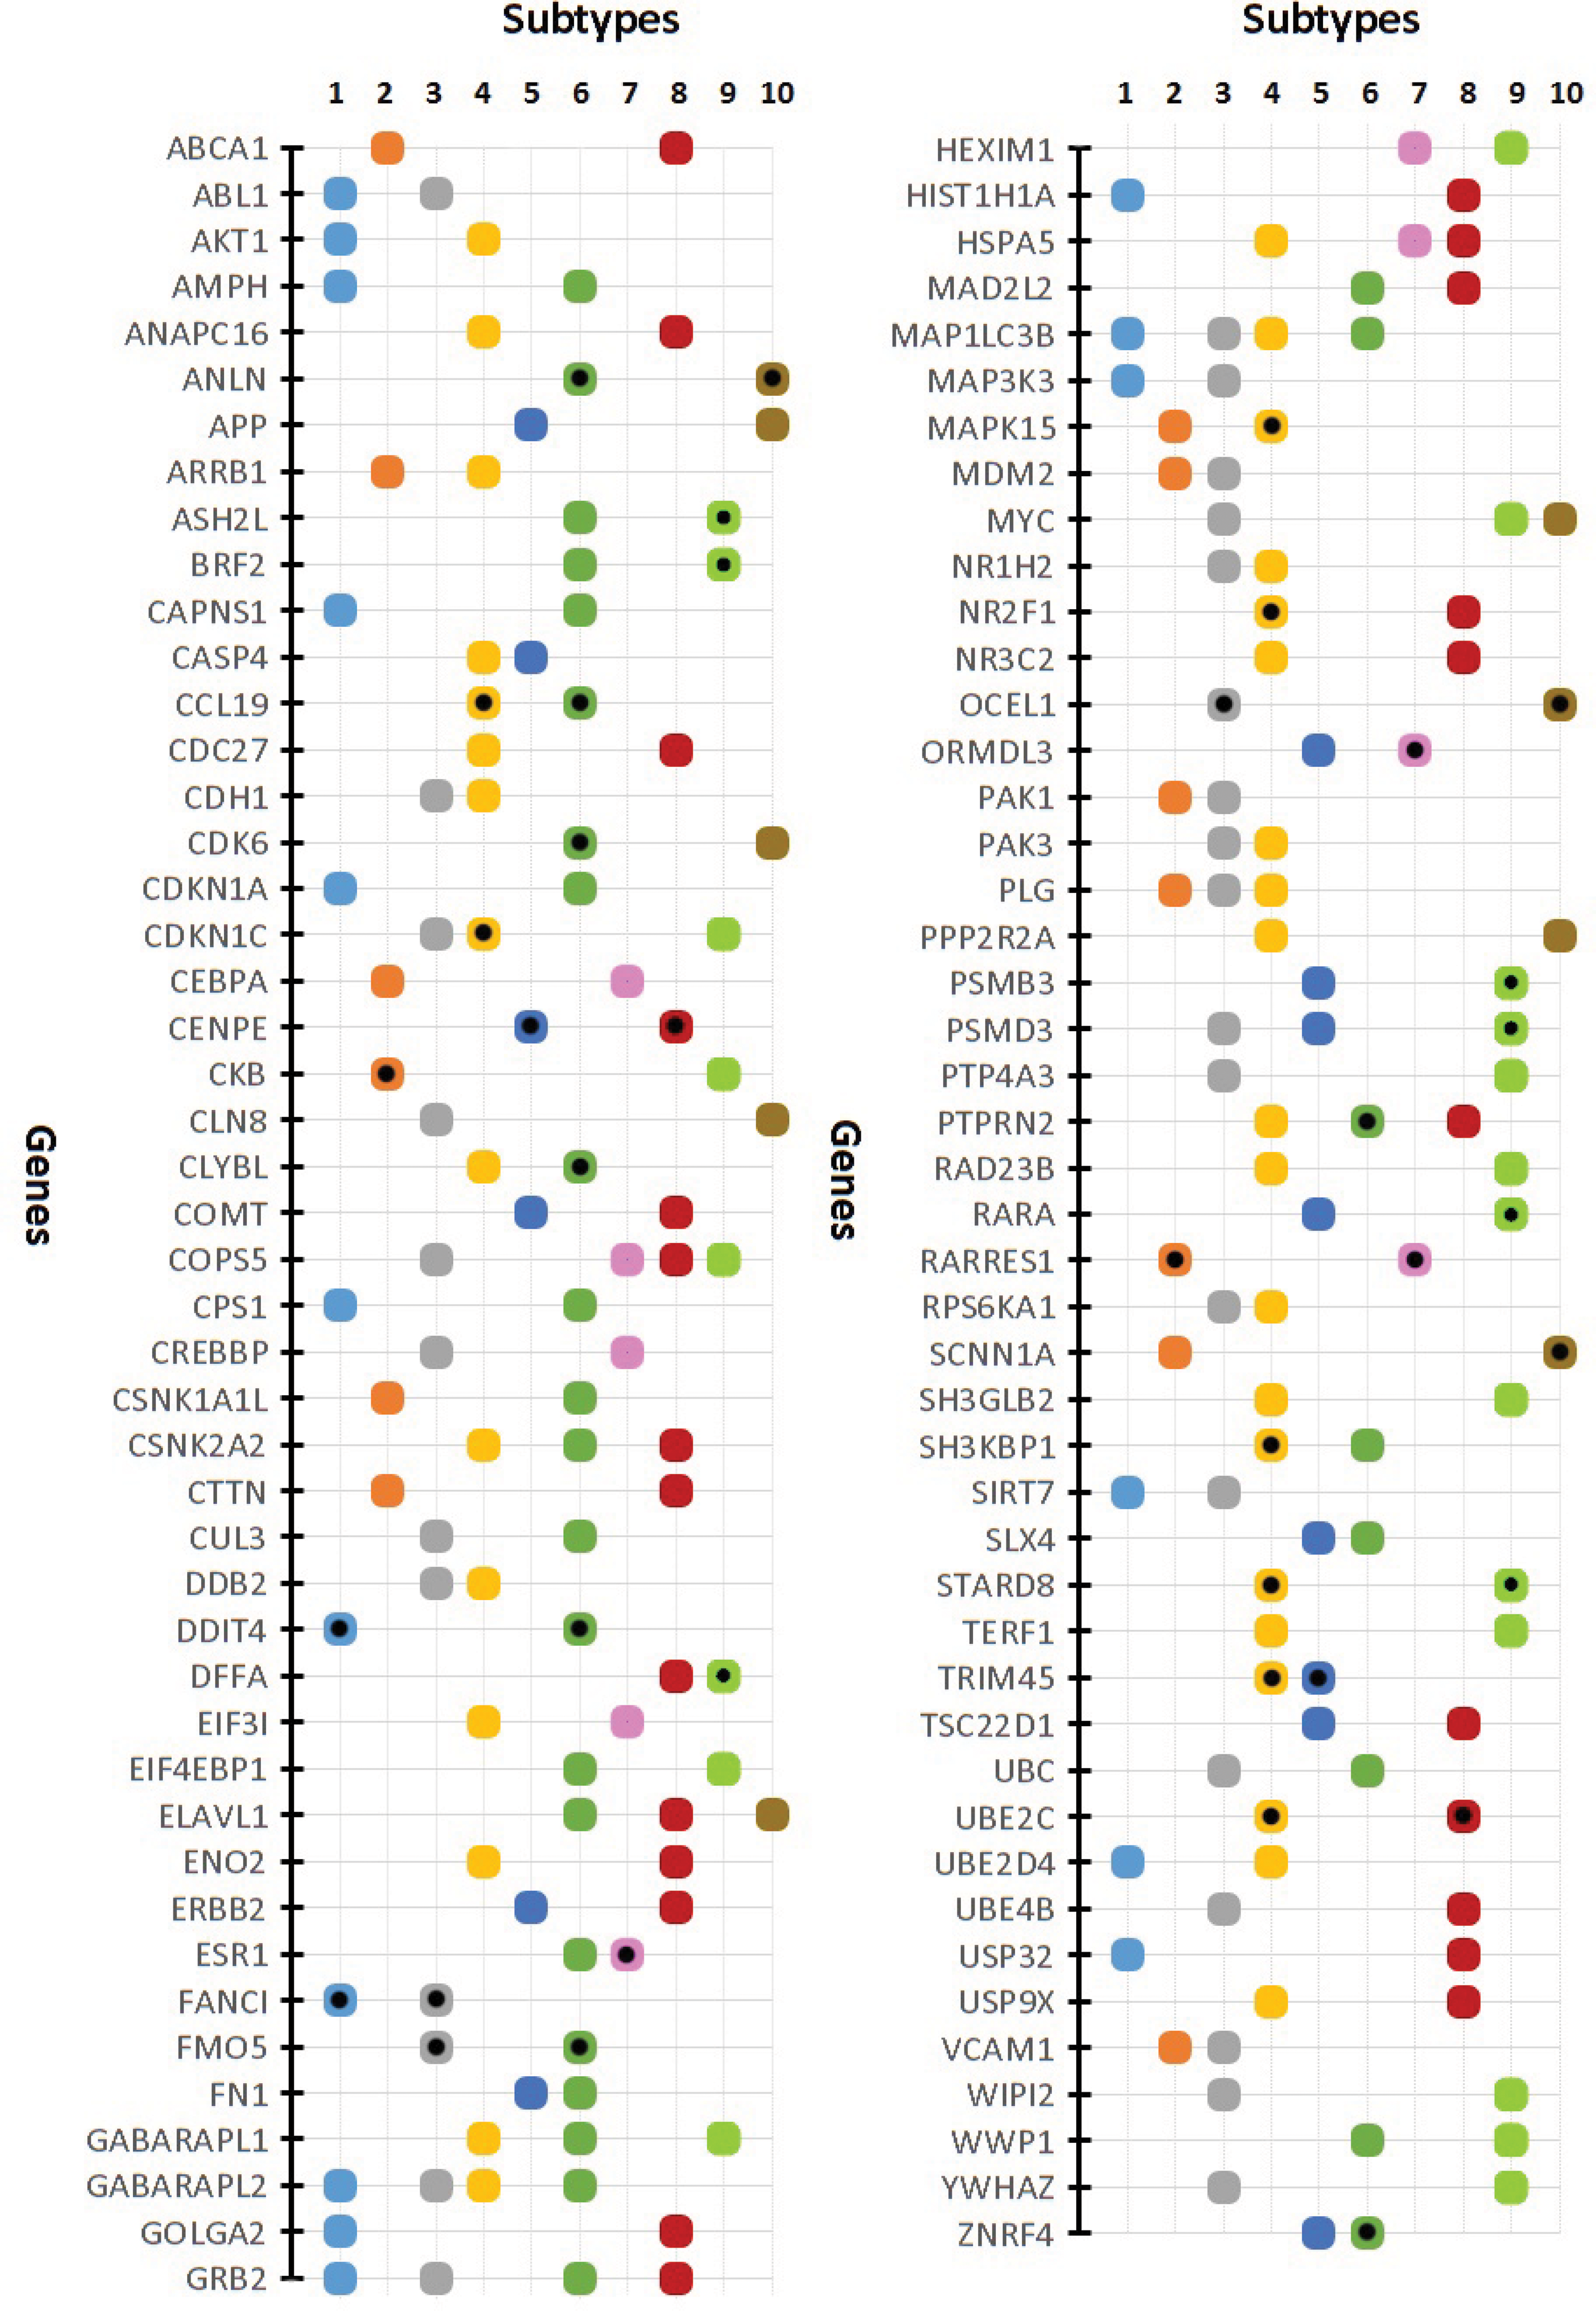
List of high-confidence genes participating in NB of more than one subtype. Markers with black circle depict the candidate genes.
4. Discussion
We used the IPAD pathway analysis database and tool (Zhang and Drabier, 2012) to determine the diseases associated with the hub nodes in the NBs obtained for each subtype. For example, out of nine genes that had >10 connections in the NB corresponding to Subtype-1, at least three of them have been related to BC, in the literature. Table 7 shows the involvement of these hub genes in BC.
5. Conclusion
We have introduced a novel framework for identifying NBs related to each of 10 BC subtypes. In the proposed framework, first we use the CNA/CNV information along with GE data to determine a set of candidate genes for each BC subtype. We then use seeds to find the differential NBs of a given subtype with the candidate genes already generated for the subtype. The NB of a subtype is the collection of subnetworks, each seeded with a candidate gene. We also used different performance measures to evaluate the performance of the obtained NBs. Our results show that NBs can separate one subtype from another with very high degree of accuracy. This may provide great utility in properly stratifying patients for treatment. Moreover, the obtained NBs may also allow BC researchers to gain insight into the mechanisms driving different BC subtypes.
Footnotes
Acknowledgments
This work has been partially supported by the Natural Sciences and Engineering Research Council of Canada (NSERC) grants and by the Windsor Essex County Cancer Centre Foundation (WECCCF) Seeds4Hope grant.
Author's Contributions
A.N., L.R., F.F., and I.R. conceived the model. I.R. and F.F. implemented the algorithms and conducted the experiments. L.P. and M.D. conducted the biological validation. All authors have read and approved the final manuscript.
Author Disclosure Statement
No competing financial interests exist.
References
Supplementary Material
Please find the following supplemental material available below.
For Open Access articles published under a Creative Commons License, all supplemental material carries the same license as the article it is associated with.
For non-Open Access articles published, all supplemental material carries a non-exclusive license, and permission requests for re-use of supplemental material or any part of supplemental material shall be sent directly to the copyright owner as specified in the copyright notice associated with the article.