
Abstract
Abstract
In this study, we present an application paradigm in which an unsupervised machine learning approach is applied to the high-dimensional influenza genetic sequences to investigate whether vaccine is a driving force to the evolution of influenza virus. We first used a visualization approach to visualize the evolutionary paths of vaccine-controlled and non-vaccine-controlled influenza viruses in a low-dimensional space. We then quantified the evolutionary differences between their evolutionary trajectories through the use of within- and between-scatter matrices computation to provide the statistical confidence to support the visualization results. We used the influenza surface Hemagglutinin (HA) gene for this study as the HA gene is the major target of the immune system. The visualization is achieved without using any clustering methods or prior information about the influenza sequences. Our results clearly showed that the evolutionary trajectories between vaccine-controlled and non-vaccine-controlled influenza viruses are different and vaccine as an evolution driving force cannot be completely eliminated.
1. Introduction
T
The influenza A virus is divided into subtypes based on differences in the surface proteins hemagglutinin (HA) and neuraminidase (NA), which are targets of the human immune system. Antigenic variants or immunologically distinct strains of A/H1N1, A/H3N2, and Type B have continued to emerge since its introduction into humans (Schweiger et al., 2002). Vaccination is the main strategy in stopping the infection and transmission of the virus in humans (Hannoun, 2013). There are three components in a seasonal flu vaccine: (1) A/H1N1, (2) A/H3N2, and (3) Type B influenza. Each component is designed to fight the specific strain in each subtype that is predicted to be the dominant circulating strain in the upcoming flu season. Over the years, there have been more than 24 vaccine updates for the A/H3N2 strain, more than 17 updates for the Type B strain, and 10 updates for the A/H1N1 strain. Each vaccine update is designed to provide immunity to the new antigenic variant that has emerged from the previous flu season. However, the long-term effects of vaccination on the evolution of the virus itself are not clear.
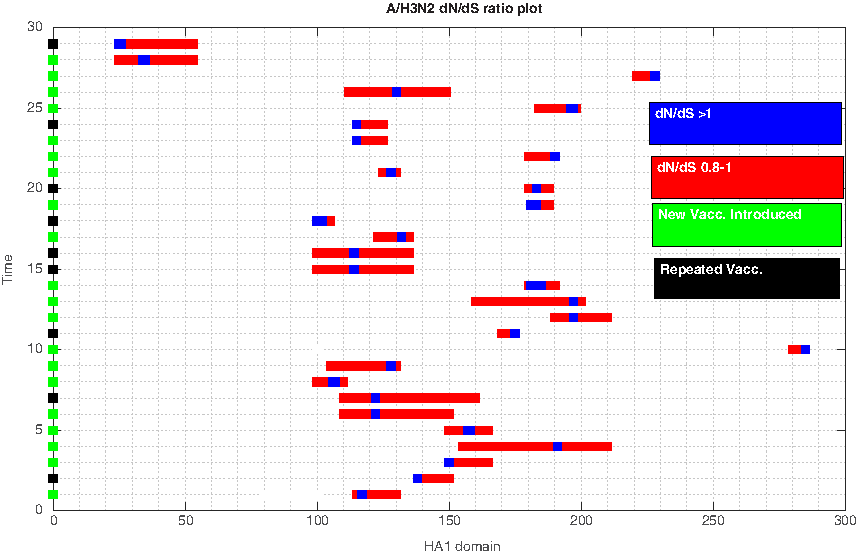
To shed light on this seemingly unsuspected problem, we used the nucleotide sequences from seasonal human A/H3N2 influenza virus from 1971 to 2016 as an example to demonstrate the evolutionary progress of this influenza virus against each successive vaccine introduction from 1971 to 2016. Figure 1 shows progression of influenza evolution based on the nonsynonymous substitutions (dN) and synonymous substitutions (dS) ratio analysis by using the HA1 domain of the HA gene from A/H3N2 virus. However, some flu seasons did not provide sufficient information of the vaccine strain accession number; thus, the actual plot did not ascend at 2016. The HA1 domain is a hypervariable domain of the HA gene where constant mutational changes can be observed due to the immune pressure generated from the host. A
Seasonal human A/H3N2 influenza
When a repeated vaccine was introduced, the positively selected sites identified from the previous season tended to remain unchanged; even though there were some years that blue sites changed, red regions indicated the possible regions where the actual positively selected sites might have settled. If multiple vaccines are recommended and at least one of them is recommended in the previous year, one still regards that the current year has updated the vaccine recommendation; however, if the same multiple vaccines are recommended for two successive years, they will be regarded as repeated strains, and different strains of this set will be run in the program for these 2 years. Given the results from the
2. Background
Influenza viruses have the ability to infect a very broad range of avian and mammalian hosts. Their genomic diversity is acquired through two biological mechanisms: antigenic drift and antigenic shift (Webster et al., 1992). Antigenic drift consists of the accumulated and continual mutations on surface proteins, resulting in the generation of antigenic variants. Of these surface proteins, we are focused on the HA protein. Antigenic shift occurs when complete gene segments are exchanged among different subtypes of influenza viruses within a host cell, resulting in what effectively amounts to a whole new influenza virus genome. Both antigenic drift and antigenic shift allow for the virus to evade the host's immune response and to rapidly adapt to new hosts (Suzuki, 2006; Caron et al., 2009). The evolution of influenza A virus is driven by the high rate of mutations and the ability to reassort gene segments. Because of its high rate of mutation combined with the lack of error-correcting mechanisms during replication, the influenza virus can easily generate different phenotypes that have the ability to survive within its host and to infect others.
To keep track of the evolution of the virus, an annual update to the influenza vaccine composition is needed to provide a vaccine-induced immunity to the general public (Boni, 2008). The main process in influenza vaccine strain selection is to assess the match between the vaccine strain and the currently circulating strains and the potential new antigenic variant (Russell et al., 2008). If the vaccine strain does not match the currently circulating strains or the new antigenic variant that is likely to be the major variant in the upcoming influenza season, the vaccine composition is updated to contain a representative of the new variant (Russell et al., 2008). Each vaccine update is designed to provide immunity to the new antigenic variant that has emerged from the previous flu season. The seasonal influenza vaccine is used to prevent the infection and transmission of the virus, but its effect on the evolution of the virus itself is not clear.
3. Methods
In this study, utilizing the online NCBI influenza database (Bao et al., 2008), we collected HA sequences from human A/H3N2, A/H1N1, Type B, and avian H5 HA sequences that represent the vaccine-controlled samples. We also collected human H5N1 and avian H5 HA sequences that represent the non-vaccine-controlled samples. Table 1 lists the year range and number of HA nucleotide sequences from each sample. To focus on evolution trends in more recent years, we incorporated recent year data collected from 2007 or 2008 onward and randomly chose the same number of samples for each year.
Vaccine.
Non-vaccine.
3.1. Influenza evolution visualization
All genetic sequences were first converted into binary strings according to the method outlined in Lam et al. (2012). Nucleotide sequences are represented by strings of characters out of an alphabet of four letters: A, C, G, T. To obtain the binary string, each letter is replaced by a code of 4 bits: 1000, 0100, 0010, and 0001, respectively. In the meantime, nucleotide sequences have some “wild cards” for cases where a single A, C, G, or T cannot be perfectly determined. We, therefore, regarded that they might appear equally possibly. For instance, if Y stands for C or T, then we use 0101 to represent it. All binary strings were collected into a matrix to which Principal Component Analysis (PCA; Jolliffe, 2002) was applied to extract the dominant variation from the dataset. Here, we briefly outline the sequence of steps involved in the PCA. Consider a data matrix
The PCA algorithm is then applied to matrix C. The result is then visualized by plotting the top two or three principal components of the projected data. Since each strain is encoded as a binary string and PCA works at the binary data level, the pairwise distance relationship between the strains in a reduced space can be understood as follows: Let
3.2. Quantification
To provide statistical support to the graphical results obtained, we performed a statistical analysis based on a method that combined a multi-class scatter matrix computation and class labels randomization. The projected data points served as the viruses' two-dimensional (2D) coordinates, and the year of isolation of each virus served as the class label. The multiclass scatter matrix involves the computation of between-class matrix (
Virus isolation year as class label
C: Number of classes
Ni: Number of data points in class
•
• B: Between-class scatter matrix
–
–
• W: Within-class scatter matrix
–
– ui: Mean of class i
4. Results
The application of the high-throughput unsupervised method to the high-dimensional influenza virus genetic sequence data has made possible the visualization of the evolution of the influenza virus in the span of almost half a century. In this study, we present the graphical results from visualization of vaccine-controlled and non-vaccine-controlled influenza viruses based on their genetic sequences alone. The human influenza A/H3N2 has the highest number of vaccine updates among the three vaccine-controlled influenza viruses circulating in humans. Given the observation about the constant shifting of positively selected sites whenever a new vaccine was introduced, we sought to visualize the evolution trajectories of vaccine-controlled and non-vaccine-controlled influenza samples. We also set out to compute the separateness values of class or clusters for both vaccine-controlled and non-vaccine-controlled samples by using the multi-class scatter matrix computation method for both the before and after class labels randomization process. We performed 1000 runs of Algorithm 1 on these samples and listed the results in Table 2. The observed separateness values
Non-vaccine.
Vaccine.
In Figure 2, we observed that the human A/H3N2 viruses clustered around vaccine seed strains chronologically since their introduction into humans in 1968. The evolution trajectory is directional, going from lower left to lower right in the figure. In Figure 3a, two separate lineages of human Type B influenza are co-circulating and each lineage shows the same observational characteristics as the A/H3N2; type B viruses are also clustered around vaccine seed strains. Next to it, Figure 3b shows the trajectories of two lineages (Yamagata and Victoria) that eventually got completely separated. Even though it is only the situation in the United States, separateness is quite clear. Black circles as vaccine strains are shown only in one of the lineages because only one virus in the United States was chosen for a vaccine strain, which is from Yamagata lineage. Since the classical H1N1 virus was replaced by the pandemic swine H1N1 strain, we focused on its evolution trend from 2008 onward. H1N1 behaved actively as two jumps (or “V” shapes), which are seen in Figure 4. One was in 2013, whereas the other was in 2015. These two discontinuities indicated abrupt changes in gene sequences from their correspondingly previous years, so the evolution trends suddenly jumped in completely different directions. However, Hamming distance plot shows that even the mutation rate between 2008 and 2016 was considerably low, ∼3%, let alone the mutation rate between two consecutive years. There is, hence, not sufficient evidence to speculate about mutation. A vaccinated avian sample was used (avian H5) to further understand the evolution characteristic of vaccine-controlled influenza.

Seasonal human A/H3N2 influenza virus evolution trajectory. Each arrow points to a vaccine seed strain (red dot). The directional evolution can be seen as traveling from lower left to the top and then coming down to the lower right.
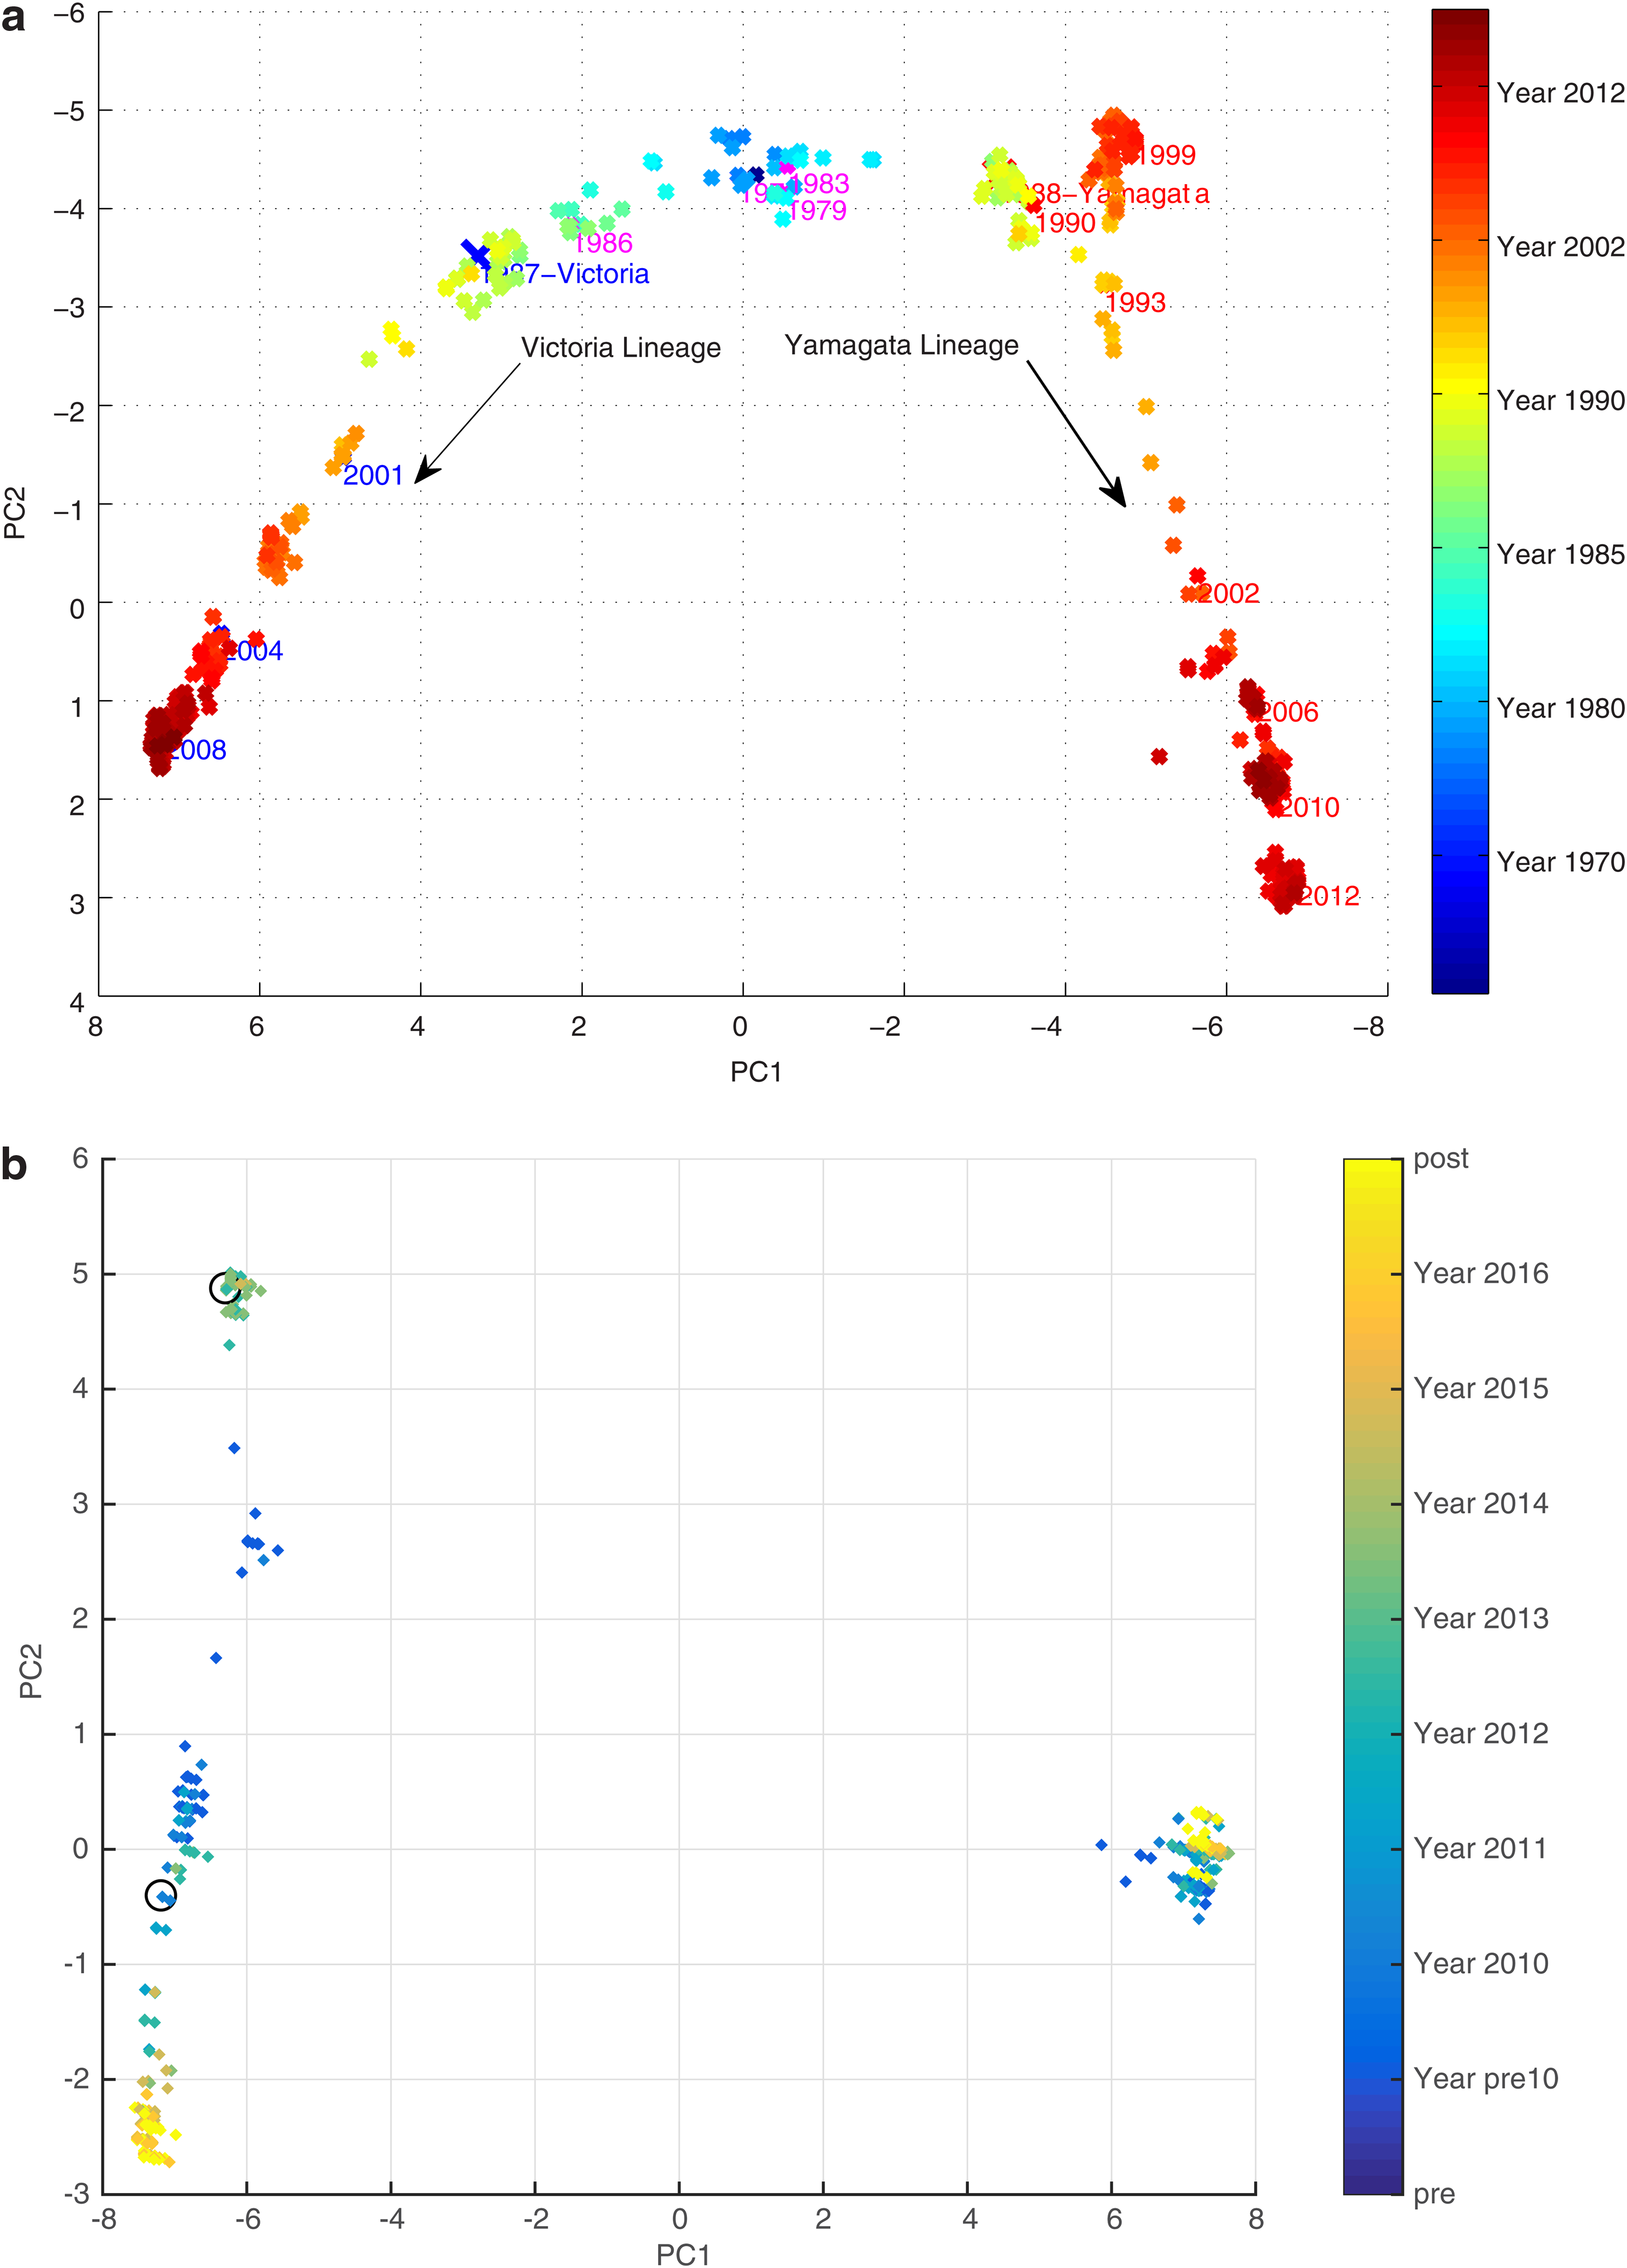
Seasonal human Type B influenza virus evolution trajectory. Two separate lineages (Victoria and Yamagata) are evolving simultaneously:
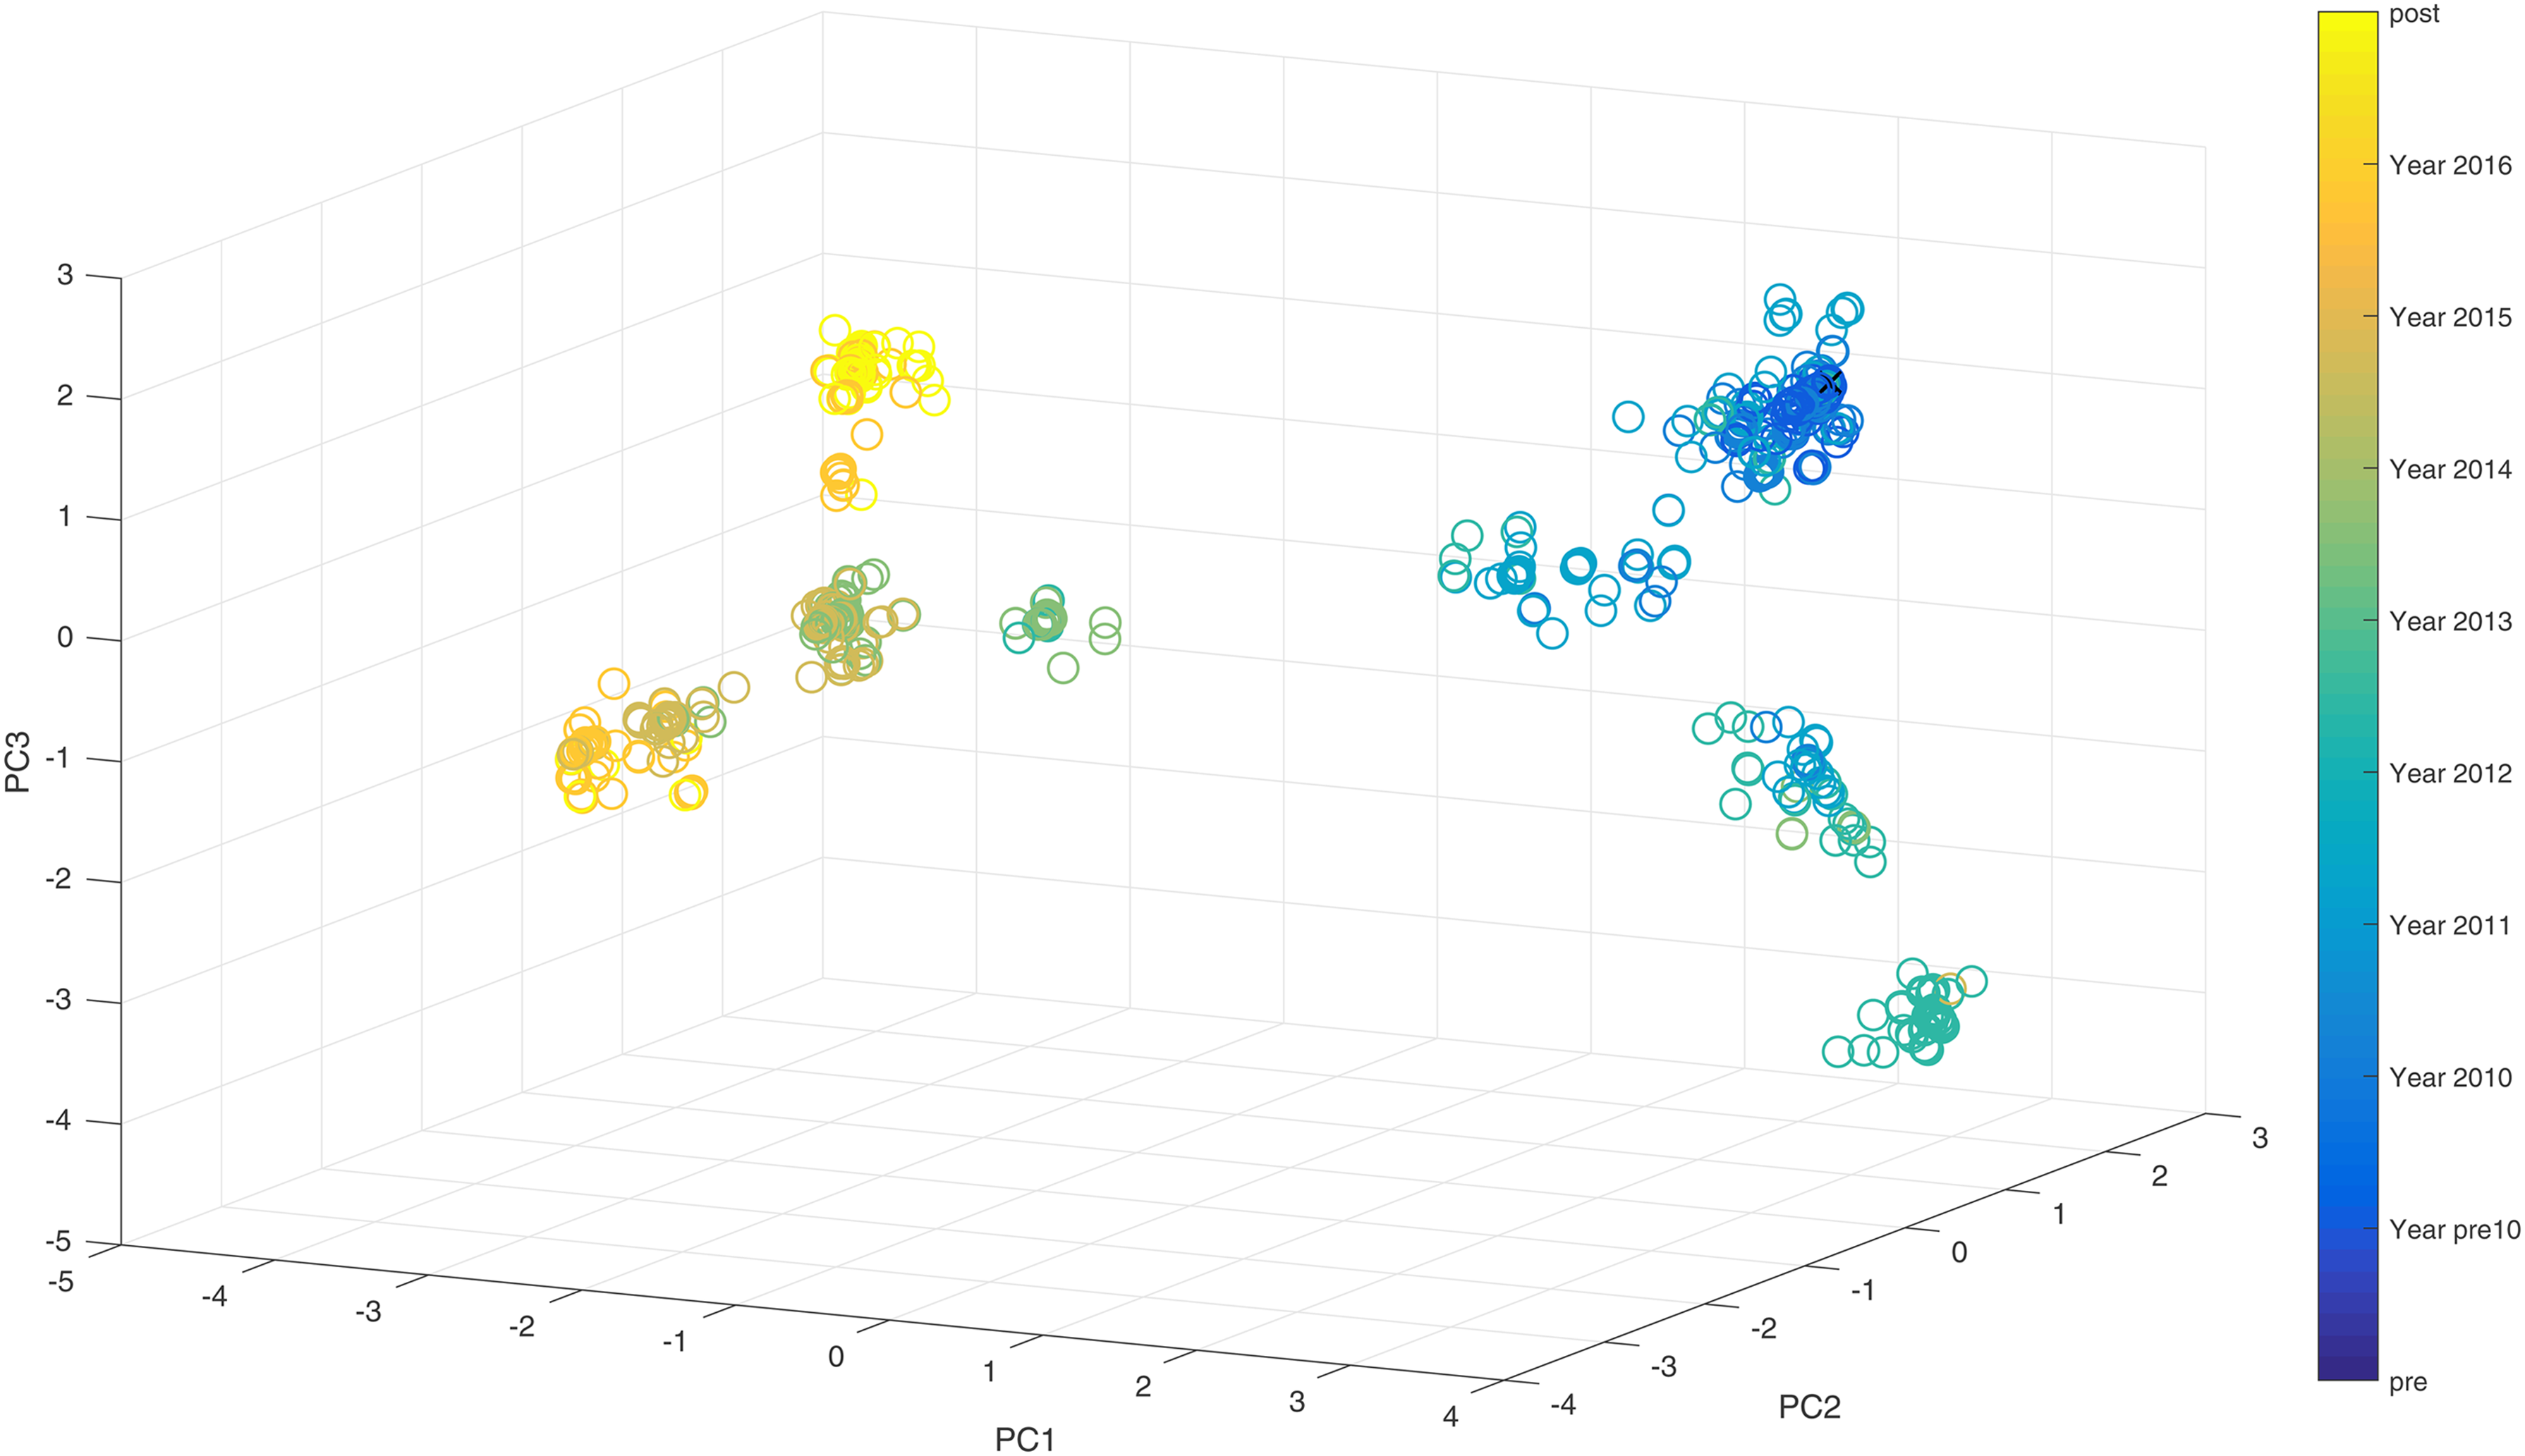
Seasonal human H1N1 influenza virus evolution trajectory in three dimensions. Vaccine strains are black crosses.
In late 1993, an outbreak of avian H5 influenza in poultry in Mexico was detected and a long-term vaccination program was implemented in the hope of bringing the outbreak under control and of eradicating the virus (Lee et al., 2004; Escorcia et al., 2008). The vaccination program was in effect for more than 13 years, but an increase in the respiratory signs of disease was observed in vaccinated chickens (Escorcia et al., 2008). In other words, the vaccine strain used in the vaccination program no longer matched the circulating strain in the field. The vaccine strain (A/Ck/Mexico/CPA-232/1994) was isolated in 1993 and has been in use for the duration of the program for more than a decade. Using the available genetic HA sequences from these vaccinated chicken, we produced a three-dimensional (3D) PCA plot (Fig. 5) to show the evolution of the field isolates from 1994 to 2002. The first observation from Figure 5 is that a directional evolutionary trend similar to other vaccinated samples can be seen in this figure. Second, a chronological pattern is obvious, indicating that the virus had undergone constant evolution or antigenic drift away from the early strains. A split in the evolutionary path can be seen occurring in the 1990s. This split or divergence has been reported in studies by Lee et al. (2004) and Escorcia et al. (2008) based on phylogenetic analyses conducted on the same sequence sample.
Vaccine-controlled avian H5 influenza virus evolution trajectory in three dimensions. The vaccine was introduced in early 1990s, and the virus slowly evolved away from the vaccine strain and established two separate lineages.
Figure 6 illustrates the evolution trajectory of the non-vaccine-controlled human H5N1 influenza from 1997 to 2002. We included the human H5N1 virus as the “control” since this subtype is not currently being vaccinated against in humans but is under active research due to its high mortality rate in infected humans. Figure 6 suggests that this subtype has evolved into a few dominant clusters since 1997. Three major evolutionary trends or clustering patterns can be seen originating from the center cluster that contains viruses from 1997. This also implies that this influenza subtype has undergone HA gene diversification. Although it has diversified since 1997, the specific H5 HA gene identified in 1997 has remained present in these days (Wei et al., 2012).
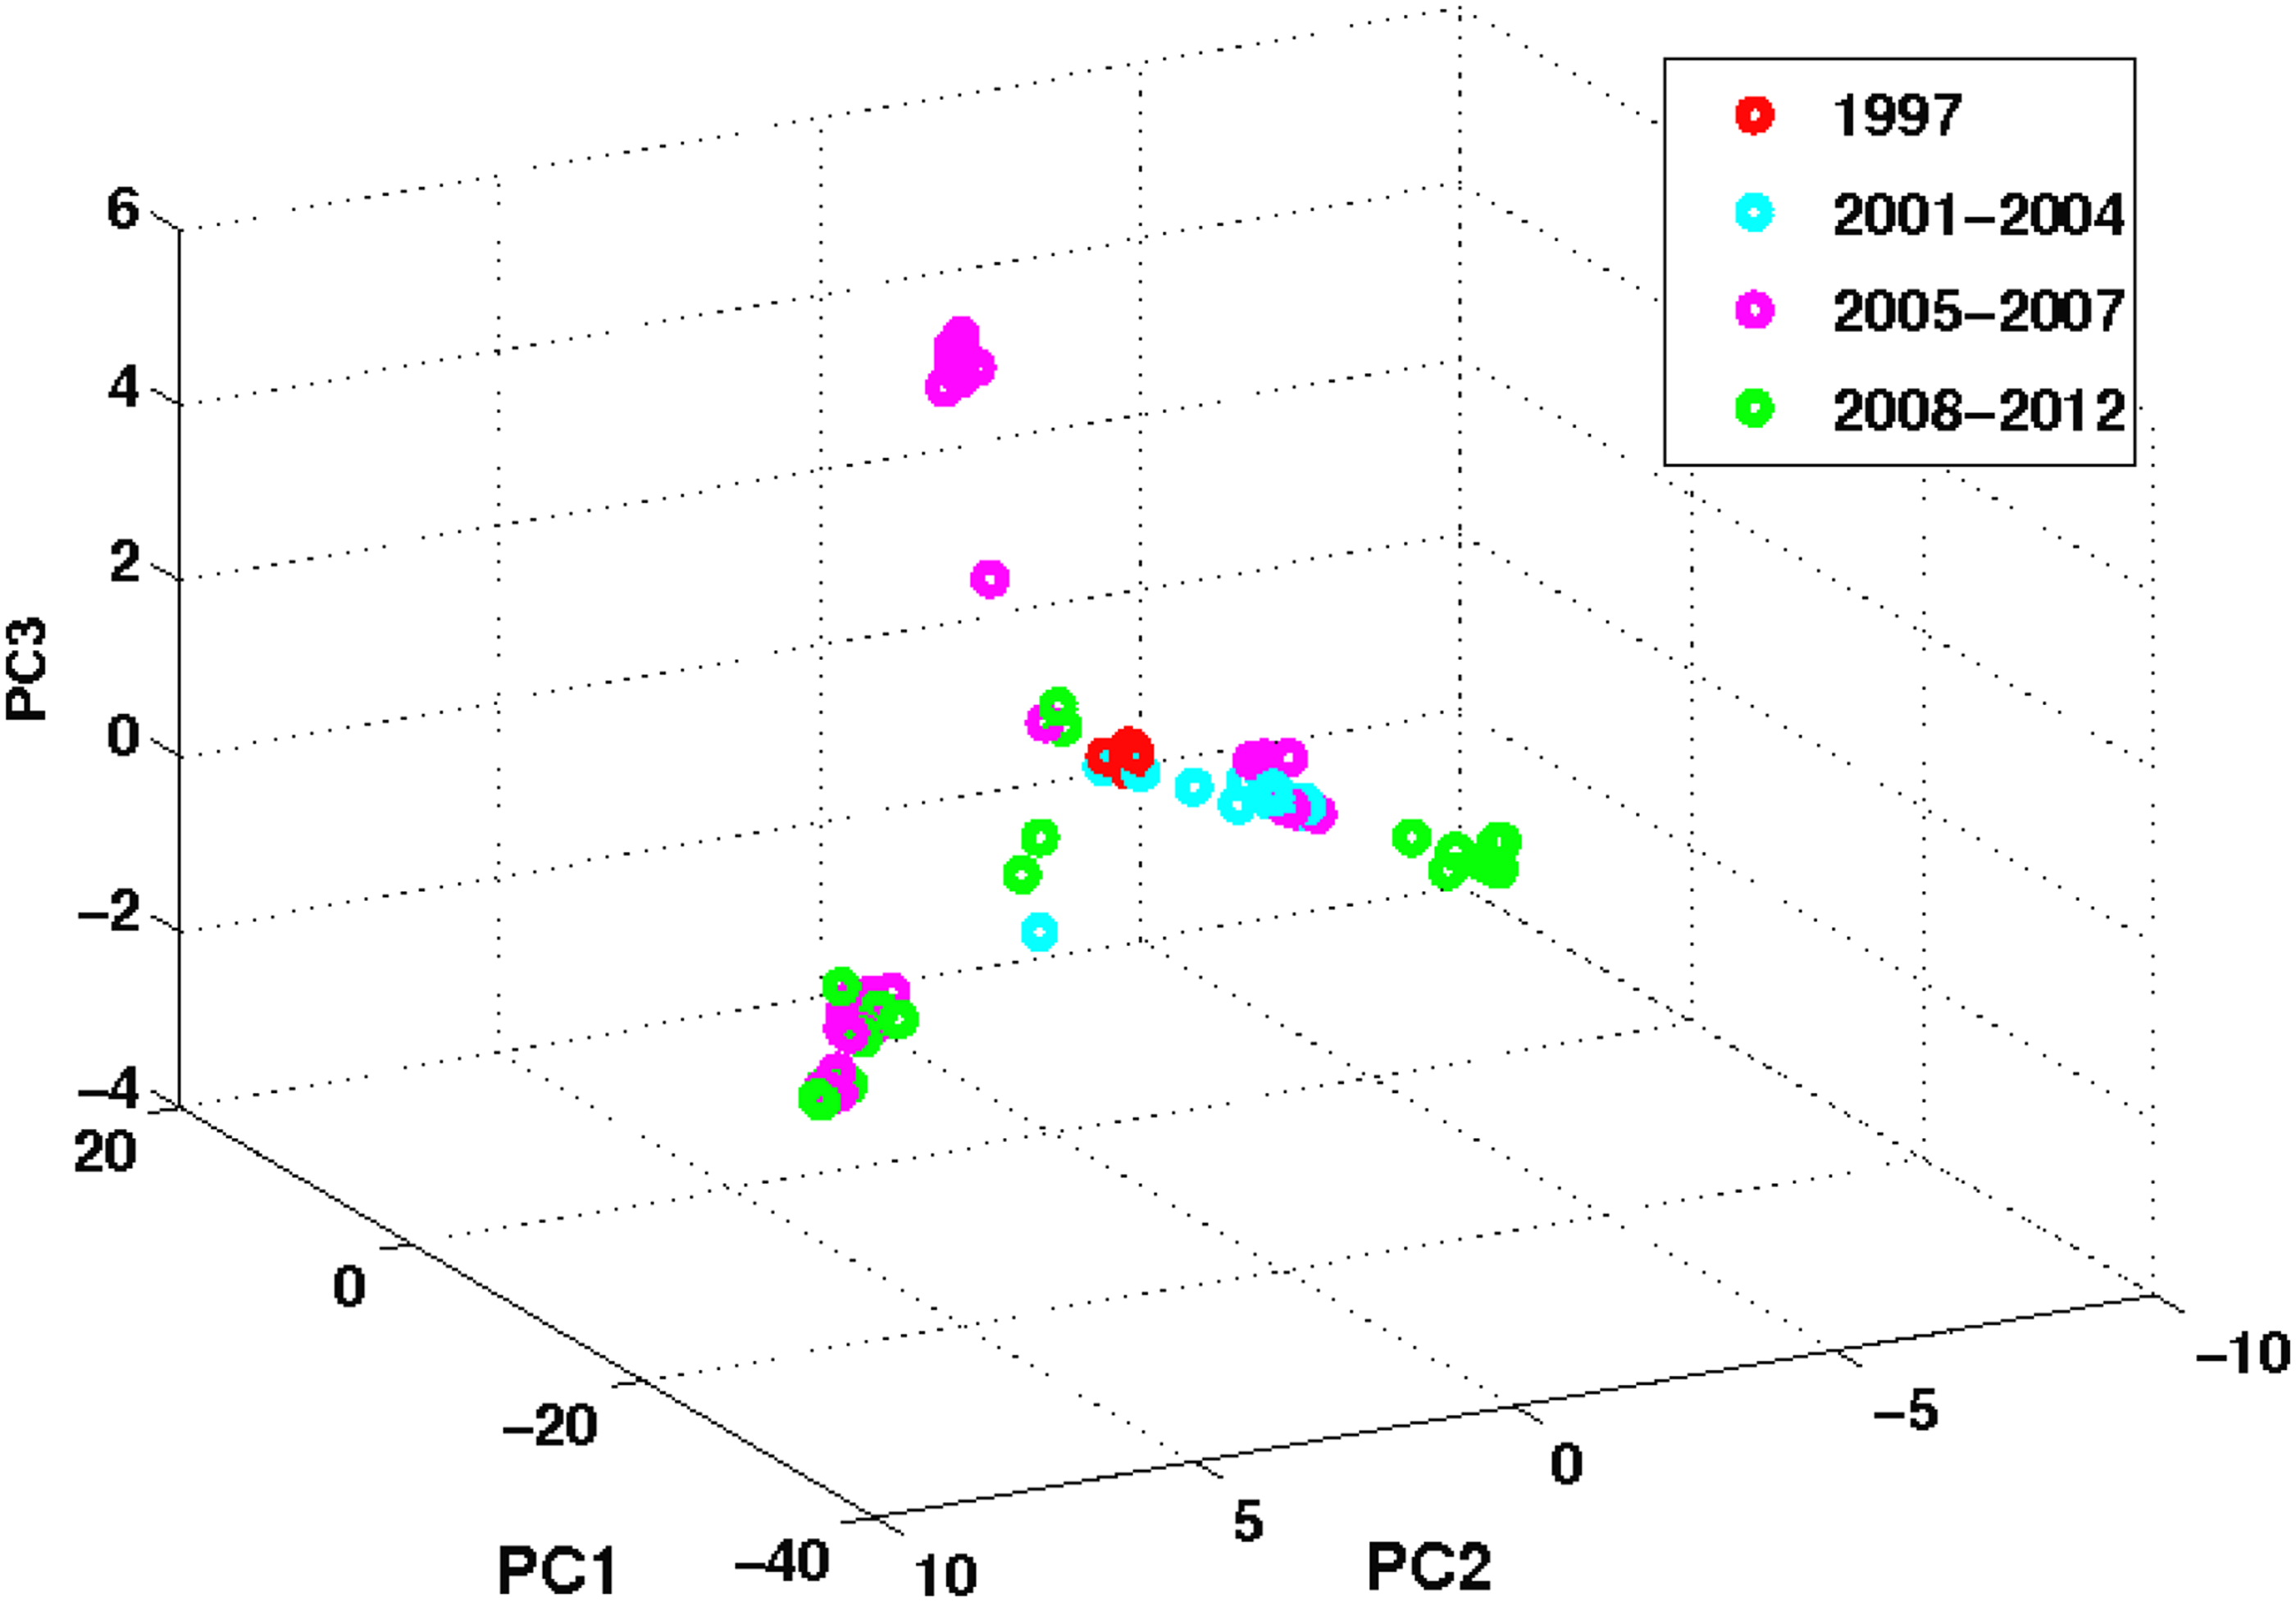
Non-vaccine-controlled human H5N1 influenza virus evolution trajectory in three dimensions. The virus has evolved into a few dominant lineages since 1997. Three major evolutionary lineages can be seen originating from the center cluster, which contains viruses from 1997. However, the specific H5 HA gene identified in 1997 has remained present in these days.
Figure 7 shows the evolution of the non-vaccine-controlled avian H5 influenza virus. The overall observation that arises from this figure is that rather than forming a restricted directional trend, the evolution of the virus is characterized by a collection of clusters scattered on the plot. The collection of clusters suggests a diverse pool of the genetic diversity of the virus. For the avian H5 subtype, a less focused evolutionary trend than vaccine-controlled influenza viruses can be observed. The increased genetic diversity since 2000 has been observed by Garcia et al. (1997) and is captured in this figure, with clusters scattered to the left and extended to the upper and lower corner at almost the same time. This clearly suggests the co-circulation of multiple clades or sublineages of the avian H5 subtype. The diverse genetic diversity of the avian H5 represented by multiple clusters across a long time period indicated that the avian subtype in the wild evolves much slower than seasonal human influenza viruses.
Non-vaccine-controlled avian H5 influenza virus evolution trajectory in three dimensions. Multiple clusters scattered throughout, sharing almost the same time periods, thus suggesting the co-circulation of multiple clades or sublineages of the avian H5 subtype.
5. Discussion and Conclusions
Vaccination is the principal measure for preventing influenza and for reducing its impact (Wood et al., 2001; Webby et al., 2004). Almost a century ago after the isolation of the first influenza virus, influenza vaccines have been persistent and have evolved to respond to the evolution of the influenza viruses evolving in humans (Gunn et al., 2010; Hannoun, 2013). Antigenic drift of influenza viruses occurs frequently among circulating strains, which leads to new antigenic variants. However, whether the drift mechanism occurs with the presence of vaccine pressure is an important question that needs to be addressed at a different level as vaccination is the primary method in the prevention and protection of humans against the influenza virus. Two studies (Lee et al., 2004; Hensley et al., 2009) have shown that vaccination forces mutations on the HA protein of the influenza virus. These mutations changed the way in which the virus gradually evolved and adapted to a new vaccine-protected environment. Here, we extended the spectrum of analysis to include vaccine-controlled human and avian samples and non-vaccine-controlled human and avian samples to better compare and contrast and understand the evolutionary dynamic of influenza viruses under vaccine pressure.
Using vaccinated and non-vaccinated samples from both human and avian hosts, we hope to minimize potential data selection bias and at the same time to provide a fair comparison across hosts under vaccination pressure. Our method utilized only the genetic composition of the HA sequences alone without using any specific clustering algorithms. As mentioned earlier and shown in Figure 1, genetic sequences contain important signals that are used to detect evolutionary trends between different influenza subtypes under vaccination pressure. The genetic composition combined with the implicit positional information of the HA gene is enough to provide clues that the vaccine-controlled influenza viruses are under pressure to mutate to escape immune responses. Our method takes advantage of the binary coding of each sequence that preserves the positional information of each HA gene.
In this study, we have demonstrated that the evolutionary trajectories for vaccine-controlled influenza are directional and restricted. The restricted directional evolutionary trends and clusters formation around the vaccine strains along the evolutionary paths exhibited by the vaccine-controlled influenza viruses are in sharp contrast to the non-vaccine-controlled influenza viruses. Apart from this distinction, the naturally emerged chronological ordering of vaccine-controlled influenza viruses in both 2D and 3D visualizations is much more noticeable than the non-vaccine-controlled viruses. This natural chronological ordering reflects the active adaptation of the viruses to their changing environment. The class separateness measure exposes the fact that vaccine-controlled influenza viruses that share the same isolation year have the tendency to cluster tightly together with good separateability. Each separate cluster or group represents a distinct genetic diversity of the virus group. In contrast, non-vaccine-controlled influenza viruses that were isolated within the same time period appeared to be more scattered, and the clusters exhibited a much larger within-cluster distance with no narrow restricted bands being observed. These observations suggested that the mutations on the HA gene were not restricted to certain sites alone and that the majority of these mutations were most likely synonymous nucleotide substitutions on the HA gene.
Also, the number of clusters observed are almost identical to the number of vaccine updates for the seasonal human A/H3N2 and influenza B viruses. The very low value of
Another consequential observation is that Yamagata lineage shows far less separateness values than any other
There are other potential factors besides vaccination that can affect the evolution of influenza viruses, such as host-specific immune response, the large difference in life expectancy between humans and avian species, vaccine efficacy and effectiveness, the transmission channel of the virus in a different environment, and geographical regions. These factors have not been considered in this present study because our overall objective is to present a genetic sequence-only approach as the first step in understanding the evolution of influenza viruses in a protected environment. Our approach works directly at the sequence level with no prior assumption about the evolution of the virus. It is a departure from the traditional one-dimensional phylogenetic approach in that we visualize influenza evolution in 2D and 3D space. All phylogenetic methods make or rely heavily on the assumptions about the underlying evolutionary process (Jenkins et al., 2002).
By using methods that avoid making assumptions about the parentage relations among the strains, we can avoid possible misinterpretation of the results. As has been shown in this article, a data-driven approach with no prior assumptions about the evolution of the influenza virus affords us a different perspective in directly visualizing how the virus evolves in a span of more than half a century. This perspective has given us insight into the way we think about the driving forces behind the emergence of human seasonal influenza antigenic variant strains season after season. Perhaps, vaccination did play a role in forcing the virus to undergo a different evolutionary path to continue to establish itself in its occupied host. A definitively scientific conclusion cannot be drawn without a thorough study of the virus in a controlled experiment for an extended period, which should, nonetheless, include multiple influenza epidemics in humans.
Footnotes
Acknowledgments
This research was supported in part by NSF grants IIS 1319749. Influenza research in Srinand Sreevatsan lab is funded by the National Institute of Allergy and Infectious Diseases, National Institutes of Health, and Department of Health and Human Services, under Contract No. HHSN266200700007C. Its contents are solely the responsibility of the authors and do not necessarily represent the official views of the NIH or NSF. The funders had no role in the study design, data collection and analysis, decision to publish, or preparation of the article.
Author Disclosure Statement
No competing financial interests exist.