
Abstract
Abstract
1. Introduction
N
One way to improve genome analysis is to consider its organization in terms of local nucleotide distribution. More specifically, the distribution of oligonucleotides in bacterial chromosomes is relatively stable along a DNA strand and it is particular for each organism (Karlin and Burge, 1995; Bohlin and Skjerve, 2009). This information can be used to analyze the genome and may lead to important knowledge about the organism. This approach is particularly relevant due to bacterial genome plasticity, where atypical regions may consist of exchanged DNA acquired by horizontal gene transfer (HGT), bacteriophages, and transposable elements, which can bring some adaptive advantages to them (Casjens, 1998; Monteiro-Vitorello et al., 2005; Darmon and Leach, 2014).
Great effort has been spent in attempts to identify anomalous regions in prokaryotes. For instance, Garcia-Vallve et al. (2003) developed a database, HGT-DB, of putative horizontally transferred genes in complete bacterial genomes using codon usage and G + C content. Another important approach is the IslandPath, which corresponds to a web-accessible service to identify genomic islands (GIs) based on %G+C and dinucleotide bias (Hsiao et al., 2003). ISlander is another database of integrative islands identified from tRNA genes (Mantri and Williams, 2004). Later, Waack et al. (2006) proposed the software SIGI-HMM to predict GIs in prokaryotic genomes using hidden Markov models, and Vernikos and Parkhill (2006) introduced the method Interpolated Variable Order motifs, known also as Alien Hunter, with the same objective.
Therefore, knowing that anomalous genomic regions can provide specific and important features that distinguish closely related bacterial lineages and that each available approach used to identify them has different characteristics and methods, the challenge is improving analysis efficiency (EF) in terms of performance, time, and complexity. Thus, our aim was to develop a simple and effective approach based on maximum entropy (ME) to quickly reveal anomalous regions in bacterial genomes.
The entropy (Shannon, 1948) can be understood as a measure of the uncertainty of a system, in this case, the genome. ME was originally proposed by Jaynes (1957a, b) in statistical mechanics, which is obtained from the probability distribution derived by selecting the higher uncertainty, namely ME (Guiasu and Shenitzer, 1985).
It is important to note that the ME-based analysis sole requirement is the genome sequence in FASTA format as input. There is no need for annotations or alignment concepts. Besides, genome sequences already annotated can be used to assess which proteins are encoded for in each region.
2. Methods
The ME methodology stands out from currently available approaches due to its simplicity and reduced computational time, consisting of basically two main steps: sequence processing and ME calculation.
2.1. Processing the sequences
The genome (G) may be defined as a finite sequence containing the distribution of four bases [G = (A, C, G, T)]. The aim is to identify regions with varying oligonucleotide frequencies within the individual chromosome. The analysis is performed according to the size of the target region (2 or 5 kb, for example) and the size of the sliding window, which can be defined as 2, 4, or 6 nucleotides long.
A sliding window is applied to each target genomic region and this slides along the sequence one base at time, accounting for the frequency of each mono-, di-, or trinucleotide that appears adjacent to the other mono-, di-, or trinucleotide. The values for each region are stored in an adjacency matrix and these are used for ME calculation. Figure 1a shows an example of how this process is carried out.

Genomic sequence analysis according to the maximum entropy (ME) method.
2.2. ME calculation
The ME method is then applied to each adjacency matrix generated in the previous step (Processing the sequences). Thus, the method first assigns an ME value to each genomic coordinate, and then combines these values to give a signature ME pattern for each genomic region (Fig. 1b). According to Jaynes (1957a, b), ME is mathematically defined as follows:
and
where t corresponds to the position in the window in each round of analysis (ME1, ME2, etc) and h(i) is the frequency of all oligonucleotides present in the first part, i is the position of the oligonucleotide set, and h(j) is the total oligonucleotide frequency (Fig. 1b). The ultimate ME value is then calculated as
Figure 1b shows a representation of this process where, at the end, ME is used to represent the nucleotide distribution of each genomic region.
Once ME values along the chromosome have been calculated, their distribution can be visualized graphically. It is important to emphasize that the smaller the window size, the greater the variation in the graphic resolution will be. With that in mind, we evaluated the system's performance using different target genomic window sizes (2, 5, 10, and 50 kb). Furthermore, for each tested genomic window size, we also evaluated different word sizes (2, 4, and 6 nucleotides) to assess the ability of the ME method to identify anomalous regions using each parameter.
Considering that we are looking for regions with the highest ME values (anomalous regions), values around and below the median can be considered more stable. In the present study, we selected to explore within the ME distribution, and ME values greater or equal to the third quartile (Q3) are indicated as putative anomalous regions (PAR = ME ≥Q3).
The results are displayed graphically as a line chart with the ME distribution along the genome, their coordinates, and the predicted anomalous regions (Fig. 2).
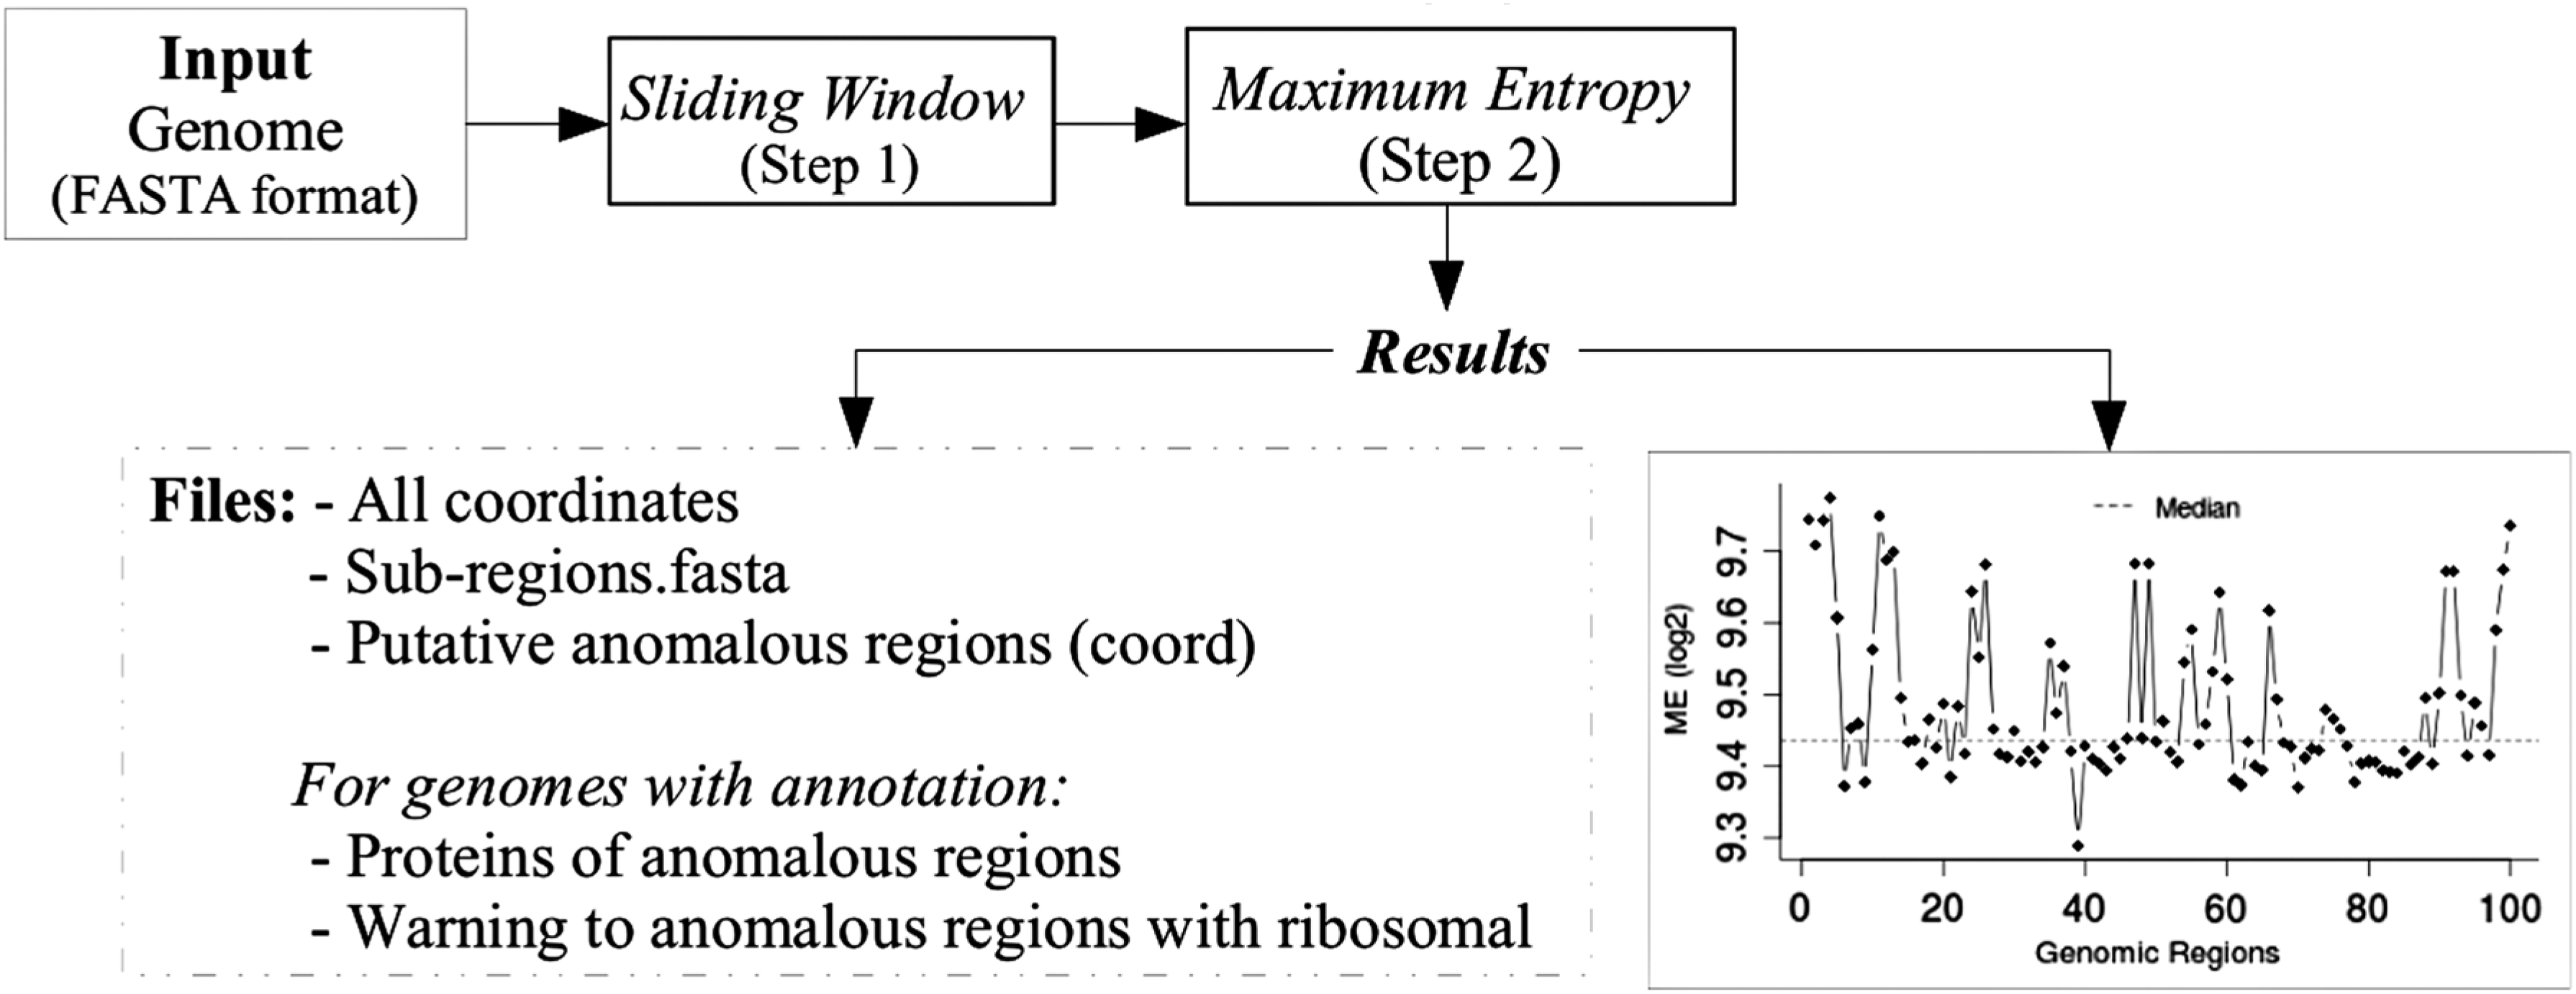
A simplified representation of the genomic sequence analysis methodology developed herein based on ME proposed to identify anomalous regions. The analysis consists of two main steps: a sequence processing step during which the target genome sequence, in FASTA format, is analyzed using a 2, 4, or 6-nucleotide-long sliding window, followed by the ME calculation step. The result is a graphic representation of the ME values' distribution along the target sequence. Sequences with ME values above the upper quartile (Q3) were considered for further analyses. Besides, for genomes with annotation, Supplementary figures can be obtained. These include a list of the proteins encoding genes within the anomalous regions and information about the possible presence of ribosomal RNA-coding sequences within the anomalous regions.
2.3. Evaluating the proposed methodology
The following genomes were used to evaluate the proposed approach: Xanthomonas axonopodis pv. citri 306 (XAC) and Xanthomonas campestris pv. campestris ATCC 33913 (XCC). The genomes from these organisms have had their anomalous regions well characterized (Van Sluys et al., 2002; Lima et al., 2005, 2008). Thus, the coding DNA sequences (CDS) within their anomalous regions were defined as true positives by default and the other regions were defined as true negatives. From here, it was possible to calculate the sensitivity (% − SN) and specificity (% − SP) for each analysis and, consequently, the efficiency (% − EF: (SN + SP)/2) and F-score (%) (Powers, 2011). Furthermore, these genomes were also used to evaluate the competing methods (Alien Hunter, HGT-DB, Islander, IslandPath, and SIGI-HMM) and to compare their results against the proposed ME approach. All the analyses were performed on the same computer (Intel Core i3-540 Processor and 8 GB RAM) to illustrate the reduced requirements in terms of computational power and execution time to perform the experiments efficiently. The methods available only as database (HGT-DB and Islander) were performed in the web and results downloaded from its websites.
2.4. Applying the ME methodology to other chromosomes
For the ME approach evaluation, besides Xanthomonas, another seven bacterial genera were analyzed: Bradyrhizobium, Rhizobium, Sinorhizobium, Burkholderia, Escherichia, Haemophilus, and Pseudomonas. Next, to confirm that ME can discriminate anomalous regions in the chromosome, we randomly selected regions of low, median, and high ME values from one organism of each chosen species to verify which of these regions are shared within the same species and between species of the same genus. To this end, we performed BLASTn and we compared the coverage (%) of each selected region against the other organisms from the same genus (Altschul et al., 1990). The coverage corresponds to the percentage of the selected regions that are found in other bacterial genomes belonging to the same genus and species.
The list of bacterial species used can be found in Supplementary Figure S1. All the analyzed chromosomes were downloaded from NCBI database (ftp://ftp.ncbi.nlm.nih.gov/genomes).
3. Results and Discussion
Due to the ease with which prokaryotic genomes can be sequenced nowadays, the volume of newly generated data is on the rise at accelerated rates. To accompany this increase, several nucleotide sequence analysis tools have been developed, each with different objectives. The present study proposes the use of ME as an alternative approach to explore individual bacterial genomes, focusing on the identification of anomalous regions. The anomalous regions could contain distinctive features of organisms, thereby providing important information in a fast and effective way. Furthermore, it does not need any additional information a priori, for instance, the annotation and alignments, to perform the ME method.
It is important to clarify that ME is used to discriminate anomalous regions that do not necessarily correspond to HGT events, but regions that have a greater discrepancy in the frequency of oligonucleotides. To confirm whether some of these anomalous regions are indeed from HGT events, additional analyses are still warranted. ME may play an important role in the initial stages of this kind of investigation, being useful to prioritize regions to be explored in more detail.
The proposed approach consists of scanning the target genomic sequence using a predetermined sliding window size and calculating the frequency of di-, tetra-, or hexanucleotides within each window. ME is then calculated for each window, and the highest value is chosen to represent the respective region and the resulting ME distribution may be visualized graphically. ME values greater than or equal to Q3 are considered to be PARs, as explained in the Methods section. To evaluate which would be the best parameters to analyze, we have applied ME to evaluate two genomes of Xanthomonas with different parameter combinations; the results are presented in Figure 3.
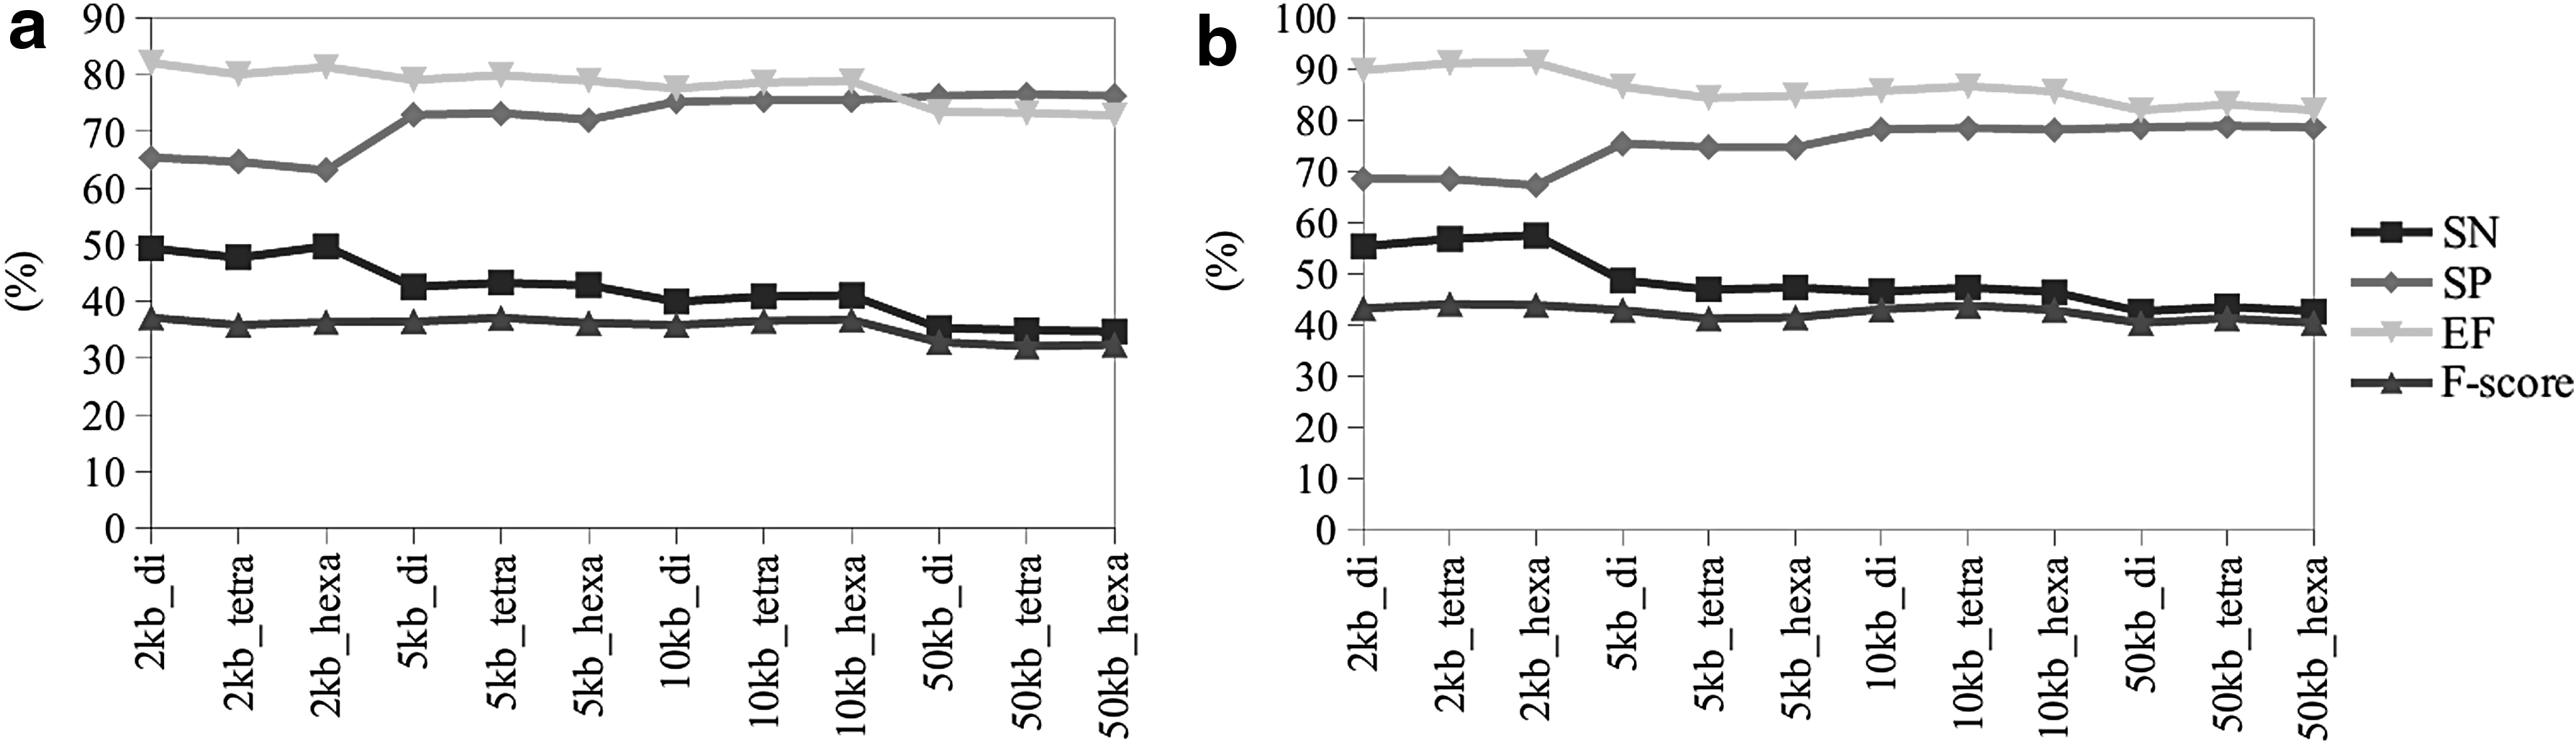
Evaluation of parameters (window size [kb] and word size [di, tetra, or hexanucleotide]) to be used in the identification of anomalous regions of bacterial genomes based on ME.
The correct identification of atypical regions in bacterial genomes naturally depends on the adopted method and the discriminant criteria because the result can be skewed according to the parameters' chosen settings. Because of this, different methods have been developed to provide researchers with analytical tools that will optimally highlight target genomic features of interest such as alien genetic sequences (Azad and Lawrence, 2011).
On the other hand, visual analysis of the line chart shows that the smaller the window size, the lower the resolution, thereby limiting the researcher's ability to explore and interact with the graph (Supplementary Figs. S2 and S3). Alternatively, iterative analysis cycles using different parameter settings may be performed to find which best fits the dataset. This could facilitate the analysis since with ME, we did not observe efficiency loss (Fig. 3).
Moreover, ME may be considered a fast in silico approach to the universal analysis of bacterial genomes. It spent ∼7 minutes to analyze each Xanthomonas (5 Mb) genome.
Furthermore, we also compared the ME results against other competing methods. A detailed description of these methods can be found in Table 1. Regarding the requirements, just ME and Alien Hunter are independent of annotation. When compared, ME was faster in the analysis of Xanthomonas genomes (Table 1). Another advantage of the ME method is that it will be available as a stand-alone package. IslandPath and SIGI-HMM are faster, but their performance is worse than that of the proposed approach (Fig. 4). Regarding databases (HGT-DB and Islander), the predictions had already been completed, then we only downloaded the results and calculated their efficiency.
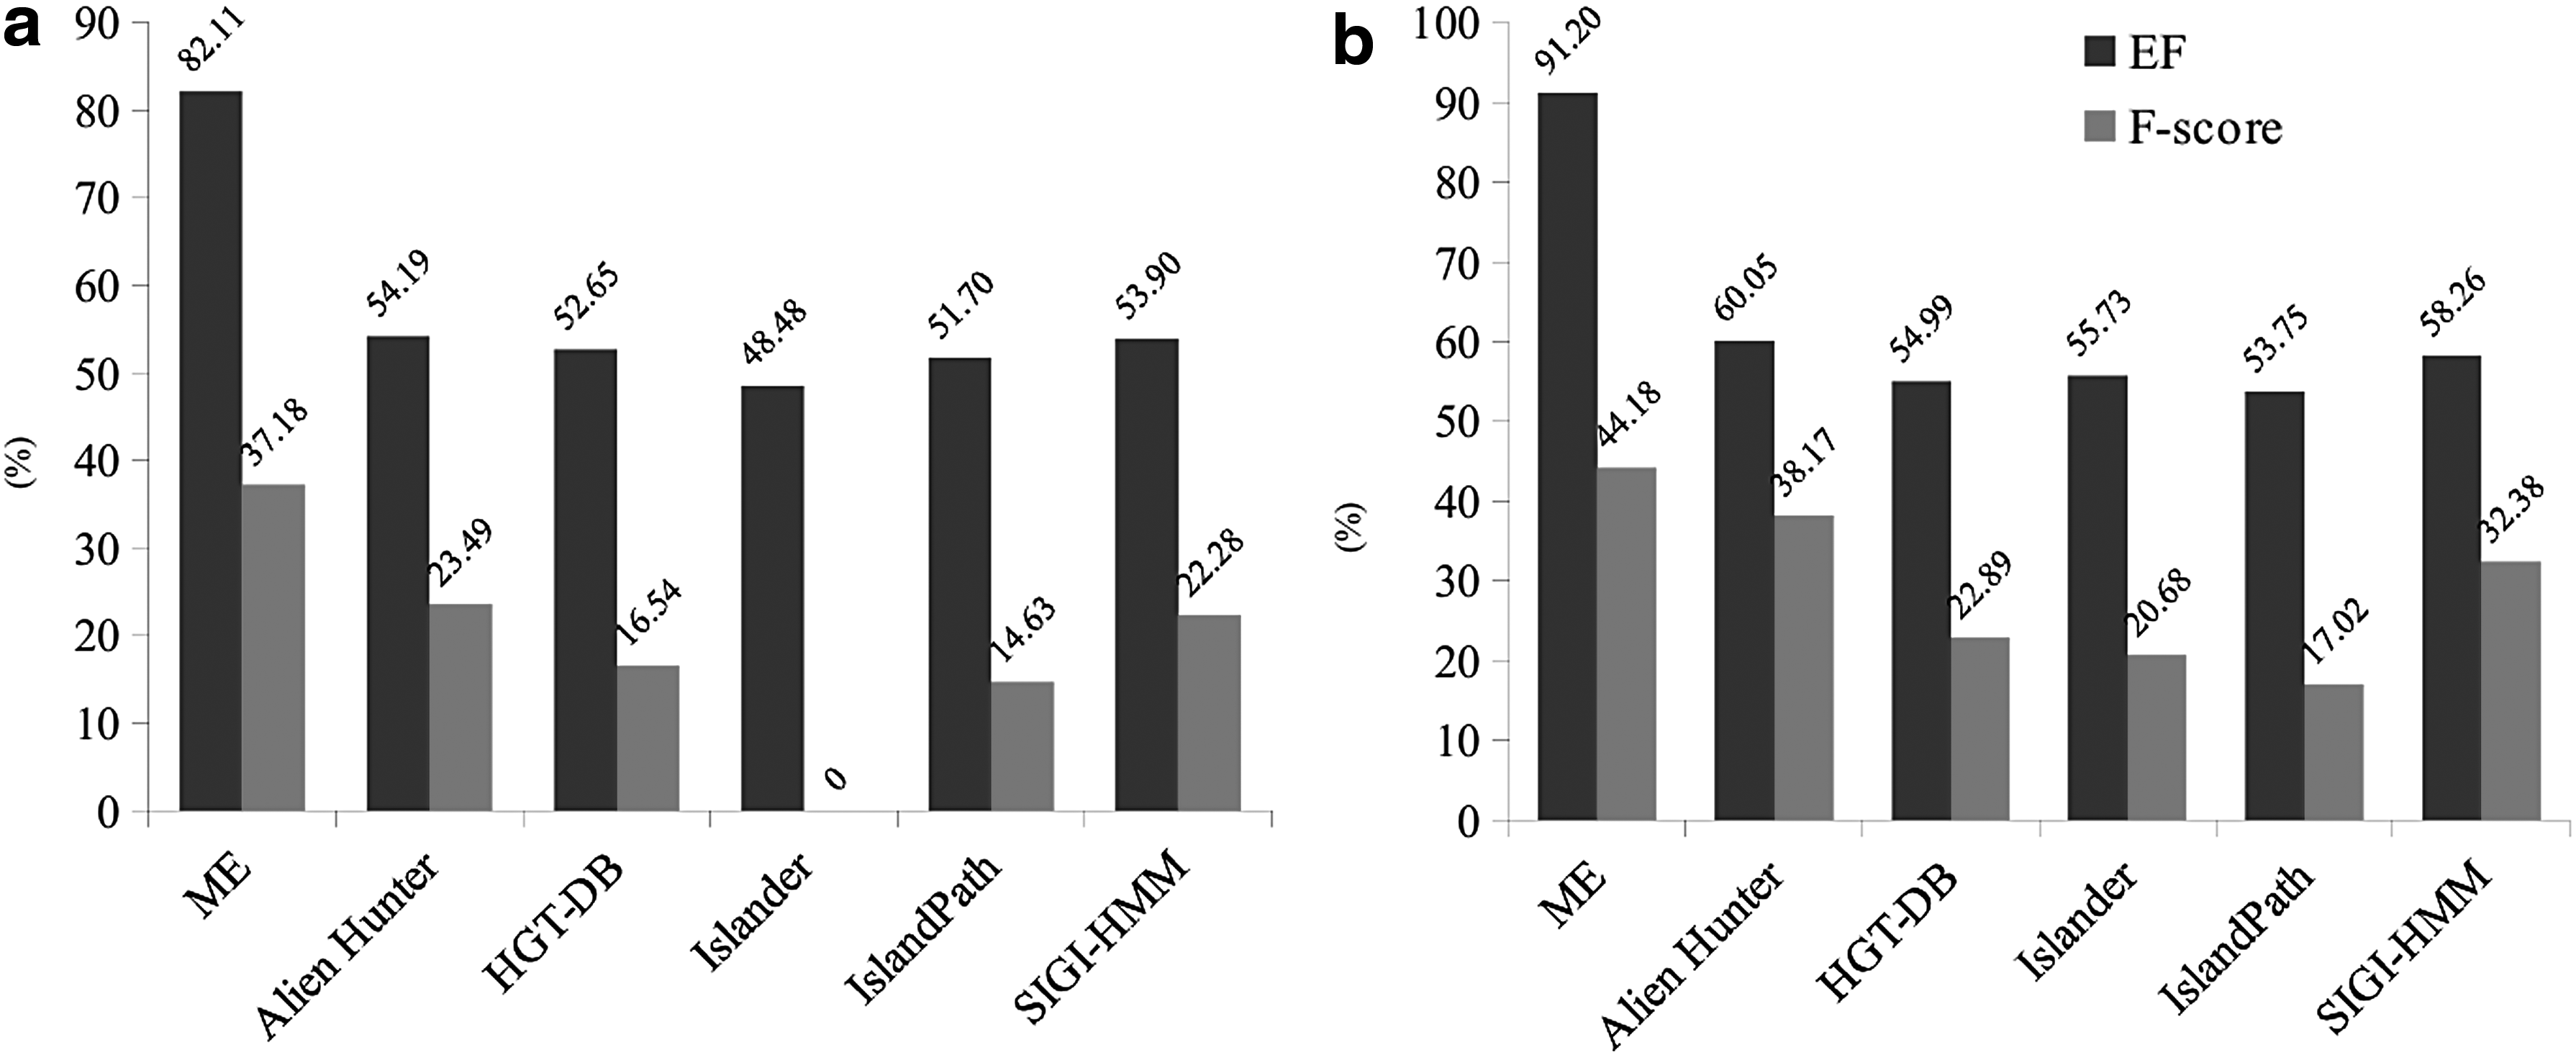
Currently available methods' performance comparison with regard to predicting alien genes based on EF and F-score.
Mean time spent on analysis of each Xanthomonas genome.
Figure 4 displays a comparative analysis of the methods available with regard to their F-score and efficiency in predicting atypical regions in two Xanthomonas genomes. All analyses were performed on the same computer to standardize any potential computational power-related variables, thereby allowing us to assess the computational requirements of each method on a level ground.
Overall, the ME approach demonstrated a higher predictive efficiency (EF = 82% and EF = 91% in both cases) compared with the competing methods tested herein. Similarly, ME also showed superior results in terms of F-score (Fig. 4). The second most efficient method was Alien Hunter (EF = 54% and EF = 60%), which most closely resembles the proposed methodology, followed by the SIGI-HMM method (Fig. 4). Therefore, considering the performance and computational requirements in terms of predictive power and time, ME provides a better option for this type of analysis because of its ease of use and speed. Furthermore, all it requires is the raw genomic sequence in FASTA format. This means that the ME method may be applied to newly sequenced genomes to expedite the analysis and direct the researchers' attention toward genomic regions presenting higher entropy.
We used the ME methodology to analyze the genomes of XCC ATCC 33913 as well as seven other bacterial genomes to include Bradyrhizobium sp. ORS 278, Rhizobium etli CFN 42, Sinorhizobium meliloti SM11, Burkholderia pseudomallei 1106a, Escherichia coli 536, Haemophilus influenzae Rd KW20, and Pseudomonas aeruginosa DK2. From each chromosome, we randomly selected regions with low ME values, with ME values around the median, and regions with higher ME values to show that regions with higher ME are the least conserved. To this end, we compared the percentage coverage of each selected region between the members of the same species and within the same genus. This procedure was important to verify whether the high ME values correspond to the real possibility of finding characteristics not shared by all. The results can be found in Supplementary Figure S4.
The genus Xanthomonas has been much studied as it encompasses plant pathogenic bacteria of economic importance. Specifically, XCC ATCC 33913 causes black rot in crucifers, its genome comprises a circular chromosome of 5,076,187 bp and no plasmid (da Silva et al., 2002). The ME profile of XCC ATCC 33913 is displayed in the Figure 5a, each point in the line chart corresponds to genomic regions with 50 kb. As we can observe, the ME distribution along the chromosome showed much variation, which corroborates the fact that this genome is rich in transposable elements (da Silva et al., 2002). In addition, this genome has 35 laterally transferred GIs as already described by Lima et al. (2005, 2008), another factor that also explains this variation in entropy values.
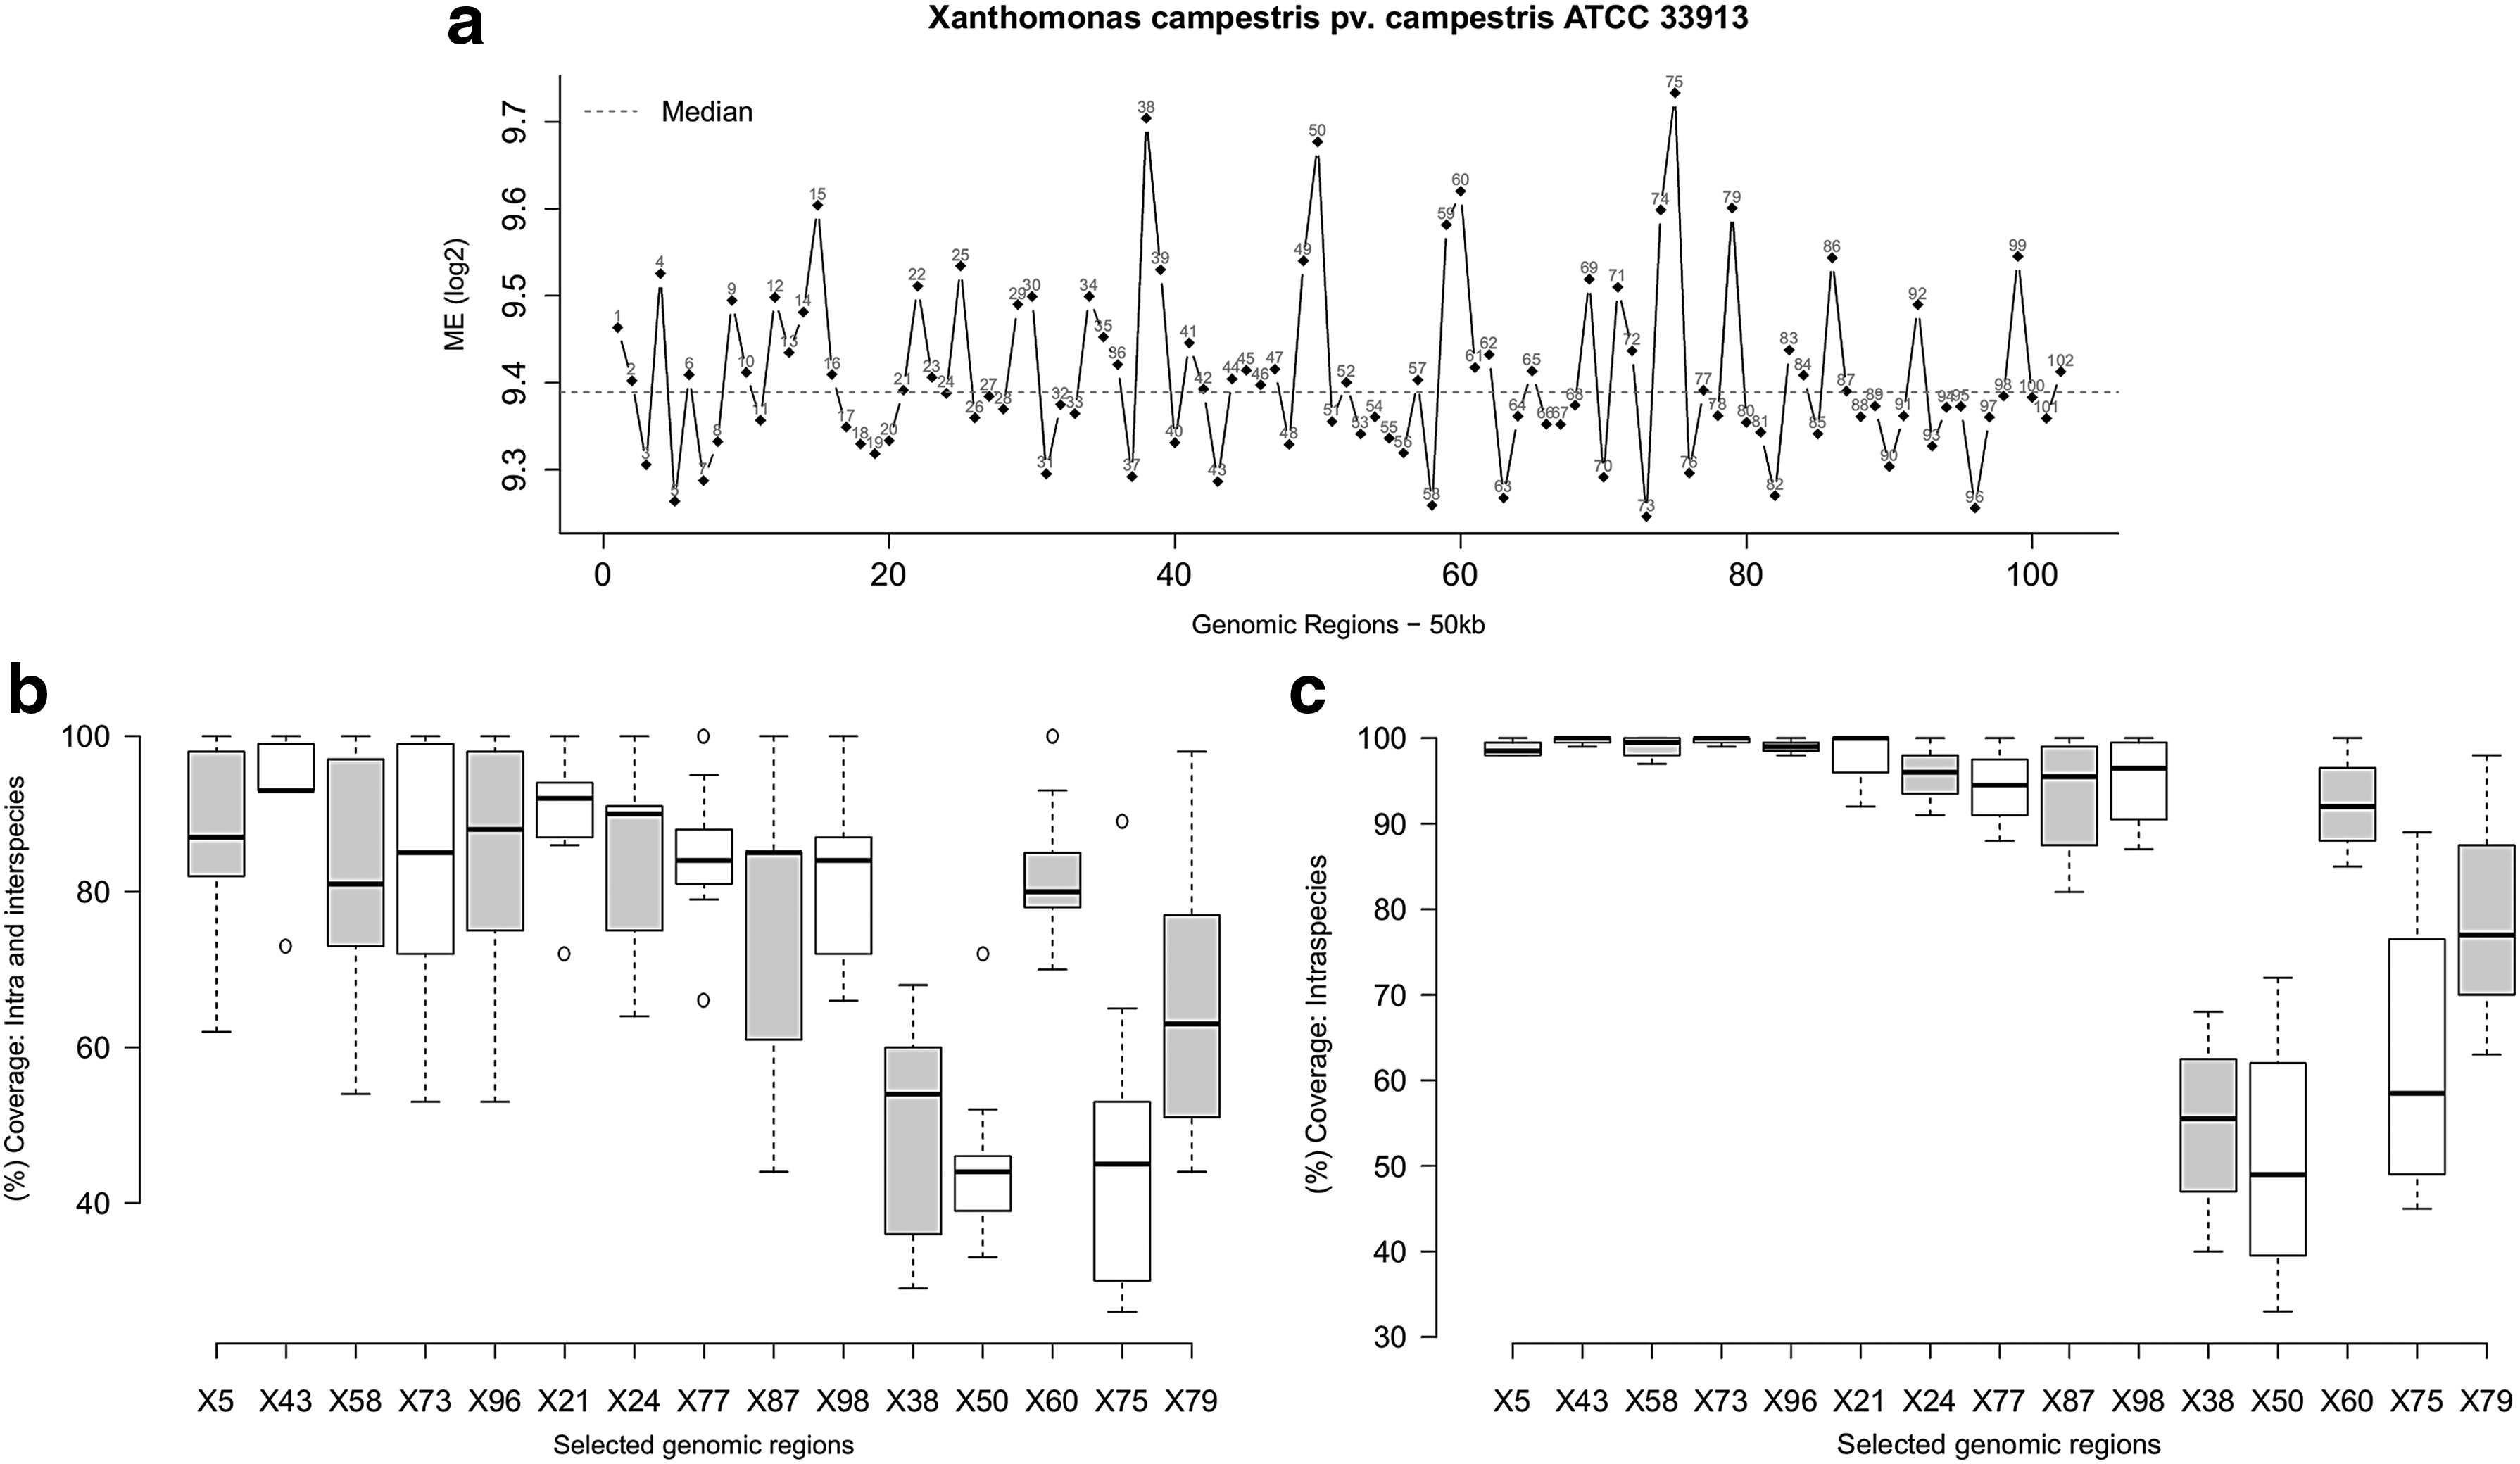
ME applied to Xanthomonas campestris pv. campestris ATCC 33913 (representative of genus Xanthomonas).
The percentage coverage of selected regions with low, median, and high ME values within other member species of the genus Xanthomonas (Fig. 5b) had, as expected, more variation within the genus than within organisms of the same species Xanthomonas campestris (Fig. 5c). Therefore, we can conclude that regions with low and median ME values are even more conserved within these bacteria. On the other hand, the selected coordinates with the highest ME values correspond to the regions (38, 50, 60, 75, 79) with the greatest degree of variation and less coverage within the species Xanthomonas campestris, which contain, among other landmarks, GIs, transposable elements, and phages (Lima et al., 2005, 2008).
Moreover, it was possible to point out some regions in XCC ATCC 33913, which had high ME values due to the presence of ribosomal genes, as in the case of regions 92 and 99 (Fig. 5a). Because of this, regions that seem more interesting should be further checked since they may not necessarily correspond to the specific characteristics of the respective organism. This situation has been reported in other studies. They found that rDNAs have a specific signature, unlike the host genome, being identified as atypical (Dufraigne et al., 2005). In our methodology, this problem can be solved for annotated genomes where a warning is given. Otherwise, all regions of interest should be carefully checked.
The case was the same when we analyzed the ME profiles from Bradyrhizobium sp. ORS 278, R. etli CFN 42, S. meliloti SM11, B. pseudomallei 1106a, H. influenzae Rd KW20, and P. aeruginosa DK2, where the genomic regions with high ME values had either the lowest coverage or the greatest variation among members of the same species and the same genus (Supplementary Fig. S4).
Particularly in the case of E. coli 536, the ME distribution presented the greatest variation throughout the genome (Supplementary Fig. S4). Despite this, most of the regions with ME values around the median are the most conserved (regions 33, 70, 83, and 94). This observation corroborates reports by previous studies about the members of this species. Interestingly, E. coli is one of the most diverse species of bacteria, with an equivalent of just 20% of the genome being common to all strains (Lukjancenko et al., 2010).
With this brief overview, we showed that the ME-based methodology reported herein may be a starting point in the analysis of genomes, directing the researcher to anomalous regions of potential scientific interest. The computational tool is easily operated, only requiring the target sequence, annotated or not, to be input in FASTA format and the results are derived fast.
4. Conclusions
The experimental results indicate that the proposed methodology, based on ME, is a suitable technique for analysis of individual genomes. In addition, it was possible to discriminate anomalous regions with ease and speed, without requiring previous annotation and comparison with other genomes. The ME method showed better results than the competing methods tested in terms of performance and execution time.
Such strategy may guide researchers in identification of potentially interesting target genomic regions so that research time and effort may be focused on a streamlined exploration of such sequences and the acquisition of important insights from them. Besides, it is the first time that ME is used to analyze bacterial genome sequences. Furthermore, ME can also be a novel approach in the early stages of analysis of newly sequenced genomes.
Footnotes
Acknowledgment
This work was supported by grants Fundação Araucaria (F.M.L.) and CNPq (F.M.L. and M.A.Van Sluys) and FAPESP to M.A.Van Sluys. G.A.B.-C. is the recipient of a PhD scholarship from CAPES (Coordenação de Aperfeiçoamento do Pessoal de Nível Superior).
Author Disclosure Statement
No competing financial interests exist.
References
Supplementary Material
Please find the following supplemental material available below.
For Open Access articles published under a Creative Commons License, all supplemental material carries the same license as the article it is associated with.
For non-Open Access articles published, all supplemental material carries a non-exclusive license, and permission requests for re-use of supplemental material or any part of supplemental material shall be sent directly to the copyright owner as specified in the copyright notice associated with the article.