
Abstract
Abstract
As the sequencing cost continued to drop in the past decade, RNA sequencing (RNA-seq) has replaced microarray to become the standard high-throughput experimental tool to analyze transcriptomic profile. As more and more datasets are generated and accumulated in the public domain, meta-analysis to combine multiple transcriptomic studies to increase statistical power has received increasing popularity. In this article, we propose a Bayesian hierarchical model to jointly integrate microarray and RNA-seq studies. Since systematic fold change differences across RNA-seq and microarray for detecting differentially expressed genes have been previously reported, we replicated this finding in several real datasets and showed that incorporation of a normalization procedure to account for the bias improves the detection accuracy and power. We compared our method with the popular two-stage Fisher's method using simulations and two real applications in a histological subtype (invasive lobular carcinoma) of breast cancer comparing PR+ versus PR− and early-stage versus late-stage patients. The result showed improved detection power and more significant and interpretable pathways enriched in the detected biomarkers from the proposed Bayesian model.
1. Introduction
G
Many studies have been conducted to compare the two platforms in various aspects. As one of the earliest studies to introduce RNA-sequencing into the field, Marioni et al. (2008) showed that RNA-seq was comparable to microarray in differential expression (DE) analysis between human kidney and liver samples. Sultan et al. (2008) further explored the performance of two platforms in the analysis of human HEK and B cells and found that RNA-seq was more sensitive than microarrays, where differentially expressed genes (DEGs) detected only by RNA-seq fell in the lowest range of expression levels. Other studies, though restricted by small sample size, reached similar conclusions by using different datasets under different scenarios (Bradford et al., 2010; Xiong et al., 2010; Su et al., 2011). As part of the third phase of large-scale MicroArray Quality Control Consortium (MAQC-III) launched by FDA (a.k.a. SEQC), Wang et al. (2014) conducted a comprehensive rat study to assess the concordance of RNA-seq and microarray by using a range of chemical treatment conditions. They found that RNA-seq outperformed microarray at detecting weakly expressed genes, and the concordance between the two platforms for detecting the number of DEGs depended on treatment effects and the abundance of genes.
Furthermore, they showed a systematic difference between log fold change (logFC) of RNA-seq and that of microarray for DEGs. Similar results have been reported in Robinson et al. (2015) that microarray was more systematically biased in DE analysis of low-intensity genes than RNA-seq, whereas the detection power of RNA-seq is more sensitive to the per-gene reading depth. In addition, they showed that the correlation between microarray and RNA-seq effect size was low for lowly expressed genes. The systematic difference in effect size between two platforms can be partially attributed to the ratio compression problem in microarray (i.e., the observed expression fold change is consistently underestimated) caused by inefficient hybridization (Draghici et al., 2006).
Meta-analysis in genomic research is a set of statistical tools that is used for combining multiple “-omics” studies of a related hypothesis and can potentially increase the detection power of individual studies. With the increasing availability of mRNA expression data sets, many transcriptomic meta-analysis methods for microarray and some for RNA-seq were developed in the past decade. As far as we know, no meta-analysis methods have been developed to jointly analyze the data from both microarray and RNA-seq yet. Considering the availability of both data types in the public domain, integration of the two platforms can potentially increase the detection power well by utilizing the advantages and overcoming the disadvantages of each platform. Particularly, the cross-platform meta-analysis method needs to adjust for the systematic bias in logFC between the two platforms, as pointed out earlier.
The most popular type of meta-analysis is a two-stage approach, where summary statistics such as p-value or effect size are first computed for each study and then, meta-analysis methods are used to combine the summary statistics (Tseng et al., 2012). One naive two-stage method that is used to perform cross-platform meta-analysis involves applying some state-of-the-art tools for DE analysis in each platform individually (e.g., edgeR or DESeq2 for RNA-seq and LIMMA or SAM for microarray) (Tusher et al., 2001; Smyth, 2005; Robinson et al., 2010; Love et al., 2014), and then combining the p-values by Fisher's or Stouffer's method (Fisher, 1925; Stouffer et al., 1949). Another alternative is to integrate raw data from all studies by using a joint stochastic model. These approaches have the potential to offer improved efficiency over the two-stage methods and, at the same time, retain the platform-specific features. Moreover, as one essential issue mentioned earlier, it is relatively simpler to adjust for the systematic bias in effect sizes between two platforms under an integrative framework than under a two-stage framework. The more flexible Bayesian methods are the most adequate to fit such joint hierarchical models.
Two Bayesian hierarchical models have been developed to meta-analyze multiple microarray datasets (Conlon et al., 2006; Scharpf et al., 2009). Ma et al. (2016) recently developed a full Bayesian hierarchical model to combine multiple RNA-seq count data. In this article, we will combine the existing models for microarray meta-analysis (Conlon et al., 2006; Scharpf et al., 2009) and RNA-seq meta-analysis (Ma et al., 2016) and propose a Bayesian hierarchical model to jointly analyze the data from the two platforms. To address the issue of systematic bias in effect size, we incorporated a normalization algorithm into our full model.
Ramasamy et al. (2008) presented seven key issues when conducting microarray meta-analysis, including identifying and extracting experimental data, preprocessing and annotating each dataset, matching genes across studies, statistical methods for meta-analysis, and final presentation and interpretation. When combining RNA-seq and microarray studies for meta-analysis, most preliminary steps and data preparation issues will similarly apply. In RNA-seq, preprocessing tools such as fastQC, tophat, and bedtools are instrumental for alignment and preparing expression counts for downstream analysis, and lumi and affy are very popular R packages for processing microarray from different array platforms. Genes can be matched across studies by using standard gene symbols from, for example, BioMart databases. In the remaining of this article, we assume that data collection, preprocessing, and gene matching have been carefully done for both platforms and we only focus on downstream meta-analytic modeling and interpretation.
In recent years, “Big data” research has rapidly become a hot topic that attracted extensive attention from academia, industry, and policy makers. In the field of genomics, the large amount of transcriptomic studies on both microarray and RNA-seq platforms has generated petabytes of data that constitute “Big data” from the perspective of scale and complexity. Our article proposed one analytic method under a Bayesian framework to jointly model and analyze such high-volume genomic big data and demonstrated improved biological findings. Bayesian methods have brought substantial benefits to big data research, and the high-speed computation nowadays has made these methods computationally effective and scalable with the big data.
This article is organized as follows. Section 2 describes the Bayesian hierarchical model as well as the embedded normalization algorithm and explains how we perform DE analysis based on Bayesian inference. In Section 3.1, we use simulation to demonstrate the benefits of our Bayesian model over two-stage methods after including the normalization algorithm. In Section 3.2, we apply our method to a histological subtype (invasive lobular carcinoma; “ILC”) of breast cancer samples, comparing early-stage versus late-stage patients as the first example, and comparing PR+ versus PR− as the second example. Final conclusion and discussion are provided in Section 4.
2. Methods
2.1. Notation
Throughout the article, we denote the platform indicator by
where G is the total number of genes, Nk is the sample size of study k, and K is the number of studies in the meta-analysis, including both platforms. The latent variable of interest
2.2. Bayesian hierarchical model
Figure 1 provides a graphical representation of the full Bayesian hierarchical model that we propose. Circles denote parameters that need to be updated, squares denote observed data or constants, and dashed circles denote auxiliary parameters. Each dashed rectangle includes all parameters in a single platform model, and the parameters outside both rectangles are the parameters to be shared across two platforms in the meta-analysis.

A graphical representation of the Bayesian hierarchical model. Circles denote variables to be updated in MCMC; squares denote constants; and dashed circles denote auxiliary parameters (e.g., for data augmentation). Solid arrows denote stochastic dependency; heavy dotted arrows denote deterministic dependency. Dashed rectangles denote the platforms. MCMC, Markov chain Monte Carlo.
For each individual study, we accommodate the widely used negative binomial regression model for RNA-seq and the linear regression model for microarray, respectively, as follows:
where
We then specify the prior distributions for
where
Here, we assume that the effect sizes are independent among the studies a priori (which is reasonable if there are no overlapping samples across studies), so
For the prior of dispersion parameter
where mk is assumed to follow normal prior
For the baseline expression
where
In addition to the informative parameters listed earlier, we introduce one auxiliary parameter
where PG refers to the Polya-Gamma distribution. The description given earlier fully defines the proposed Bayesian hierarchical model. The observed data are RNA-seq count or microarray intensity, the library size for RNA-seq samples, the phenotypic indicator, and the platform indicator
2.3. Normalization algorithm
Previous comparative studies on RNA-seq and microarray data found a systematic difference in logFC between the two platforms (Wang et al., 2014; Robinson et al., 2015), where RNA-seq always has a larger absolute logFC than microarray. To adjust for this inherent cross-platform bias in our full model, we hereby introduce a simple normalization algorithm:
where
• Normalization works by adding constant normalization factor to the effect size estimates of microarray, which is usually underestimated due to inefficient hybridization. The new estimates become more commensurate to that of RNA-seq while updating the grand mean.
• A normalization algorithm can be potentially incorporated into a two-stage effect size model. The effectiveness of normalization in such a scenario needs to be further explored and is beyond the scope of this article. Note that the normalization is infeasible for the two-stage Fisher's method since it involves the combination of p-values.
• For the ILC example in our application, there is only one RNA-seq study, so we will just use that study as the reference. In the case when there are multiple RNA-seq studies present, we will choose the study with the largest sample size, whose logFC estimates are more reliable (with smaller variability).
2.4. Evidence for necessity of normalization
We give three examples to show the necessity of performing normalization and demonstrate our normalization algorithm, using three publicly available datasets (GSE11045, GSE5350, GSE65365) from previous studies (Marioni et al., 2008; Su et al., 2011; Robinson et al., 2015). Each study consists of the same samples measured by both RNA-seq and microarray from humans, rats, and yeast, respectively. We first selected a list of candidate genes by using an absolute logFC threshold of 0.5 in all three studies. In Figure 2, we showed the boxplots of logFC in the two platforms separately for upregulated and downregulated genes selected. As we can see, RNA-seq has a significantly larger absolute logFC than microarray in Marioni and Su's data for both upregulated and downregulated genes
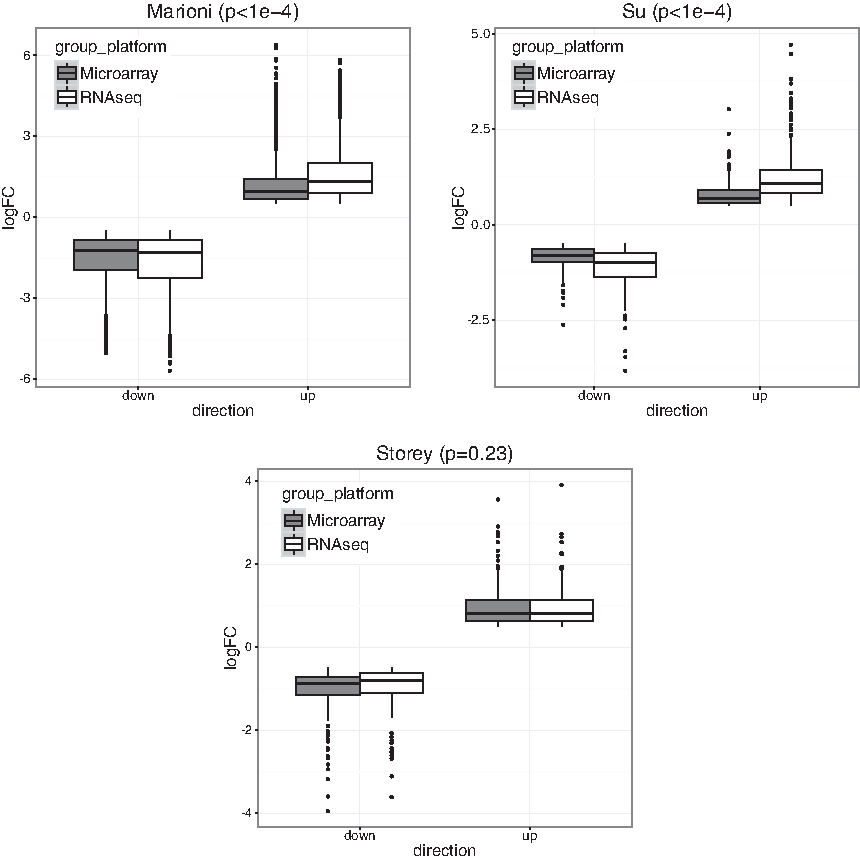
Boxplot of logFC from either microarray or RNA-seq in three public studies, separately for upregulated or downregulated genes. p-Values from the linear model are attached to each plot. logFC, log fold change; RNA-seq, RNA sequencing.
2.5. Inference for differential expression
In the Bayesian literature, Newton et al. (2004) proposed a direct approach to control FDR and defined a Bayesian false discovery rate as follows:
where
For a fair comparison with the other frequentist meta-analysis methods (e.g., Fisher's method), we adopt a union-intersection hypothesis (a.k.a. conjunction hypothesis) setting by following Li et al. (2011):
2.6. Methods for comparison
Since no other cross-platform meta-analysis methods for integrating microarray and RNA-seq have been proposed, we will compare our method with three widely used two-stage methods in this article: Fisher's method with edgeR (for RNA-seq) and limma (for microarray) used in single-study DE analysis, the fixed effect model (FEM), and the random effect model (REM) (Fisher, 1925; Choi et al., 2003) with single-study logFC and variance estimated by DESeq2 (for RNA-seq) and limma (for microarray). The meta-analyzed p-values are then adjusted for multiple comparison by the Benjamini-Hochberg procedure (Benjamini and Hochberg, 1995).
3. Results
3.1. Simulation
3.1.1. Simulation setting
In this section, we provide one simulation example to show the benefits of the Bayesian integrative method over the other two-stage methods, especially after the inclusion of the normalization algorithm. To mimic the real data, we randomly picked up 2000 genes from the TCGA-BRCA study (which includes both RNA-seq and microarray data) and used the estimated baseline expression (i.e.,
3.1.2. Simulation results
We compared our Bayesian method with and without the normalization scheme (BayesNorm and Bayes, respectively) with the three two-stage meta-analysis methods: Fisher's method, FEM, and REM. For a fair comparison, we assessed the power by plotting the number of detected true positives against the top number of declared DE genes in each method. As we can see from Figure 3, the full Bayesian model with the normalization algorithm detected more true DE genes than any of the other four methods among the declared DE genes. In addition, the BayesNorm method was also more accurate than the other methods (ROC and PR curves shown in the Supplementary Data). Note that even though both our method and the FEM/REM methods were effect size based, the integrative model was more powerful than the two-stage methods since two-stage approaches involve data reduction and theoretically lose efficiency.

Power comparison of different methods in simulation. All genes are ordered by the significance levels; the number of true positives among the top declared DE genes are compared. Triangle is the Bayesian method with normalization algorithm added; star is without the normalization algorithm; circle is Fisher's method; and + and x are fixed effect model and random effect model, respectively. DE, differential expression.
3.2. Application
3.2.1. Data description
We applied the proposed model to two real datasets of ILC breast cancer. ILC is the second most frequently diagnosed histological subtype of invasive breast cancer, consisting of ∼10%–15% of all cases. As opposed to the most frequent invasive ductal carcinoma, ILC is less studied in its molecular mechanism, thus providing limited insight into the biological characteristics of the disease. In general, ILC cases usually express estrogen receptors (ER) but show no over-expression for HER2 protein (Ciriello et al., 2015). Here, we collected one RNA-seq dataset from the TCGA-BRCA study (Network et al., 2012), one microarray dataset from METABRIC (Curtis et al., 2012), one microarray dataset from Sotiriou study (Metzger-Filho et al., 2013), and a combination of four microarray datasets from the GEO repository (GSE2109, GSE21653, GSE5460, GSE5764). Here, the four Gene Expression Omnibus (GEO) studies contained four microarray datasets using Affymetrix U133 Plus 2.0, all of which are of a small sample size. As a result, we obtained the raw data (CEL files) for simultaneous preprocessing and directly merged all qualified samples as the fourth study. All ILC samples used in the analysis are restricted to ER+ only. A summary of the ILC studies used in this article can be found in the Supplementary Data.
In the first example, we aim at identifying biomarkers that are differentially expressed between early- and late-stage ILC breast cancer. To avoid confusing or erroneous tumor staging, we regarded pathological stages 0 and 1 as early stages and stages 3 and 4 as late stages and excluded the intermediate stage 2. Taking the stage information into account, we collected 69
In the second example, we aim at identifying biomarkers that are differentially expressed between progesterone-receptor-positive (PR+) and progesterone-receptor-negative (PR−) ILC breast cancer. Taking the PR information into account, we collected 162
3.2.2. ILC stage example
As described in Section 2.3, for stage data, we first took genes with an absolute logFC greater than 0.2 in at least three studies and used them to calculate the normalization factor. In Figure 4A, we noticed a significant difference in logFC between the TCGA RNA-seq study and the first two microarray studies

We applied five approaches (Bayes, BayesNorm, Fisher, FEM, and REM) to the ILC stage example. As shown in Table 1, the Bayesian method without normalization detected 267 DE genes at q < 0.05. With normalization, there were 279 DE genes detected. Both Bayesian models were more powerful than the two-stage methods. We selected three representative genes that benefited from normalization (Table 2). The logFC and standard error (in the parentheses) obtained from DESeq2 or limma are shown for all four studies. Without normalization, these genes are only marginally significant. After normalization, the significance level has been increased, showing the necessity of normalization. “GLYATL2” is a gene coding for transferase that produces N-acyl glycines in humans, and it has been found to be differentially expressed across different breast cancer subtypes (Milioli et al., 2015). “FOSB” is an oncogene belonging to the FOS family and it has been implicated as a regulator of cell proliferation, differentiation, and transformation. Previous studies found that this gene was downregulated in poorly differentiated breast carcinomas (Milde-Langosch et al., 2003). “KCNQ5” gene is a member of the KCNQ potassium channel gene family that yields currents that activate slowly with depolarization, and recent review papers have regarded them as potential biomarkers for various types of cancer, including breast cancer, glioblastoma and colorectal cancer (Lastraioli et al., 2015).
FEM, fixed effect model; ILC, invasive lobular carcinoma; REM, random effect model.
logFC, log fold change.
For the 279 DE genes detected by BayesNorm at q < 0.05, we further performed a single-platform DE analysis by using the Bayesian model and compared the significance levels of the two platforms. Overall, RNA-seq is more significant than microarray in this dataset, as shown in Figure 5A. Further, we found that for genes with lower RPKM (i.e., lowly expressed genes), RNA-seq is even more significant than microarray. This is consistent with the features of the two technologies: RNA-seq has a wider detection range and delivers low background signals, whereas microarray has a detection limit in the lower end.

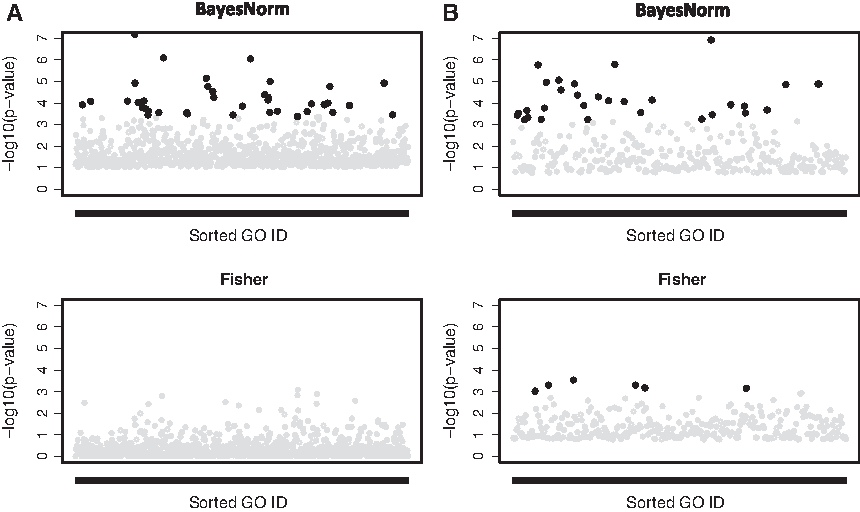
To associate the detected biomarkers with the biological functions, we further performed pathway enrichment analysis by using Fisher's exact test. For a fair comparison, we used the top 500 genes identified from BayesNorm and Fisher's method for ILC data (FEM and REM are excluded due to too weak signals). For Fisher's method, this roughly corresponded to a q-value cutoff at 0.15. In Figure 6A, controlling FDR at 0.05, we identified 37 significant GO pathways from the BayesNorm method, whereas no significant pathways were identified from the Fisher's method. Intriguingly, we identified many cell fate and lineage pathways to be differentially activated on comparing early- and late-stage ILC tumors (see pathway enrichment q-values and odds ratios in Table 3). Genes include members of the HOX and NKX gene family, SOX genes, EYA1, and others. This finding implies that early- and late-stage ILC tumors might have different precursors, or that significant changes in differentiation pathways contribute to progression of the disease.
3.2.3. ILC PR example
For ILC PR data, we took genes with an absolute logFC greater than 0.2 in at least three studies and used them to calculate the normalization factor. In Figure 4B, we noticed a significant difference in logFC between the TCGA RNA-seq study and the first two microarray studies
As shown in Table 1, the Bayesian method with normalization detected 549 DE genes at q < 0.05 whereas Fisher's method only detected 262. We also selected two representative genes with an increased significance level after normalization (Table 4) and among them, for example, PTPRD is a tumor suppressor that is frequently inactivated in human cancers and has been identified to predict for poor prognosis in breast cancer (Veeriah et al., 2009). For the 549 DE genes detected by BayesNorm at q < 0.05, we further performed a single-platform DE analysis by using the Bayesian model and compared the significance levels of the two platforms. As shown in Figure 5B, similar to that in the stage example, RNA-seq is more significant than microarray for genes with lower RPKM. For the PR example, there are 30 GO pathways identified by the Bayesian method and 6 GO pathways identified by Fisher's method at an FDR cutoff of 0.05 (Fig. 6B). As shown in Table 5, our pathway analysis showed a significant enrichment of genes involved in proteolysis and regulation of peptidase activity. These include many members of the serpin family, such as SERPINB5, SERPINA3, and SERPINA1. These proteins are inhibitors of serine proteases, and they are known to mediate breast cancer cell invasion and metastases; some of the genes have been shown to be strong predictive biomarkers (Duffy et al., 2014).
4. Discussion and Conclusion
In this article, we proposed a Bayesian hierarchical model to meta-analyze gene expression data generated from two popular transcriptome profiling platforms: microarray and RNA-seq. Within each platform, we adopted a negative binomial model for RNA-seq and a linear model for microarray and we allowed the information integration of effect sizes across platforms among DE genes. An additional normalization algorithm was embedded in the Bayesian model to correct for the systematic cross-platform bias in effect sizes, as shown in previous studies and in the examples provided in our article. To the best of our knowledge, the proposed model is the first cross-platform joint model for integrating microarray and RNA-seq transcriptomic data. Through simulation, we found that normalization was necessary and had increased the detection power of biomarkers. The application to ILC breast cancer data showed the advantage of our model in identifying DE genes compared with the two-stage methods, such as Fisher's method or the FEM/REMs, and identified DE genes were validated by functional annotation (pathway) analysis.
During the analysis, we found that RNA-seq was more powerful than microarray for lowly expressed genes. Similar findings have been shown in previous comparative studies (Sultan et al., 2008; Su et al., 2011; Wang et al., 2014). Using a comprehensive study design with 15 chemical treatments, Wang et al. (2014) showed that the concordance between two platforms dropped to below 40% for genes with below median expression, and a direct comparison to quantitative polymerase chain reaction (qPCR) results indicated a better performance of RNA-seq in detecting differential gene expression at low expression levels than microarray. These results are consistent with the pros and cons of the two technologies, where RNA-seq has a wider detection range and delivers low background signals; whereas, on the other hand, microarray has a detection limit in the lower end. Though no advantage of microarray has been found in our application examples, we expect that microarray would be more powerful than RNA-seq in detecting DE genes with short lengths, considering the transcript length bias of RNA-seq.
Many studies have previously reported the systematic difference in logFC between the two platforms (Wang et al., 2014; Robinson et al., 2015). In this article, we reproduced the results by using the same datasets and suggested that this difference was quite universal. More specifically, RNA-seq tend to have consistently larger absolute values of logFC than microarray under the same set of DE genes. Thus, to adjust for the difference, we introduced a simple normalization algorithm into the Bayesian model by taking the median difference of absolute logFC of representative genes between the two platforms as a constant normalization factor. Other normalization algorithms such as using adaptive normalization factor (e.g., varies according to expression levels, etc.) can also apply. In the ILC data application, the normalization algorithm increased the significance levels of some DE genes that were otherwise underpowered due to the logFC difference.
Compared with other methods, the Bayesian method has a few benefits. First, it is relatively flexible to incorporate the normalization algorithm under the Bayesian framework. Since the Bayesian estimation is sampling based (MCMC), the normalization factor can be directly put into the updating functions; second, our Bayesian model includes a latent DE indicator, an individual effect size parameter, and the overall effect size parameter. With this setting, the underpowered study/platform will be down-weighted automatically for some genes in a sense that its individual effect size will less likely contribute to the overall effect size. Such an analysis that allows heterogeneity is relatively hard to achieve in a two-stage scenario. Third, under the Bayesian method, we can allow the information of dispersion parameters to be shared across genes, which is fairly important in the entity of dispersion estimation.
There exist different “platforms” for both microarray and RNA-seq technologies. For example, in microarray, data can be generated from Illumina platform, Affymetrix platform, etc.; whereas in RNA-seq, the most popular platform is Ilumina, which generates 95% of all sequencing data stored in the GEO repository. Each platform has its own technical characteristics and protocol for handling and processing data. While combining microarray and RNA-seq, our Bayesian model only considers a single platform from each technology. It can be readily extended to accommodate the multi-platform scenarios by including random effects or one more layers to explain for accounting for the cross-platform difference within each technology.
Since the advent of next-generation sequencing technology, RNA-seq has gradually become a standard experimental technique in measuring RNA expression levels while taking the place of traditional microarray technology. However, the large availability of historical microarray datasets in the GEO repository gives us a good reason of utilizing microarray, in addition to RNA-seq in the DE analysis. Some of our findings in comparing the two platforms were consistent, with the results reported from the third phase of MicroArray Quality Control (MAQC) project (a.k.a. SEQC) initiated by FDA (Consortium et al., 2014; Wang et al., 2014).
One limitation of our current method is that the normalization factors were estimated a priori and inserted into the Bayesian full model. Joint estimation of these parameters inside the model could be considered a potential extension in the future. Second, our model failed to take gene lengths into account, which could be considered one potential factor that will affect the detection power of different platforms. Our core MCMC updating algorithms were written in C++, and Rcpp was used to integrate the C++ codes into R. An R package, CBM (“Cross-platform Bayesian Model”), is publicly available to perform the analysis on the author's website (http://tsenglab.biostat.pitt.edu/software.htm).
Footnotes
Acknowledgments
The authors would like to thank Dr. Christos Sotiriou for sharing the data from his ILC study with them. Research reported in this publication was supported by NCI of the National Institutes of Health under award number R01CA190766 to T.M. and G.C.T. Dr. Steffi Oesterreich's studies on ILC are supported by BCRF and Susan G Komen Foundation.
Author Disclosure Statement
No competing financial interests exist.
References
Supplementary Material
Please find the following supplemental material available below.
For Open Access articles published under a Creative Commons License, all supplemental material carries the same license as the article it is associated with.
For non-Open Access articles published, all supplemental material carries a non-exclusive license, and permission requests for re-use of supplemental material or any part of supplemental material shall be sent directly to the copyright owner as specified in the copyright notice associated with the article.