Statistical approaches for population structure estimation have been predominantly driven by a particular data type, single-nucleotide polymorphisms (SNPs). However, in the presence of weak identifiability in SNPs, population structure estimation can suffer from undesirable accuracy loss. Copy number variations (CNVs) are genomic structural variants with loci that are commonly shared within a specific population and thus provide valuable information for estimation of the ancestry of sampled populations. We develop a Bayesian joint modeling framework of SNPs and CNVs, called POPSTR, to better understand population structure than approaches that use SNPs solely. To deal with the increased data volume, we use the Metropolis Adjusted Langevin algorithm (MALA) that guides the target distribution in a computationally efficient way. We illustrate applications of our approach using the HapMap 2005 project data. We carry out simulation studies and show that the performance of our approach is comparable or better than that of popular benchmarks, STRUCTURE and ADMIXTURE. We also observe that using only CNVs can be remarkably efficient if SNP data are not available.
1. Introduction
Genome-wide association studies (GWAS) have played a significant role in discovering common genetic variants that are associated with and provide insights into disease risks and outcomes. Previous GWAS efforts, however, have sometimes led to spurious discoveries due to underlying admixture in populations that could substantially confound the true association signals between genetic factors and disease traits (Campbell et al., 2005; Tian et al., 2008). In this study, we define an admixed population as a population that arose from interbreeding between multiple ancestral populations. To overcome the problem of underlying admixed population structures, several in silico ancestry estimation tools applicable in the population genetic framework have been developed (Pritchard et al., 2000; Price et al., 2006; Raj et al., 2014).
Recently developed ancestry estimation tools have primarily used a single source of data, single-nucleotide polymorphisms (SNPs). Several of these approaches have been developed based on principal components analysis (PCA), owing to computational efficiency and lack of need to specify the number of ancestral populations (Patterson et al., 2006; Price et al., 2006, 2008; Novembre and Stephens, 2008). The PCA-based approaches yield low-dimensional principal components that provide information for clustering of individuals or for the proximity based on ancestry. However, they are not useful when scientific interest lies in estimating ancestry admixture coefficients or population-specific genotype frequencies. In contrast, likelihood-based methods explicitly focus on individual-scale allele frequency problems. Since Pritchard et al. (2000) proposed their seminal model STRUCTURE, the extension of the likelihood-based population models has been widely proposed.
For instance, Falush et al. (2003) proposed a solution to address linkage disequilibrium (LD) in the STRUCTURE framework. Tang et al. (2005) proposed FRAPPE, which incorporated the expectation maximization (EM) algorithm. ADMIXTURE (Alexander et al., 2009) further optimized FRAPPE by using a fast block relaxation to accelerate the likelihood optimization process in a computationally efficient way. Their performances in estimating admixture proportions are comparable to each other (Alexander et al., 2009). Follow-up work to STRUCTURE, fastSTRUCTURE (Raj et al., 2014), introduced a variational Bayesian framework, analogous to the EM algorithm, to quickly optimize the likelihood and used F priors to deal with a weakly identifiable population structure. Comprehensive reviews of a class of STRUCTURE-based approaches and software can be found in Porras-Hurtado et al. (2013).
Next-generation sequencing technologies are now becoming commonplace in genomic research due to advances in sequencing technologies and decreasing costs. They enable the sequencing of multiple genetic variants, including copy number variations (CNVs), which refer to deletions, duplications, or loss-of-heterogeneity of chromosomal segments, and are known to commonly arise at specific loci in a given population. This makes CNVs a valuable source of data in population structure research. For example, CNVs in certain regions have been shown to be associated with specific population ancestries (Redon et al., 2006; Jakobsson et al., 2008; Conrad et al., 2009; Catarina et al., 2011; Pronold et al., 2012). In our own empirical studies, CNVs have often been shown to be more informative or provide different views in ancestral clustering based on PCA. Motivated by this fact, we would like to explore whether the use of CNVs alone or the integration of CNV and SNP data can offer better insights in fine-scale population structure inference than approaches based on SNPs alone.
To the best of our knowledge, no population structure tools have considered the combination of genome-wide CNV and SNP data. Colobran et al. (2008) attempted to combine CNVs and SNPs in the specific gene CCL4L, although not for population structure inference. McCarroll et al. (2008) integrated SNPs and CNVs to create accurate CNV maps regarding population genetic properties, but did not fully address the statistical properties of ancestral population estimation. In this article, we developed a Bayesian joint model, POPSTR, that integrates the two types of genomic measurements—SNPs and CNVs—from individual samples, to more accurately differentiate population ancestries. The integrated likelihood optimization is expected to better identify the global maximum of the likelihood via bypassing potential confounders or local maxima in the estimation of admixture. In particular, this integration can help us resolve a situation where signals from SNPs are relatively weak compared with those from CNVs, or there is severe LD in SNPs (Gattepaille and Jakobsson, 2013).
A key challenge lies in optimizing the joint likelihood for the increased volume of data while preserving computational efficiency. Conventional Bayesian inferences based on the standard MCMC approach usually require a long queue of Markov chain Monte Carlo (MCMC) iterations to reach stochastic convergence. STRUCTURE, for instance, is set to 10,000 iterations as a default. The necessary number of iterations is often undesirably large when the signals from the data are weak or multiple local maxima are present. In addition, the enormous number of parameters derived from individual admixture and population-specific loci could lead to unduly high computational expenses. Our proposed method is designed to accelerate the convergence of parameters and seek global maximum with a smaller number of MCMC iterations. This computational efficiency gain is achievable via the Metropolis Adjusted Langevin algorithm (MALA) (Roberts and Tweedie, 1996) that considers the Langevin diffusion that converges to the target distribution at an exponential rate given a certain condition. We further accelerate this by using adaptive MCMC sampling that adjusts the step size in the proposal and by parallel programming.
The rest of the article is organized as follows. In Section 2, we describe our proposed joint model that uses both SNPs and CNVs in detail. Then, the prior distribution and posterior sampling procedures under the MALA are introduced. In Section 3, we present a comparison with alternative methods in simulation studies. We apply POPSTR to real data and demonstrate the performance of POPSTR compared with those of STRUCTURE and ADMIXTURE in Section 4. We conclude our work with a brief discussion in Section 5.
2. Model Specification
Consider SNP genotype data at a biallelic locus that takes three possible values (AA, AB, and BB), where “A” represents the major allele and “B” represents the minor allele, from \documentclass{aastex}\usepackage{amsbsy}\usepackage{amsfonts}\usepackage{amssymb}\usepackage{bm}\usepackage{mathrsfs}\usepackage{pifont}\usepackage{stmaryrd}\usepackage{textcomp}\usepackage{portland, xspace}\usepackage{amsmath, amsxtra}\usepackage{upgreek}\pagestyle{empty}\DeclareMathSizes{10}{9}{7}{6}\begin{document}
$$i = 1 , \ldots , I$$
\end{document} individuals and \documentclass{aastex}\usepackage{amsbsy}\usepackage{amsfonts}\usepackage{amssymb}\usepackage{bm}\usepackage{mathrsfs}\usepackage{pifont}\usepackage{stmaryrd}\usepackage{textcomp}\usepackage{portland, xspace}\usepackage{amsmath, amsxtra}\usepackage{upgreek}\pagestyle{empty}\DeclareMathSizes{10}{9}{7}{6}\begin{document}
$$j = 1 , \ldots , J$$
\end{document} loci. Each individual is assumed to inherit his/her genotypes from K ancestral populations where K is usually unknown. For individual i, the contribution of population k to the genotype is denoted by \documentclass{aastex}\usepackage{amsbsy}\usepackage{amsfonts}\usepackage{amssymb}\usepackage{bm}\usepackage{mathrsfs}\usepackage{pifont}\usepackage{stmaryrd}\usepackage{textcomp}\usepackage{portland, xspace}\usepackage{amsmath, amsxtra}\usepackage{upgreek}\pagestyle{empty}\DeclareMathSizes{10}{9}{7}{6}\begin{document}
$${q_{ik}}$$
\end{document} for \documentclass{aastex}\usepackage{amsbsy}\usepackage{amsfonts}\usepackage{amssymb}\usepackage{bm}\usepackage{mathrsfs}\usepackage{pifont}\usepackage{stmaryrd}\usepackage{textcomp}\usepackage{portland, xspace}\usepackage{amsmath, amsxtra}\usepackage{upgreek}\pagestyle{empty}\DeclareMathSizes{10}{9}{7}{6}\begin{document}
$$k = 1 , \ldots , K$$
\end{document}. The frequency of the major allele at SNP j in population k is represented by \documentclass{aastex}\usepackage{amsbsy}\usepackage{amsfonts}\usepackage{amssymb}\usepackage{bm}\usepackage{mathrsfs}\usepackage{pifont}\usepackage{stmaryrd}\usepackage{textcomp}\usepackage{portland, xspace}\usepackage{amsmath, amsxtra}\usepackage{upgreek}\pagestyle{empty}\DeclareMathSizes{10}{9}{7}{6}\begin{document}
$${f_{kj}}$$
\end{document}. Let \documentclass{aastex}\usepackage{amsbsy}\usepackage{amsfonts}\usepackage{amssymb}\usepackage{bm}\usepackage{mathrsfs}\usepackage{pifont}\usepackage{stmaryrd}\usepackage{textcomp}\usepackage{portland, xspace}\usepackage{amsmath, amsxtra}\usepackage{upgreek}\pagestyle{empty}\DeclareMathSizes{10}{9}{7}{6}\begin{document}
$$\textbf{\textit{N}}{ \kern 1pt} { \kern 1pt} = \{ {n_{ij}} \vert i = 1 , \ldots , I , j = 1 , \ldots , J \} $$
\end{document} be a set of the observed number of copies of the major allele for each SNP j from individual i. Thus, \documentclass{aastex}\usepackage{amsbsy}\usepackage{amsfonts}\usepackage{amssymb}\usepackage{bm}\usepackage{mathrsfs}\usepackage{pifont}\usepackage{stmaryrd}\usepackage{textcomp}\usepackage{portland, xspace}\usepackage{amsmath, amsxtra}\usepackage{upgreek}\pagestyle{empty}\DeclareMathSizes{10}{9}{7}{6}\begin{document}
$${n_{ij}}$$
\end{document} takes a value among 0 (BB), 1 (AB), and 2 (AA) for all SNPs. A prescreening step removes loci with deletions or duplications. As with the SNP likelihood in STRUCTURE and ADMIXTURE, the multinomial distribution of trinary SNP genotypes at marker j for individual i can be constructed via three probabilities under the binomial distribution:
\documentclass{aastex}\usepackage{amsbsy}\usepackage{amsfonts}\usepackage{amssymb}\usepackage{bm}\usepackage{mathrsfs}\usepackage{pifont}\usepackage{stmaryrd}\usepackage{textcomp}\usepackage{portland, xspace}\usepackage{amsmath, amsxtra}\usepackage{upgreek}\pagestyle{empty}\DeclareMathSizes{10}{9}{7}{6}\begin{document}
\begin{align*}
\begin{split} & Pr ( {n_{ij}} = 0 \vert { \kern 1pt} { \kern 1pt} \textbf{\textit{Q}}{ \kern 1pt} { \kern 1pt} , \textbf{\textit{F}} , K ) = { \left\{ { \mathop \sum \limits_k {q_{ik}} ( 1 - {f_{kj}} ) } \right\} ^2} , \\ & Pr ( {n_{ij}} = 1 \vert { \kern 1pt} { \kern 1pt} \textbf{\textit{Q}} , { \kern 1pt} \textbf{\textit{F}}{ \kern 1pt} , K ) = 2 \left\{ { \mathop \sum \limits_k {q_{ik}} ( 1 - {f_{kj}} ) } \right\} \left\{ { \mathop \sum \limits_k {q_{ik}}{f_{kj}}} \right\} , \\ & Pr ( {n_{ij}} = 2 \vert { \kern 1pt} \textbf{\textit{Q}}{ \kern 1pt} , \textbf{\textit{F}}{ \kern 1pt} , K ) = { \left\{ { \mathop \sum \limits_k {q_{ik}}{f_{kj}}} \right\} ^2}.\end{split}
\tag{1}
\end{align*}
\end{document}
where Q and F are matrices: \documentclass{aastex}\usepackage{amsbsy}\usepackage{amsfonts}\usepackage{amssymb}\usepackage{bm}\usepackage{mathrsfs}\usepackage{pifont}\usepackage{stmaryrd}\usepackage{textcomp}\usepackage{portland, xspace}\usepackage{amsmath, amsxtra}\usepackage{upgreek}\pagestyle{empty}\DeclareMathSizes{10}{9}{7}{6}\begin{document}
$$\textbf{\textit{Q}}{ \kern 1pt} { \kern 1pt} = \{ {q_{ik}} \} _{i , k}^{I , K}$$
\end{document} and \documentclass{aastex}\usepackage{amsbsy}\usepackage{amsfonts}\usepackage{amssymb}\usepackage{bm}\usepackage{mathrsfs}\usepackage{pifont}\usepackage{stmaryrd}\usepackage{textcomp}\usepackage{portland, xspace}\usepackage{amsmath, amsxtra}\usepackage{upgreek}\pagestyle{empty}\DeclareMathSizes{10}{9}{7}{6}\begin{document}
$$\textbf{\textit{F}}{ \kern 1pt} { \kern 1pt} = \{ {f_{kj}} \} _{k , j}^{K , J}$$
\end{document}. The above specification is valid when the Hardy-Weinberg equilibrium (HWE) holds. In this sense, the screening of SNP loci that deviate from the HWE is essential during the initial quality screening to reduce possible systematic errors. Details are presented later.
Similarly, let \documentclass{aastex}\usepackage{amsbsy}\usepackage{amsfonts}\usepackage{amssymb}\usepackage{bm}\usepackage{mathrsfs}\usepackage{pifont}\usepackage{stmaryrd}\usepackage{textcomp}\usepackage{portland, xspace}\usepackage{amsmath, amsxtra}\usepackage{upgreek}\pagestyle{empty}\DeclareMathSizes{10}{9}{7}{6}\begin{document}
$$\textbf{\textit{V}}{ \kern 1pt} { \kern 1pt} = \{ {v_{il}} \vert i = 1 , \ldots , I , l = 1 , \ldots , L \} $$
\end{document} represent a set of dichotomous variables \documentclass{aastex}\usepackage{amsbsy}\usepackage{amsfonts}\usepackage{amssymb}\usepackage{bm}\usepackage{mathrsfs}\usepackage{pifont}\usepackage{stmaryrd}\usepackage{textcomp}\usepackage{portland, xspace}\usepackage{amsmath, amsxtra}\usepackage{upgreek}\pagestyle{empty}\DeclareMathSizes{10}{9}{7}{6}\begin{document}
$${v_{il}}$$
\end{document} that take the value 1 if a CNV is present and 0 otherwise, at locus l and individual i. The probability of a CNV at locus l in population k is represented by \documentclass{aastex}\usepackage{amsbsy}\usepackage{amsfonts}\usepackage{amssymb}\usepackage{bm}\usepackage{mathrsfs}\usepackage{pifont}\usepackage{stmaryrd}\usepackage{textcomp}\usepackage{portland, xspace}\usepackage{amsmath, amsxtra}\usepackage{upgreek}\pagestyle{empty}\DeclareMathSizes{10}{9}{7}{6}\begin{document}
$${c_{kl}}$$
\end{document}, with the matrix \documentclass{aastex}\usepackage{amsbsy}\usepackage{amsfonts}\usepackage{amssymb}\usepackage{bm}\usepackage{mathrsfs}\usepackage{pifont}\usepackage{stmaryrd}\usepackage{textcomp}\usepackage{portland, xspace}\usepackage{amsmath, amsxtra}\usepackage{upgreek}\pagestyle{empty}\DeclareMathSizes{10}{9}{7}{6}\begin{document}
$$\textbf{\textit{C}}{ \kern 1pt} { \kern 1pt} = \{ {c_{kl}} \} _{k , l}^{K , L}$$
\end{document}. The rationale behind using dichotomous CNVs rather than the actual copy number, which is ordinal, is empirically supported by our exploratory analysis, for which we used PCA of CNVs derived from three different scales: ordinal with more than three categories (raw), trinary (insertion, deletion, none), and binary (variation or none). The result in Supplementary Figure S1 suggests comparable performances across the three scenarios, thereby making the simpler binary coding for CNV a reasonable choice for population structure analyses. In addition, the copy number gain (1%) is a relatively rare event compared to the loss (∼12%), which further supports the binary coding of copy numbers. This simple coding can also reduce potential misclassification where one population has bilateral CNVs, that is, an insertion and a deletion at a specific locus. Thus, we assume the Bernoulli model with a probability of whether or not the CNV occurs:
\documentclass{aastex}\usepackage{amsbsy}\usepackage{amsfonts}\usepackage{amssymb}\usepackage{bm}\usepackage{mathrsfs}\usepackage{pifont}\usepackage{stmaryrd}\usepackage{textcomp}\usepackage{portland, xspace}\usepackage{amsmath, amsxtra}\usepackage{upgreek}\pagestyle{empty}\DeclareMathSizes{10}{9}{7}{6}\begin{document}
\begin{align*}
\begin{split} & Pr ( {v_{il}} = 1 \vert { \kern 1pt} \textbf{\textit{Q}}{ \kern 1pt} , \textbf{\textit{C}}{ \kern 1pt} , K ) = \mathop \sum \limits_k {q_{ik}}{c_{kl}} , \\ &Pr ( {v_{il}} = 0 \vert { \kern 1pt} \textbf{\textit{Q}}{ \kern 1pt} , { \kern 1pt} \textbf{\textit{C}} , K ) = \mathop \sum \limits_k {q_{ik}} ( 1 - {c_{kl}} ) .\end{split}
\tag{2}
\end{align*}
\end{document}
As neither the trinary nor the binary coding satisfies the Hardy–Weinberg equilibrium, the STRUCTURE and ADMIXTURE methods cannot be directly applied to the CNV data.
We let \documentclass{aastex}\usepackage{amsbsy}\usepackage{amsfonts}\usepackage{amssymb}\usepackage{bm}\usepackage{mathrsfs}\usepackage{pifont}\usepackage{stmaryrd}\usepackage{textcomp}\usepackage{portland, xspace}\usepackage{amsmath, amsxtra}\usepackage{upgreek}\pagestyle{empty}\DeclareMathSizes{10}{9}{7}{6}\begin{document}
$$f ( \textbf{\textit{N}} , \textbf{\textit{V}}{ \kern 1pt} { \kern 1pt} \vert { \kern 1pt} \textbf{\textit{Q}} , \textbf{\textit{F}}{ \kern 1pt} , \textbf{\textit{C}} , K )$$
\end{document} denote the joint distribution of the observed major allele counts N and the presence of the CNVs V conditional on the admixture coefficients Q, major allele probabilities F, CNV probabilities C, and the number of ancestral populations K. Using a conditional independence assumption between N and V given Q, the joint distribution can be factored into the product of the marginal distributions of SNPs and CNVs, that is, \documentclass{aastex}\usepackage{amsbsy}\usepackage{amsfonts}\usepackage{amssymb}\usepackage{bm}\usepackage{mathrsfs}\usepackage{pifont}\usepackage{stmaryrd}\usepackage{textcomp}\usepackage{portland, xspace}\usepackage{amsmath, amsxtra}\usepackage{upgreek}\pagestyle{empty}\DeclareMathSizes{10}{9}{7}{6}\begin{document}
$$f ( \textbf{\textit{N}}{ \kern 1pt} , \textbf{\textit{V}}{ \kern 1pt} { \kern 1pt} \vert { \kern 1pt} \textbf{\textit{Q}} , { \kern 1pt} \textbf{\textit{F}} , C{ \kern 1pt} , K ) = f ( { \kern 1pt} \textbf{\textit{N}}{ \kern 1pt} \vert { \kern 1pt} \textbf{\textit{Q}}{ \kern 1pt} , \textbf{\textit{F}} , K ) f ( { \kern 1pt} \textbf{\textit{V}}{ \kern 1pt} \vert { \kern 1pt} \textbf{\textit{Q}}{ \kern 1pt} , \textbf{\textit{C}}{ \kern 1pt} { \kern 1pt} , K )$$
\end{document}. The mutual independence is empirically achieved by pruning CNVs that have \documentclass{aastex}\usepackage{amsbsy}\usepackage{amsfonts}\usepackage{amssymb}\usepackage{bm}\usepackage{mathrsfs}\usepackage{pifont}\usepackage{stmaryrd}\usepackage{textcomp}\usepackage{portland, xspace}\usepackage{amsmath, amsxtra}\usepackage{upgreek}\pagestyle{empty}\DeclareMathSizes{10}{9}{7}{6}\begin{document}
$${r^2} > 0.1$$
\end{document} with proximate SNPs or CNVs.
The marginal log likelihood of F conditional on Q, as in ADMIXTURE, is written as follows:
\documentclass{aastex}\usepackage{amsbsy}\usepackage{amsfonts}\usepackage{amssymb}\usepackage{bm}\usepackage{mathrsfs}\usepackage{pifont}\usepackage{stmaryrd}\usepackage{textcomp}\usepackage{portland, xspace}\usepackage{amsmath, amsxtra}\usepackage{upgreek}\pagestyle{empty}\DeclareMathSizes{10}{9}{7}{6}\begin{document}
\begin{align*}
l ( { \kern 1pt} \textbf{\textit{F}}{ \kern 1pt} \vert { \kern 1pt} \textbf{\textit{Q}} , { \kern 1pt} { \kern 1pt} \textbf{\textit{N}} , K ) = \mathop \sum \limits_i \mathop \sum \limits_j \left[ {{n_{ij}} \log \left\{ { \mathop \sum \limits_k {q_{ik}}{f_{kj}}} \right\} + ( 2 - {n_{ij}} ) \log \left\{ { \sum \limits_k {q_{ik}} ( 1 - {f_{kj}} ) } \right\} } \right] . \tag{3}
\end{align*}
\end{document}
The log likelihood of C conditional on Q is as follows:
\documentclass{aastex}\usepackage{amsbsy}\usepackage{amsfonts}\usepackage{amssymb}\usepackage{bm}\usepackage{mathrsfs}\usepackage{pifont}\usepackage{stmaryrd}\usepackage{textcomp}\usepackage{portland, xspace}\usepackage{amsmath, amsxtra}\usepackage{upgreek}\pagestyle{empty}\DeclareMathSizes{10}{9}{7}{6}\begin{document}
\begin{align*}
l ( \textbf{\textit{C}}{ \kern 1pt} { \kern 1pt} \vert \textbf{\textit{Q}}{ \kern 1pt} { \kern 1pt} , \textbf{\textit{V}}{ \kern 1pt} { \kern 1pt} , K ) = \sum \limits_i \mathop \sum \limits_l \left\{ { \log \left( { \mathop \sum \limits_k {q_{ik}}{c_{kl}}} \right) I ( {v_{il}} = 1 ) + \log \left( { \mathop \sum \limits_k {q_{ik}} ( 1 - {c_{kl}} ) } \right) I ( {v_{il}} = 0 ) } \right\} . \tag{4}
\end{align*}
\end{document}
Note that the above log likelihoods include the shared parameter matrix Q and are conditional on the fixed number of ancestral populations K; the number of parameters in F, C, and Q is linearly proportional K. As the determination of K is frequently of substantial interest, we discuss the choice of the optimal K later.
Remark: The CNVs can be obtained under a variety of platforms such as aCGH, segment means (SNP Array 6.0; Affymetrix), and B-allele frequency (BAF) and log R ratio (LRR) from Illumina (Genome Studio). After processing the data, it is first necessary to transform them into the binary format.
2.1. Prior and posterior distributions
Without preliminary knowledge regarding admixture proportions on individuals, such as geographical or familial distributions, it is reasonable to assume vague prior distributions on the parameters. In this study, we place a noninformative Dirichlet prior on admixture proportions, supporting the restricted parameter space in \documentclass{aastex}\usepackage{amsbsy}\usepackage{amsfonts}\usepackage{amssymb}\usepackage{bm}\usepackage{mathrsfs}\usepackage{pifont}\usepackage{stmaryrd}\usepackage{textcomp}\usepackage{portland, xspace}\usepackage{amsmath, amsxtra}\usepackage{upgreek}\pagestyle{empty}\DeclareMathSizes{10}{9}{7}{6}\begin{document}
$$[ 0 , 1 ] \times \cdots \times [ 0 , 1 ]$$
\end{document} for \documentclass{aastex}\usepackage{amsbsy}\usepackage{amsfonts}\usepackage{amssymb}\usepackage{bm}\usepackage{mathrsfs}\usepackage{pifont}\usepackage{stmaryrd}\usepackage{textcomp}\usepackage{portland, xspace}\usepackage{amsmath, amsxtra}\usepackage{upgreek}\pagestyle{empty}\DeclareMathSizes{10}{9}{7}{6}\begin{document}
$$K > 2$$
\end{document} dimensions, with the constraint that the sums of the admixture proportions are 1 for all samples:
\documentclass{aastex}\usepackage{amsbsy}\usepackage{amsfonts}\usepackage{amssymb}\usepackage{bm}\usepackage{mathrsfs}\usepackage{pifont}\usepackage{stmaryrd}\usepackage{textcomp}\usepackage{portland, xspace}\usepackage{amsmath, amsxtra}\usepackage{upgreek}\pagestyle{empty}\DeclareMathSizes{10}{9}{7}{6}\begin{document}
\begin{align*}
{ \kern 1pt} {\textbf{\textit{q}}_i} \sim Dirichlet ( 1 , \ldots , 1 ).
\end{align*}
\end{document}
We also assume a uniform distribution for reference allele frequencies and CNV frequencies at each locus:
\documentclass{aastex}\usepackage{amsbsy}\usepackage{amsfonts}\usepackage{amssymb}\usepackage{bm}\usepackage{mathrsfs}\usepackage{pifont}\usepackage{stmaryrd}\usepackage{textcomp}\usepackage{portland, xspace}\usepackage{amsmath, amsxtra}\usepackage{upgreek}\pagestyle{empty}\DeclareMathSizes{10}{9}{7}{6}\begin{document}
\begin{align*}
{f_{kj}} , {c_{kl}} \sim Unif [ 0 , 1 ].
\end{align*}
\end{document}
The constraints that \documentclass{aastex}\usepackage{amsbsy}\usepackage{amsfonts}\usepackage{amssymb}\usepackage{bm}\usepackage{mathrsfs}\usepackage{pifont}\usepackage{stmaryrd}\usepackage{textcomp}\usepackage{portland, xspace}\usepackage{amsmath, amsxtra}\usepackage{upgreek}\pagestyle{empty}\DeclareMathSizes{10}{9}{7}{6}\begin{document}
$$0 \le {f_{kj}} \le 1$$
\end{document}, \documentclass{aastex}\usepackage{amsbsy}\usepackage{amsfonts}\usepackage{amssymb}\usepackage{bm}\usepackage{mathrsfs}\usepackage{pifont}\usepackage{stmaryrd}\usepackage{textcomp}\usepackage{portland, xspace}\usepackage{amsmath, amsxtra}\usepackage{upgreek}\pagestyle{empty}\DeclareMathSizes{10}{9}{7}{6}\begin{document}
$$0 \le {c_{kj}} \le 1$$
\end{document}, and \documentclass{aastex}\usepackage{amsbsy}\usepackage{amsfonts}\usepackage{amssymb}\usepackage{bm}\usepackage{mathrsfs}\usepackage{pifont}\usepackage{stmaryrd}\usepackage{textcomp}\usepackage{portland, xspace}\usepackage{amsmath, amsxtra}\usepackage{upgreek}\pagestyle{empty}\DeclareMathSizes{10}{9}{7}{6}\begin{document}
$$\sum \nolimits_k {q_{ik}} = 1$$
\end{document} are ensured by the above priors. When familial relationships such as parent–child trios or sibships are present in the data set, the pedigree information can be incorporated into individual-specific likelihoods that need to be modeled separately. Otherwise, at the onset of the analysis, we initialize all elements of Q to \documentclass{aastex}\usepackage{amsbsy}\usepackage{amsfonts}\usepackage{amssymb}\usepackage{bm}\usepackage{mathrsfs}\usepackage{pifont}\usepackage{stmaryrd}\usepackage{textcomp}\usepackage{portland, xspace}\usepackage{amsmath, amsxtra}\usepackage{upgreek}\pagestyle{empty}\DeclareMathSizes{10}{9}{7}{6}\begin{document}
$$1 / K$$
\end{document} for all individuals.
When the parameter space is high dimensional, a standard random walk Metropolis (RWM) algorithm with a Gibbs sampler could result in a disastrously long running time. In this study, we consider the MALA (Roberts and Tweedie, 1996), in which the AR (1) transition kernel includes a drift that helps to identify the next sample closer to a target distribution, resulting in faster convergence compared with RWM. In addition, the MALA is known to yield well-mixed posteriors (Roberts and Rosenthal, 2001). Further acceleration of the MALA is also achievable via data adaptively adjusting the scaling parameter, which is analogous to the variance in the RWM proposal distribution (Atchade, 2006). Under this scheme, denote the parameters of interest by a vector xt at the tth iteration; the next candidate \documentclass{aastex}\usepackage{amsbsy}\usepackage{amsfonts}\usepackage{amssymb}\usepackage{bm}\usepackage{mathrsfs}\usepackage{pifont}\usepackage{stmaryrd}\usepackage{textcomp}\usepackage{portland, xspace}\usepackage{amsmath, amsxtra}\usepackage{upgreek}\pagestyle{empty}\DeclareMathSizes{10}{9}{7}{6}\begin{document}
$${x_{new}}$$
\end{document} is chosen from the following:
\documentclass{aastex}\usepackage{amsbsy}\usepackage{amsfonts}\usepackage{amssymb}\usepackage{bm}\usepackage{mathrsfs}\usepackage{pifont}\usepackage{stmaryrd}\usepackage{textcomp}\usepackage{portland, xspace}\usepackage{amsmath, amsxtra}\usepackage{upgreek}\pagestyle{empty}\DeclareMathSizes{10}{9}{7}{6}\begin{document}
\begin{align*}
{ x_ { new } } \sim N \left( { { x_t } + \frac { \delta } { 2 } I \nabla \log f ( x ) , { \delta ^2 } I } \right) , \tag { 5 }
\end{align*}
\end{document}
where \documentclass{aastex}\usepackage{amsbsy}\usepackage{amsfonts}\usepackage{amssymb}\usepackage{bm}\usepackage{mathrsfs}\usepackage{pifont}\usepackage{stmaryrd}\usepackage{textcomp}\usepackage{portland, xspace}\usepackage{amsmath, amsxtra}\usepackage{upgreek}\pagestyle{empty}\DeclareMathSizes{10}{9}{7}{6}\begin{document}
$$\nabla$$
\end{document} is the gradient operator, \documentclass{aastex}\usepackage{amsbsy}\usepackage{amsfonts}\usepackage{amssymb}\usepackage{bm}\usepackage{mathrsfs}\usepackage{pifont}\usepackage{stmaryrd}\usepackage{textcomp}\usepackage{portland, xspace}\usepackage{amsmath, amsxtra}\usepackage{upgreek}\pagestyle{empty}\DeclareMathSizes{10}{9}{7}{6}\begin{document}
$$\delta$$
\end{document} is a scale parameter, and I is the identity matrix. Compared with the RWM, the MALA proposes a new candidate value that is on average drifted by \documentclass{aastex}\usepackage{amsbsy}\usepackage{amsfonts}\usepackage{amssymb}\usepackage{bm}\usepackage{mathrsfs}\usepackage{pifont}\usepackage{stmaryrd}\usepackage{textcomp}\usepackage{portland, xspace}\usepackage{amsmath, amsxtra}\usepackage{upgreek}\pagestyle{empty}\DeclareMathSizes{10}{9}{7}{6}\begin{document}
$$ { \textstyle \frac { \delta } { 2 } } I \nabla \log f ( y )$$
\end{document}, which accelerates the standard RWM to converge faster toward the target density. More details can be found in Roberts and Tweedie (1996). In practice, a small fixed value for the scale parameter will result in higher acceptance rates but slower convergence to the target distribution. On the contrary, starting with a relatively large value for the scale could result in a mixing problem. Thus, we adjust the scale parameter every 100 MCMC iterations to achieve a set target acceptance rate (0.574 for Langevin-based algorithms) (Roberts and Rosenthal, 2001). To avoid local maxima due to the small scale of \documentclass{aastex}\usepackage{amsbsy}\usepackage{amsfonts}\usepackage{amssymb}\usepackage{bm}\usepackage{mathrsfs}\usepackage{pifont}\usepackage{stmaryrd}\usepackage{textcomp}\usepackage{portland, xspace}\usepackage{amsmath, amsxtra}\usepackage{upgreek}\pagestyle{empty}\DeclareMathSizes{10}{9}{7}{6}\begin{document}
$$\delta$$
\end{document}, we use \documentclass{aastex}\usepackage{amsbsy}\usepackage{amsfonts}\usepackage{amssymb}\usepackage{bm}\usepackage{mathrsfs}\usepackage{pifont}\usepackage{stmaryrd}\usepackage{textcomp}\usepackage{portland, xspace}\usepackage{amsmath, amsxtra}\usepackage{upgreek}\pagestyle{empty}\DeclareMathSizes{10}{9}{7}{6}\begin{document}
$$10 \delta$$
\end{document} with a probability of 0.10 and \documentclass{aastex}\usepackage{amsbsy}\usepackage{amsfonts}\usepackage{amssymb}\usepackage{bm}\usepackage{mathrsfs}\usepackage{pifont}\usepackage{stmaryrd}\usepackage{textcomp}\usepackage{portland, xspace}\usepackage{amsmath, amsxtra}\usepackage{upgreek}\pagestyle{empty}\DeclareMathSizes{10}{9}{7}{6}\begin{document}
$$\delta$$
\end{document} with a probability of 0.90 for the proposal. We assigned random initial values within the range of \documentclass{aastex}\usepackage{amsbsy}\usepackage{amsfonts}\usepackage{amssymb}\usepackage{bm}\usepackage{mathrsfs}\usepackage{pifont}\usepackage{stmaryrd}\usepackage{textcomp}\usepackage{portland, xspace}\usepackage{amsmath, amsxtra}\usepackage{upgreek}\pagestyle{empty}\DeclareMathSizes{10}{9}{7}{6}\begin{document}
$$[ 0 , 1 ]$$
\end{document}.
where the admixture proportion for \documentclass{aastex}\usepackage{amsbsy}\usepackage{amsfonts}\usepackage{amssymb}\usepackage{bm}\usepackage{mathrsfs}\usepackage{pifont}\usepackage{stmaryrd}\usepackage{textcomp}\usepackage{portland, xspace}\usepackage{amsmath, amsxtra}\usepackage{upgreek}\pagestyle{empty}\DeclareMathSizes{10}{9}{7}{6}\begin{document}
$$k = 1$$
\end{document} is constrained by \documentclass{aastex}\usepackage{amsbsy}\usepackage{amsfonts}\usepackage{amssymb}\usepackage{bm}\usepackage{mathrsfs}\usepackage{pifont}\usepackage{stmaryrd}\usepackage{textcomp}\usepackage{portland, xspace}\usepackage{amsmath, amsxtra}\usepackage{upgreek}\pagestyle{empty}\DeclareMathSizes{10}{9}{7}{6}\begin{document}
$$\sum \nolimits_k {q_{ik}} = 1$$
\end{document}. Complete details of posterior sampling are given in Supplementary Section 1.
2.2. Choice of the number of ancestral populations K
When optimizing the proposed joint model likelihood, we assume that the number of populations K is known. It is often the case that the number of populations K itself is unknown and is of substantial interest (Rosenberg et al., 2002). The choice of K, which relates to the model complexity, can be addressed using model selection statistics such as the Bayesian information criterion (BIC) (Schwarz, 1978) or the Deviance information criterion (DIC) in the Bayesian frameworks where the model with the smallest value of BIC or DIC is preferred. As the log likelihood assessments suggested by STRUCTURE could favor a higher value of K and DIC tends to select overfitted models under these conditions (Supplementary Fig. S2), the BIC goodness-of-fit statistics will be used. In addition, we also used clustering techniques such as the silhouette method (Rousseeuw, 1987) that graphically detects the point where the percentage of variance explained by adding one more ancestry begins to drop.
Note that the MCMC running time is proportional to K. In this application, we sequentially run POPSTR with a series of candidate values K. It is desirable to limit such a search to a narrow range, for example, K less than 10. Starting from \documentclass{aastex}\usepackage{amsbsy}\usepackage{amsfonts}\usepackage{amssymb}\usepackage{bm}\usepackage{mathrsfs}\usepackage{pifont}\usepackage{stmaryrd}\usepackage{textcomp}\usepackage{portland, xspace}\usepackage{amsmath, amsxtra}\usepackage{upgreek}\pagestyle{empty}\DeclareMathSizes{10}{9}{7}{6}\begin{document}
$$K = 3$$
\end{document}, we progressively increase the value of K until the BIC first starts to increase and then determine the value of K that yields the smallest BIC. This empirical method of choosing K leads to a proposed number of populations, the most consistent with the data. In interpreting the results, however, we caution that K does not necessarily imply the number of predefined populations. For instance, when two well-defined, different populations share similar genetic characteristics, the model may consider the two populations as one, as seen in Section 4.
2.3. Performance optimization
There are often over 1 million SNPs or CNV loci sequenced in a single human sample. Given limited computing resources, it is not feasible to input all the raw data into the program. Furthermore, a large portion of the data contribute little to the likelihood values. For instance, we easily observe that a large volume (>80%) of SNP loci are uniformly nonvariant across all subjects. Thus, filtering genetic information to reduce the uninformative loci while preserving informative variant loci is a crucial step. In this study, we performed an SNP tagging approach via choosing SNPs with a minor allele frequency (MAF) >0.1 and p-values from the test of HWE greater than 0.001.
The presence of severe LD could result in biased and inefficient estimation of Q (Balding, 2006). As suggested in ADMIXTURE, we can use a random sampling of SNPs spaced at least 200 kb apart to reduce LD. It is also beneficial to examine LD metrics \documentclass{aastex}\usepackage{amsbsy}\usepackage{amsfonts}\usepackage{amssymb}\usepackage{bm}\usepackage{mathrsfs}\usepackage{pifont}\usepackage{stmaryrd}\usepackage{textcomp}\usepackage{portland, xspace}\usepackage{amsmath, amsxtra}\usepackage{upgreek}\pagestyle{empty}\DeclareMathSizes{10}{9}{7}{6}\begin{document}
$$D ^\prime$$
\end{document} and r2 to check for the presence of severe LD.
To boost the MCMC iteration speed, POPSTR supports parallel computing where the number of threads is an input parameter to run the program. In this process, the I individuals are split into multiple threads during the MCMC. Due to this advantage over STRUCTURE and ADMIXTURE, we do not demonstrate the computational speed as the comparison would not be fair. Instead, we show in Supplementary Figures S3 and S4 that the MCMC chains converge after a small number of iterations. The source code and software may be downloaded from the link https://sites.google.com/a/georgetown.edu/jaeil/popstr.
3. Simulations
We carried out simulation studies to assess how POPSTR performs compared with two benchmarks, ADMIXTURE and STRUCTURE (ver 2.1). For this comparison, the default setups regarding the number of iterations and stopping rules of the two methods were used. We focused on the influence of integrating CNV on population structure estimation under four representative scenarios mimicking human populations from the HapMap 2005 project (The International HapMap Consortium, 2005). In particular, we focused on 445 individuals from five populations: Yoruba from Ibadan, Nigeria (YRI, 113), Utah residents with Northern and Western European ancestry (CEU, 112), Han Chinese from Beijing (CHB, 84), Japanese from Tokyo (JPT, 86), and individuals of Mexican ancestry from Los Angeles, California (MEX, 50). Because of the similarity between CHB and JPT, which has been noted before (Alexander et al., 2009), we consider a single combined population, JPT+CHB, in this section.
First, we explored a three-population scenario in which distinct ancestral populations of the modern YRI, CEU, JPT+CHB populations are considered. The genotype matrix F is constructed from 2500 SNPs, arbitrarily sampled from the HapMap 2005 project after excluding those meeting any of the following criteria: (1) MAF <0.1, (2) more than 5% missing data, and (3) HWE violated with a p-value less than 0.001. We did not apply LD filtering to see closely how the integration of CNVs affects our ancestral estimation in the presence of moderate LD. Similarly, the copy number matrix K was created by using 792 loci, obtained after excluding loci with no variation across individuals or more than 5% missing data.
Second, to further investigate the influence of highly admixed populations on estimation, we considered a four-population scenario where the MEX population is added to the three-population scenario. The MEX population was expected to be genetically similar to the CEU population, which could lead to identifiability or local maxima problems between the two populations.
We considered four admixture scenarios by constructing admixture coefficient matrices Q given a total of 1000 individuals as follows:
1. We suppose that half of the individuals (500) were generated from approximately one ancestral population and the remaining half of individuals (500) were randomly mixed by sampling from \documentclass{aastex}\usepackage{amsbsy}\usepackage{amsfonts}\usepackage{amssymb}\usepackage{bm}\usepackage{mathrsfs}\usepackage{pifont}\usepackage{stmaryrd}\usepackage{textcomp}\usepackage{portland, xspace}\usepackage{amsmath, amsxtra}\usepackage{upgreek}\pagestyle{empty}\DeclareMathSizes{10}{9}{7}{6}\begin{document}
$$0.5Dir ( 0.05 , 0.05 , 0.05 ) + 0.5Dir ( 1 , 1 , 1 )$$
\end{document} (or \documentclass{aastex}\usepackage{amsbsy}\usepackage{amsfonts}\usepackage{amssymb}\usepackage{bm}\usepackage{mathrsfs}\usepackage{pifont}\usepackage{stmaryrd}\usepackage{textcomp}\usepackage{portland, xspace}\usepackage{amsmath, amsxtra}\usepackage{upgreek}\pagestyle{empty}\DeclareMathSizes{10}{9}{7}{6}\begin{document}
$$0.5Dir ( 0.05 , 0.05 , 0.05 , 0.05 ) + 0.5Dir ( 1 , 1 , 1 , 1 )$$
\end{document} for four populations) where \documentclass{aastex}\usepackage{amsbsy}\usepackage{amsfonts}\usepackage{amssymb}\usepackage{bm}\usepackage{mathrsfs}\usepackage{pifont}\usepackage{stmaryrd}\usepackage{textcomp}\usepackage{portland, xspace}\usepackage{amsmath, amsxtra}\usepackage{upgreek}\pagestyle{empty}\DeclareMathSizes{10}{9}{7}{6}\begin{document}
$$Dir ( { \kern 1pt} \alpha { \kern 1pt} )$$
\end{document} represents the Dirichlet distribution with a parameter vector \documentclass{aastex}\usepackage{amsbsy}\usepackage{amsfonts}\usepackage{amssymb}\usepackage{bm}\usepackage{mathrsfs}\usepackage{pifont}\usepackage{stmaryrd}\usepackage{textcomp}\usepackage{portland, xspace}\usepackage{amsmath, amsxtra}\usepackage{upgreek}\pagestyle{empty}\DeclareMathSizes{10}{9}{7}{6}\begin{document}
$${ \kern 1pt} \alpha { \kern 1pt}$$
\end{document}.
2. All individuals (1000) were generated from \documentclass{aastex}\usepackage{amsbsy}\usepackage{amsfonts}\usepackage{amssymb}\usepackage{bm}\usepackage{mathrsfs}\usepackage{pifont}\usepackage{stmaryrd}\usepackage{textcomp}\usepackage{portland, xspace}\usepackage{amsmath, amsxtra}\usepackage{upgreek}\pagestyle{empty}\DeclareMathSizes{10}{9}{7}{6}\begin{document}
$$Dir ( 1 , 1 , 1 )$$
\end{document} [or \documentclass{aastex}\usepackage{amsbsy}\usepackage{amsfonts}\usepackage{amssymb}\usepackage{bm}\usepackage{mathrsfs}\usepackage{pifont}\usepackage{stmaryrd}\usepackage{textcomp}\usepackage{portland, xspace}\usepackage{amsmath, amsxtra}\usepackage{upgreek}\pagestyle{empty}\DeclareMathSizes{10}{9}{7}{6}\begin{document}
$$Dir ( 1 , 1 , 1 , 1 )$$
\end{document} for four populations]. This experiment was designed to see how each method performs when the data rarely include individuals from a single ancestral population.
3. All individuals (1000) were generated from \documentclass{aastex}\usepackage{amsbsy}\usepackage{amsfonts}\usepackage{amssymb}\usepackage{bm}\usepackage{mathrsfs}\usepackage{pifont}\usepackage{stmaryrd}\usepackage{textcomp}\usepackage{portland, xspace}\usepackage{amsmath, amsxtra}\usepackage{upgreek}\pagestyle{empty}\DeclareMathSizes{10}{9}{7}{6}\begin{document}
$$Dir ( 0.4 , 0.4 , 0.4 )$$
\end{document} (or \documentclass{aastex}\usepackage{amsbsy}\usepackage{amsfonts}\usepackage{amssymb}\usepackage{bm}\usepackage{mathrsfs}\usepackage{pifont}\usepackage{stmaryrd}\usepackage{textcomp}\usepackage{portland, xspace}\usepackage{amsmath, amsxtra}\usepackage{upgreek}\pagestyle{empty}\DeclareMathSizes{10}{9}{7}{6}\begin{document}
$$Dir ( 0.4 , 0.4 , 0.4 , 0.4 )$$
\end{document} for four populations) where most of the individuals are heavily admixed from primarily two populations.
4. All individuals (1000) were generated from \documentclass{aastex}\usepackage{amsbsy}\usepackage{amsfonts}\usepackage{amssymb}\usepackage{bm}\usepackage{mathrsfs}\usepackage{pifont}\usepackage{stmaryrd}\usepackage{textcomp}\usepackage{portland, xspace}\usepackage{amsmath, amsxtra}\usepackage{upgreek}\pagestyle{empty}\DeclareMathSizes{10}{9}{7}{6}\begin{document}
$$Dir ( 0.4 , 0.05 , 0.4 )$$
\end{document} (or \documentclass{aastex}\usepackage{amsbsy}\usepackage{amsfonts}\usepackage{amssymb}\usepackage{bm}\usepackage{mathrsfs}\usepackage{pifont}\usepackage{stmaryrd}\usepackage{textcomp}\usepackage{portland, xspace}\usepackage{amsmath, amsxtra}\usepackage{upgreek}\pagestyle{empty}\DeclareMathSizes{10}{9}{7}{6}\begin{document}
$$Dir ( 0.4 , 0.05 , 0.4 , 0.05 )$$
\end{document} for four populations). This leads to most individuals being admixed primarily from population 1 and population 3.
All of the above realizations of Q are located on the unit simplex satisfying \documentclass{aastex}\usepackage{amsbsy}\usepackage{amsfonts}\usepackage{amssymb}\usepackage{bm}\usepackage{mathrsfs}\usepackage{pifont}\usepackage{stmaryrd}\usepackage{textcomp}\usepackage{portland, xspace}\usepackage{amsmath, amsxtra}\usepackage{upgreek}\pagestyle{empty}\DeclareMathSizes{10}{9}{7}{6}\begin{document}
$$\sum \nolimits_{k = 1}^{3 { \rm{o}}r 4} {q_{ik}} = 1 , \forall {q_{ik}} \ge 0 , \forall i = 1 , \ldots , 1000$$
\end{document}. Each scenario of three populations and four populations is visualized in Figures 1 and 2, respectively. Given Q, F, and C, we sampled n and v using the multinomial and Bernoulli distributions in Equations (1) and (2), respectively. We repeated the above procedure to create \documentclass{aastex}\usepackage{amsbsy}\usepackage{amsfonts}\usepackage{amssymb}\usepackage{bm}\usepackage{mathrsfs}\usepackage{pifont}\usepackage{stmaryrd}\usepackage{textcomp}\usepackage{portland, xspace}\usepackage{amsmath, amsxtra}\usepackage{upgreek}\pagestyle{empty}\DeclareMathSizes{10}{9}{7}{6}\begin{document}
$$H = 10$$
\end{document} simulation data sets per admixture scenario.
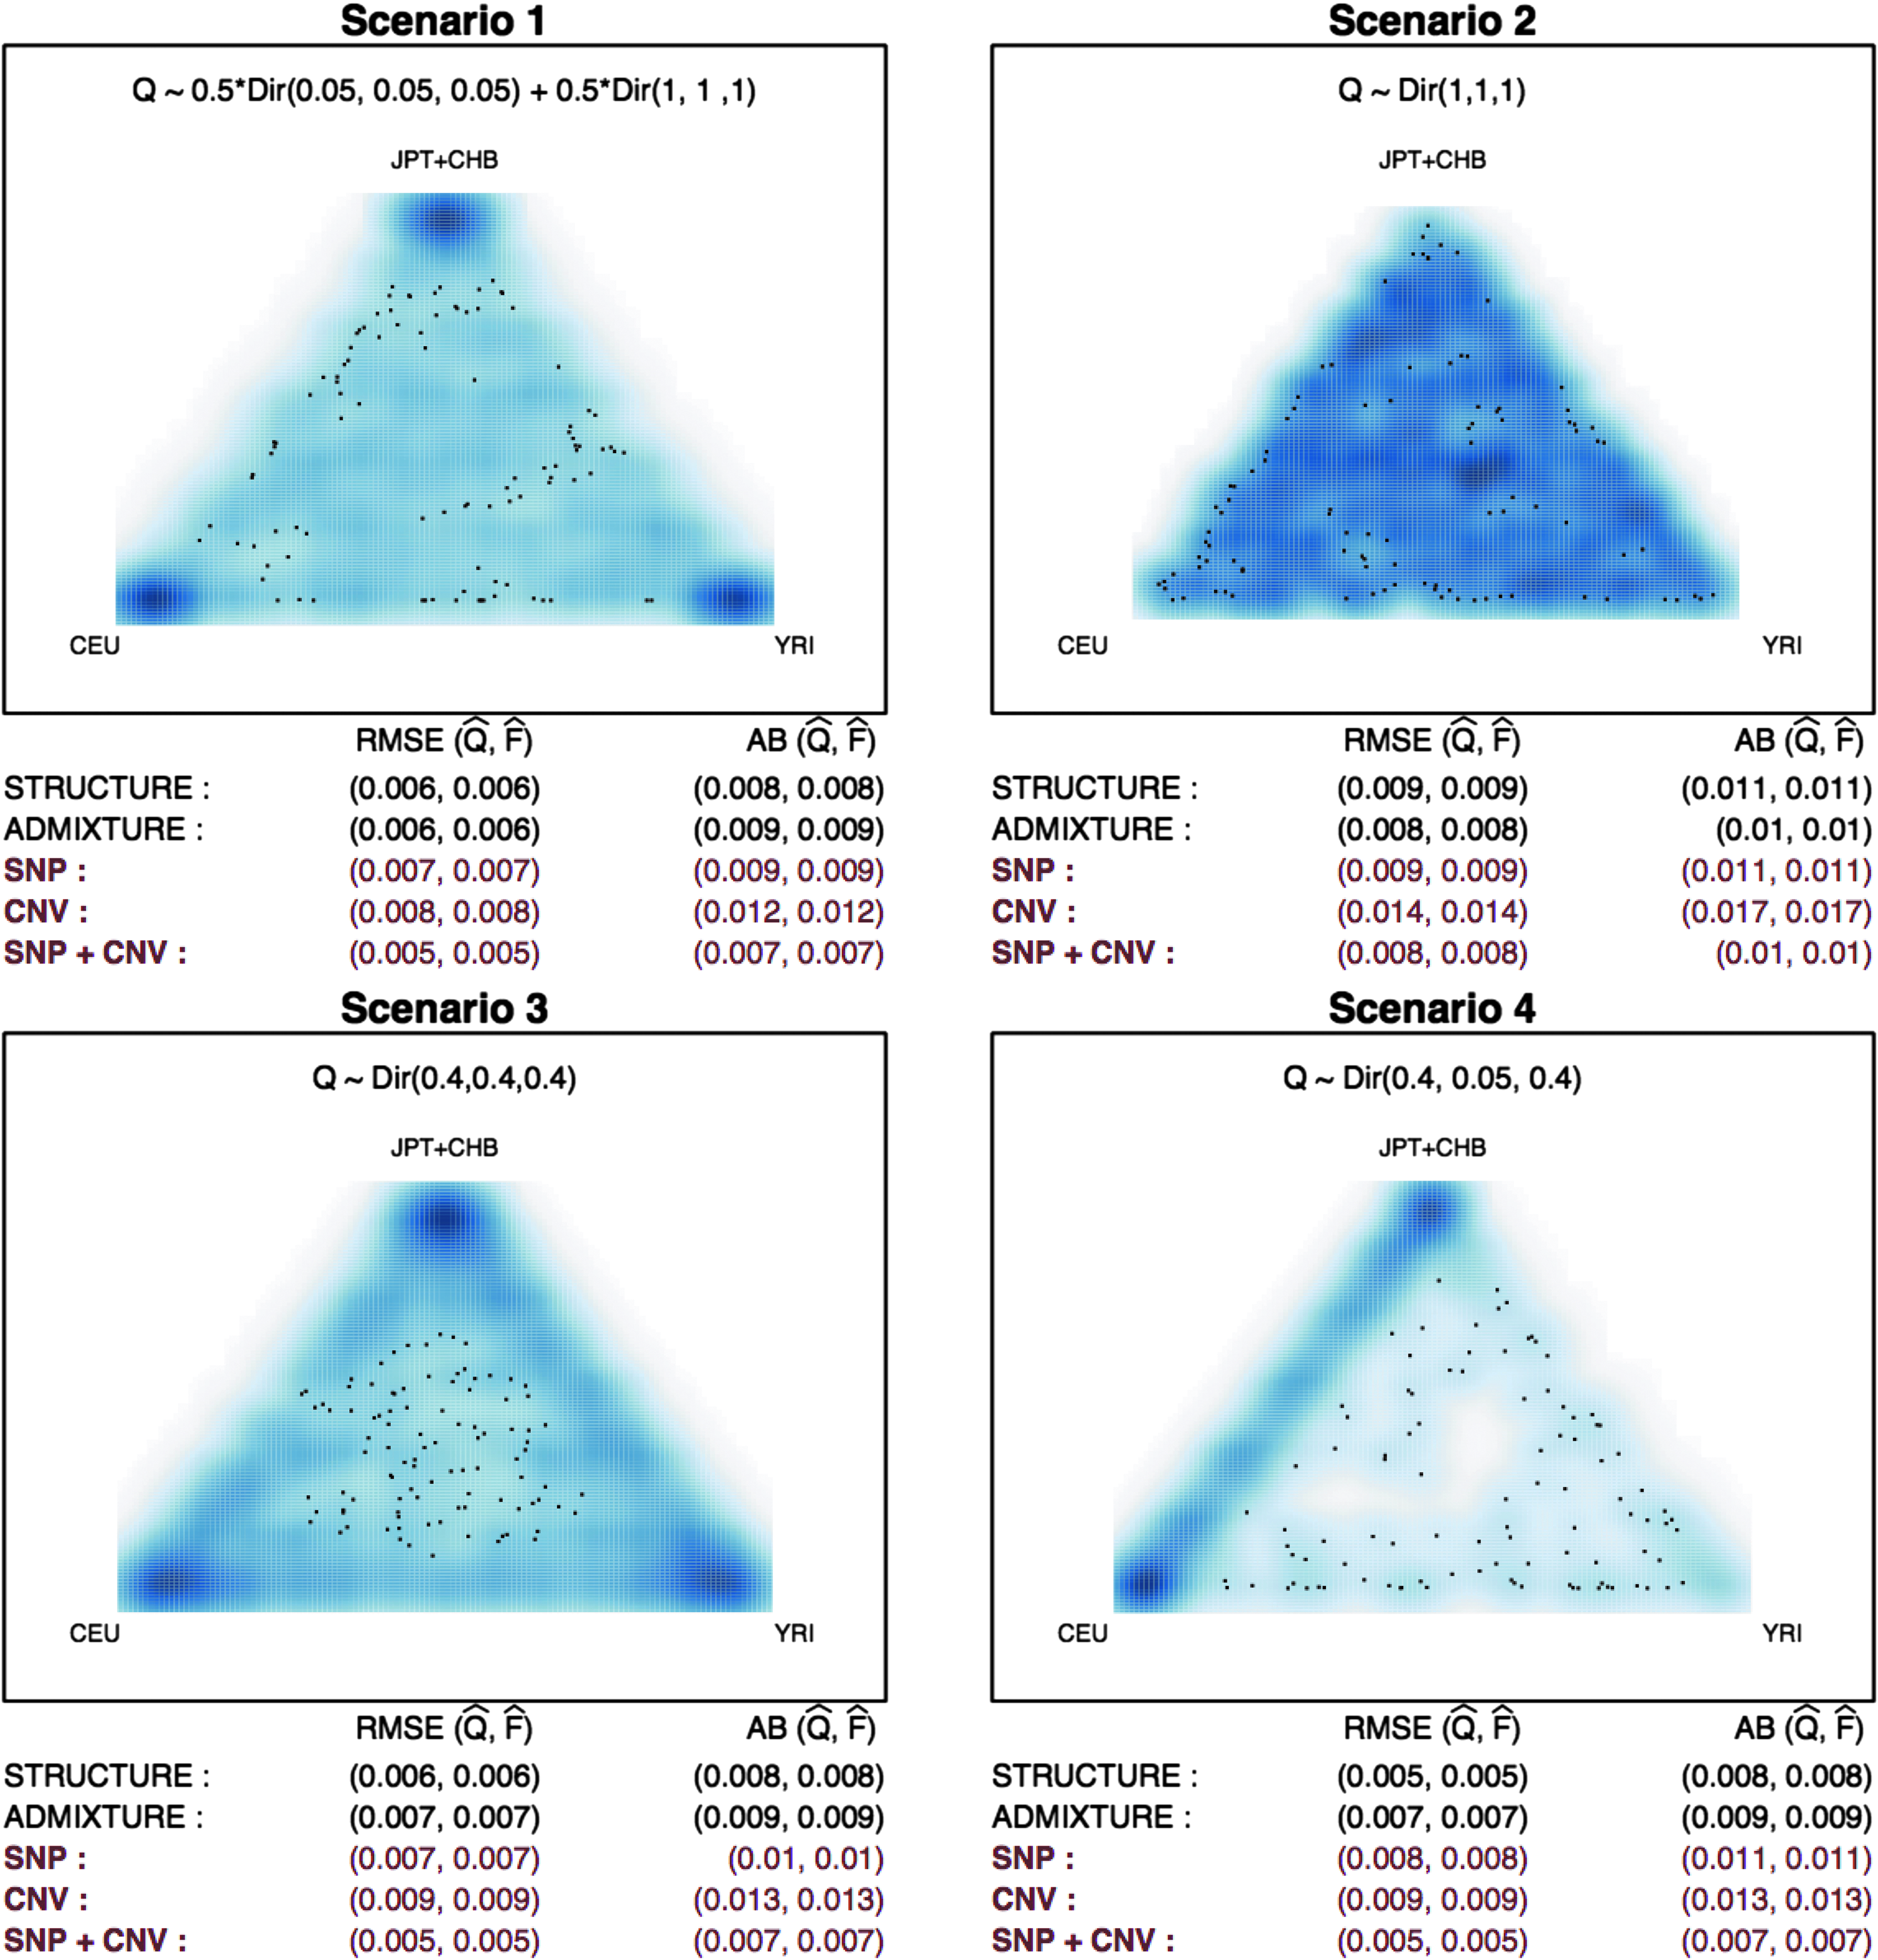
Simulation results under three-population admixture are summarized. Four scenarios about varying population structure Q are considered: (1) \documentclass{aastex}\usepackage{amsbsy}\usepackage{amsfonts}\usepackage{amssymb}\usepackage{bm}\usepackage{mathrsfs}\usepackage{pifont}\usepackage{stmaryrd}\usepackage{textcomp}\usepackage{portland, xspace}\usepackage{amsmath, amsxtra}\usepackage{upgreek}\pagestyle{empty}\DeclareMathSizes{10}{9}{7}{6}\begin{document}
$$\textbf{\textit{Q}}{ \kern 1pt} { \kern 1pt} \sim 0.5Dir ( 0.05 , 0.05 , 0.05 ) + 0.5Dir ( 1 , 1 , 1 )$$
\end{document}, (2) \documentclass{aastex}\usepackage{amsbsy}\usepackage{amsfonts}\usepackage{amssymb}\usepackage{bm}\usepackage{mathrsfs}\usepackage{pifont}\usepackage{stmaryrd}\usepackage{textcomp}\usepackage{portland, xspace}\usepackage{amsmath, amsxtra}\usepackage{upgreek}\pagestyle{empty}\DeclareMathSizes{10}{9}{7}{6}\begin{document}
$$\textbf{\textit{Q}}{ \kern 1pt} { \kern 1pt} \sim Dir ( 1 , 1 , 1 )$$
\end{document}, (3) \documentclass{aastex}\usepackage{amsbsy}\usepackage{amsfonts}\usepackage{amssymb}\usepackage{bm}\usepackage{mathrsfs}\usepackage{pifont}\usepackage{stmaryrd}\usepackage{textcomp}\usepackage{portland, xspace}\usepackage{amsmath, amsxtra}\usepackage{upgreek}\pagestyle{empty}\DeclareMathSizes{10}{9}{7}{6}\begin{document}
$$\textbf{\textit{Q}}{ \kern 1pt} { \kern 1pt} \sim 0.5Dir ( 0.4 , 0.4 , 0.4 )$$
\end{document}, and (4) \documentclass{aastex}\usepackage{amsbsy}\usepackage{amsfonts}\usepackage{amssymb}\usepackage{bm}\usepackage{mathrsfs}\usepackage{pifont}\usepackage{stmaryrd}\usepackage{textcomp}\usepackage{portland, xspace}\usepackage{amsmath, amsxtra}\usepackage{upgreek}\pagestyle{empty}\DeclareMathSizes{10}{9}{7}{6}\begin{document}
$$\textbf{\textit{Q}}{ \kern 1pt} { \kern 1pt} \sim Dir ( 0.4 , 0.05 , 0.4 )$$
\end{document}. The RMSE and AB of STRUCTURE, ADMIXTURE, and POPSTR using (i) SNPs only (ii) CNVs only, and (iii) both SNPs and CNVs are summarized in red. AB, absolute bias; CNV, copy number variation; RMSE, root mean squared error; SNP, single-nucleotide polymorphism.
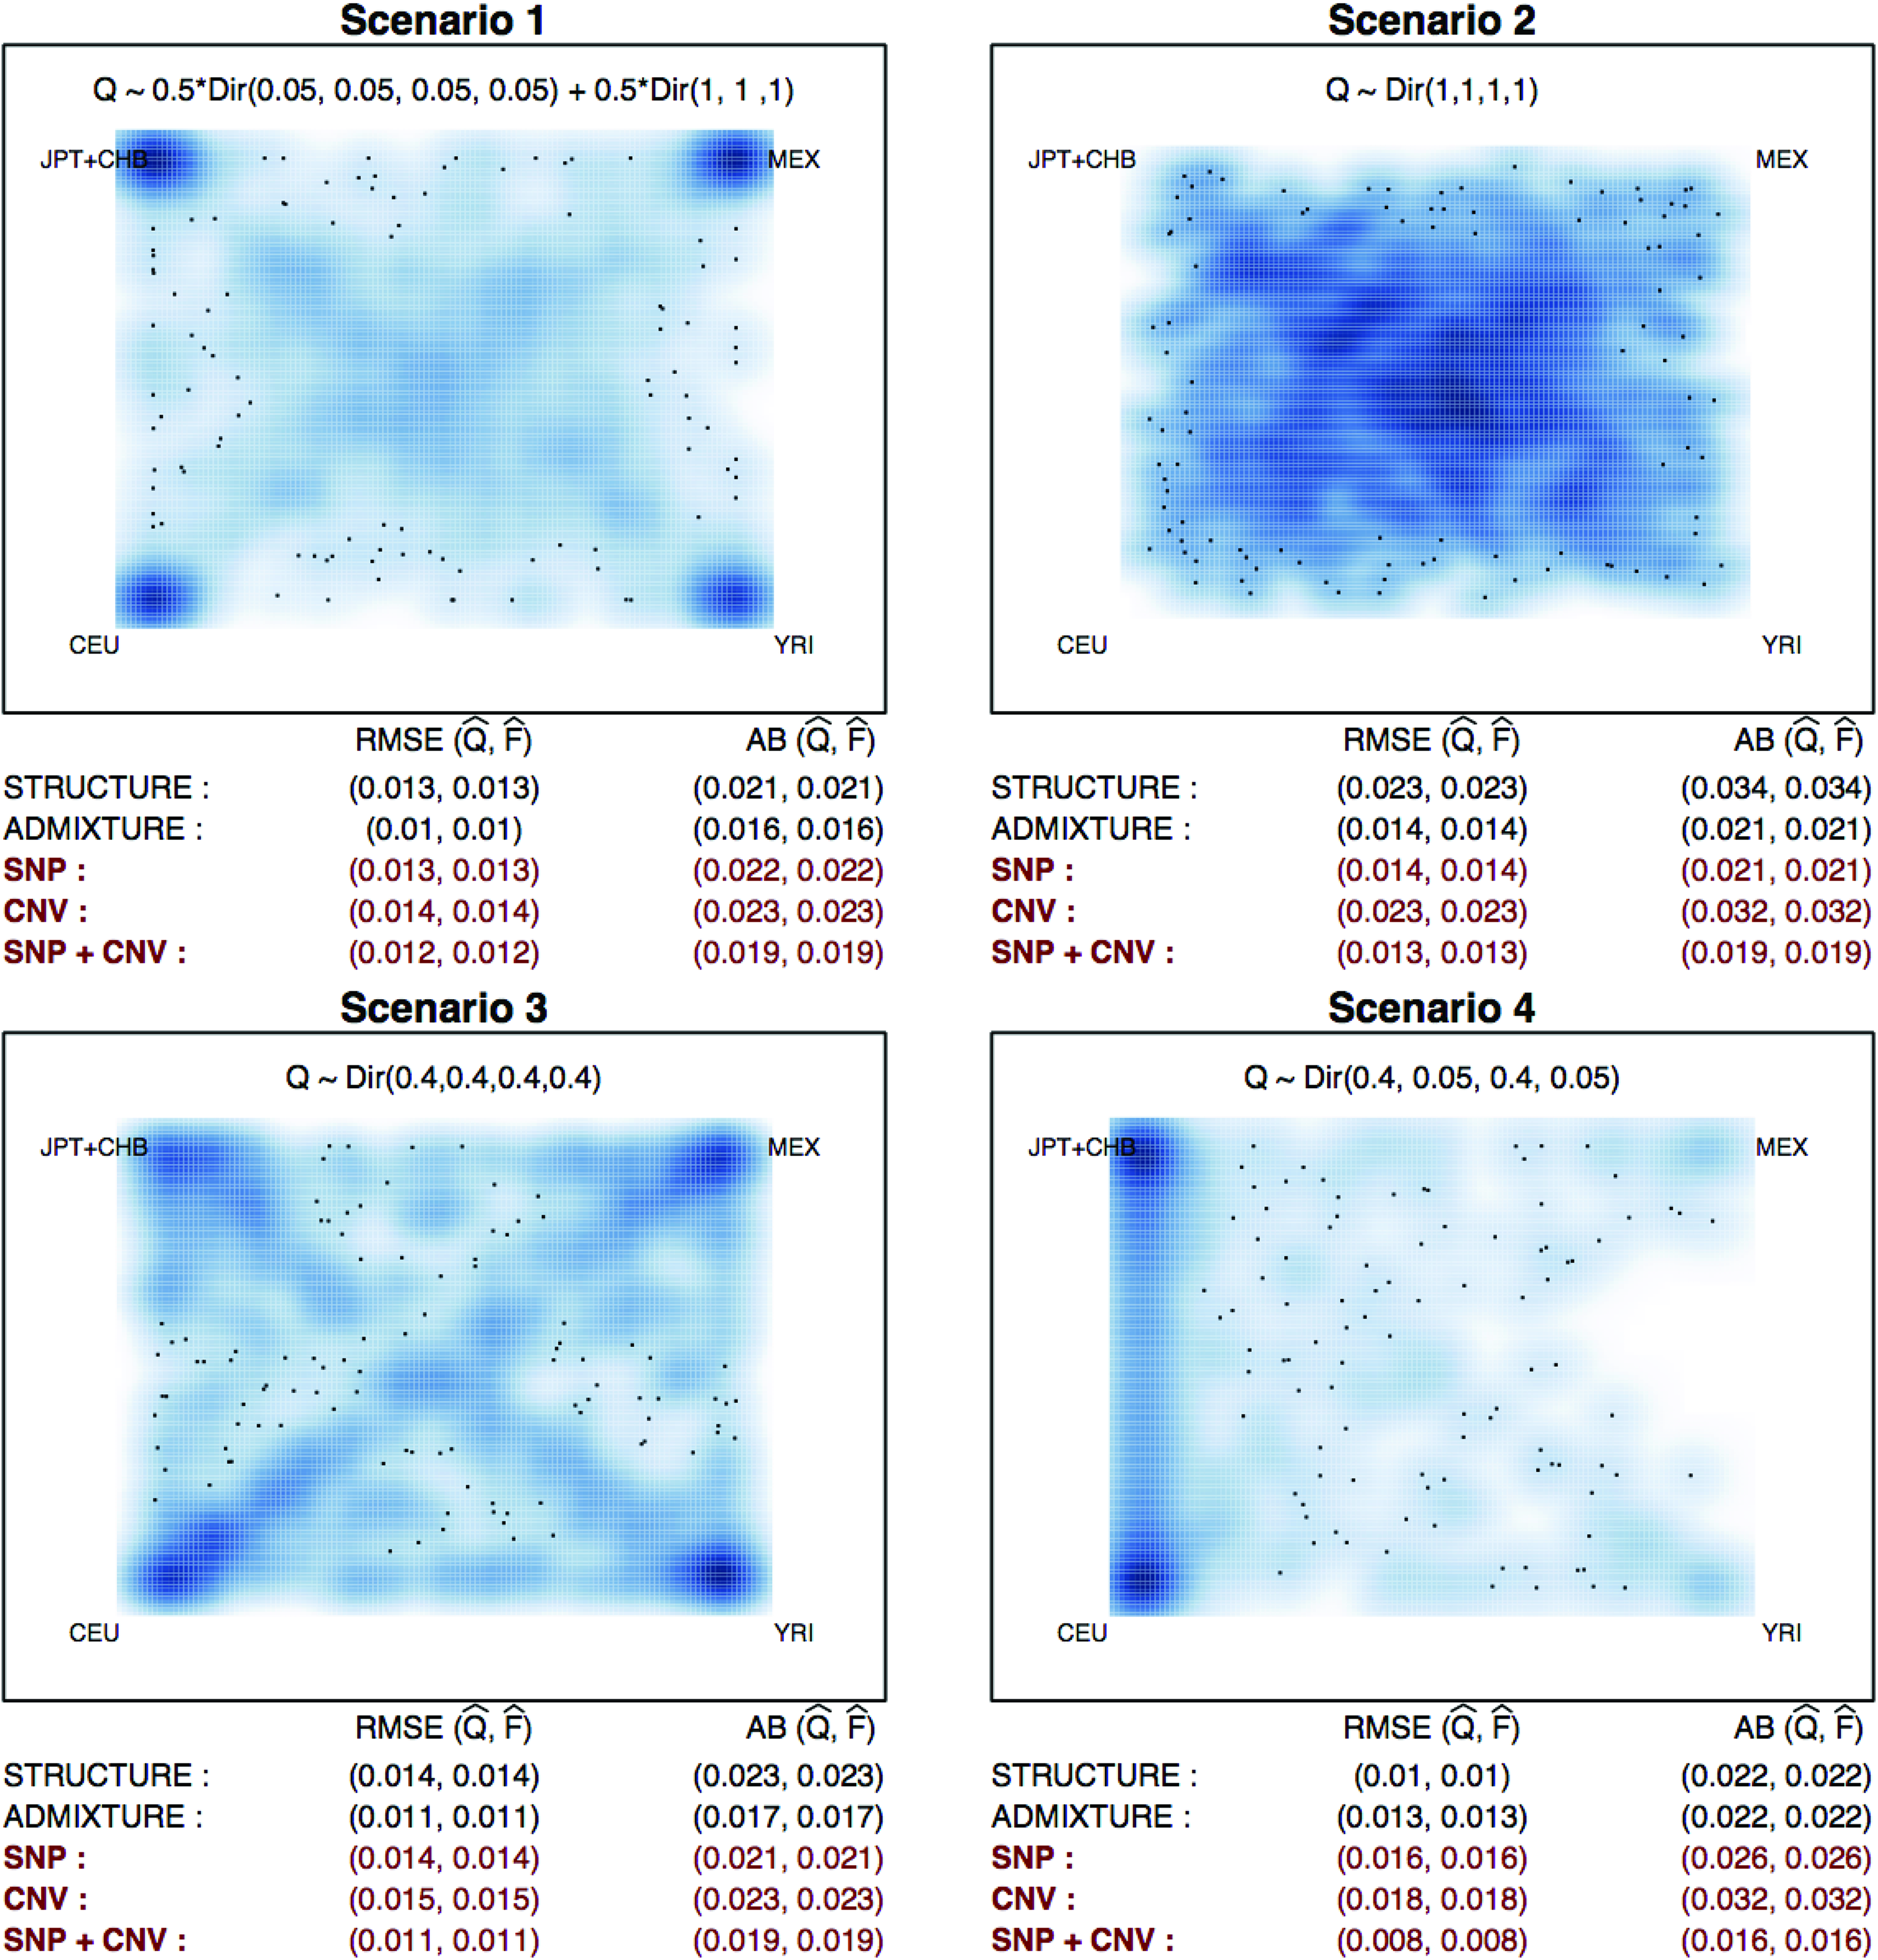
Simulation results under four-population admixture are summarized. Four scenarios about varying population structure Q are considered: (1) \documentclass{aastex}\usepackage{amsbsy}\usepackage{amsfonts}\usepackage{amssymb}\usepackage{bm}\usepackage{mathrsfs}\usepackage{pifont}\usepackage{stmaryrd}\usepackage{textcomp}\usepackage{portland, xspace}\usepackage{amsmath, amsxtra}\usepackage{upgreek}\pagestyle{empty}\DeclareMathSizes{10}{9}{7}{6}\begin{document}
$$\textbf{\textit{Q}}{ \kern 1pt} { \kern 1pt} \sim 0.5Dir ( 0.05 , 0.05 , 0.05 , 0.05 ) + 0.5Dir ( 1 , 1 , 1 , 1 )$$
\end{document}, (2) \documentclass{aastex}\usepackage{amsbsy}\usepackage{amsfonts}\usepackage{amssymb}\usepackage{bm}\usepackage{mathrsfs}\usepackage{pifont}\usepackage{stmaryrd}\usepackage{textcomp}\usepackage{portland, xspace}\usepackage{amsmath, amsxtra}\usepackage{upgreek}\pagestyle{empty}\DeclareMathSizes{10}{9}{7}{6}\begin{document}
$$\textbf{\textit{Q}}{ \kern 1pt} { \kern 1pt} \sim Dir ( 1 , 1 , 1 , 1 )$$
\end{document}, (3) \documentclass{aastex}\usepackage{amsbsy}\usepackage{amsfonts}\usepackage{amssymb}\usepackage{bm}\usepackage{mathrsfs}\usepackage{pifont}\usepackage{stmaryrd}\usepackage{textcomp}\usepackage{portland, xspace}\usepackage{amsmath, amsxtra}\usepackage{upgreek}\pagestyle{empty}\DeclareMathSizes{10}{9}{7}{6}\begin{document}
$$\textbf{\textit{Q}}{ \kern 1pt} { \kern 1pt} \sim Dir ( 0.4 , 0.4 , 0.4 , 0.4 )$$
\end{document}, and (4) \documentclass{aastex}\usepackage{amsbsy}\usepackage{amsfonts}\usepackage{amssymb}\usepackage{bm}\usepackage{mathrsfs}\usepackage{pifont}\usepackage{stmaryrd}\usepackage{textcomp}\usepackage{portland, xspace}\usepackage{amsmath, amsxtra}\usepackage{upgreek}\pagestyle{empty}\DeclareMathSizes{10}{9}{7}{6}\begin{document}
$$\textbf{\textit{Q}}{ \kern 1pt} { \kern 1pt} \sim Dir ( 0.4 , 0.05 , 0.4 , 0.05 )$$
\end{document}. The RMSE and AB of STRUCTURE, ADMIXTURE, and POPSTR using (i) SNPs only (ii) CNVs only, and (iii) both SNPs and CNVs are summarized in red.
To evaluate how each method estimates true population structure, we consider two measures, averaged absolute bias (AB) for similarity and root mean squared error (RMSE) for efficiency, computed as follows:
\documentclass{aastex}\usepackage{amsbsy}\usepackage{amsfonts}\usepackage{amssymb}\usepackage{bm}\usepackage{mathrsfs}\usepackage{pifont}\usepackage{stmaryrd}\usepackage{textcomp}\usepackage{portland, xspace}\usepackage{amsmath, amsxtra}\usepackage{upgreek}\pagestyle{empty}\DeclareMathSizes{10}{9}{7}{6}\begin{document}
\begin{align*} \widehat { AB } ( { \kern 1pt } \textbf { \textit { Q } } { \kern 1pt } ) & = \frac { 1 } { { IKH } } \mathop \sum \limits_ { i , k , h } \vert \hat q_ { ik } ^ { ( h ) } - { q_ { ik } } \vert , \\ \widehat { RMSE } ( { \kern 1pt } \textbf { \textit { Q } } { \kern 1pt } ) & = \sqrt { \frac { 1 } { { IKH } } \mathop \sum \limits_ { i , k , h } { { ( \hat q_ { ik } ^ { ( h ) } - { q_ { ik } } ) } ^2 } } , \end{align*}
\end{document}
where \documentclass{aastex}\usepackage{amsbsy}\usepackage{amsfonts}\usepackage{amssymb}\usepackage{bm}\usepackage{mathrsfs}\usepackage{pifont}\usepackage{stmaryrd}\usepackage{textcomp}\usepackage{portland, xspace}\usepackage{amsmath, amsxtra}\usepackage{upgreek}\pagestyle{empty}\DeclareMathSizes{10}{9}{7}{6}\begin{document}
$$\hat q_{ik}^{ ( h ) }$$
\end{document} is the estimate of \documentclass{aastex}\usepackage{amsbsy}\usepackage{amsfonts}\usepackage{amssymb}\usepackage{bm}\usepackage{mathrsfs}\usepackage{pifont}\usepackage{stmaryrd}\usepackage{textcomp}\usepackage{portland, xspace}\usepackage{amsmath, amsxtra}\usepackage{upgreek}\pagestyle{empty}\DeclareMathSizes{10}{9}{7}{6}\begin{document}
$${q_{ik}}$$
\end{document} at h-th replicate. We also consider similar measures for F: \documentclass{aastex}\usepackage{amsbsy}\usepackage{amsfonts}\usepackage{amssymb}\usepackage{bm}\usepackage{mathrsfs}\usepackage{pifont}\usepackage{stmaryrd}\usepackage{textcomp}\usepackage{portland, xspace}\usepackage{amsmath, amsxtra}\usepackage{upgreek}\pagestyle{empty}\DeclareMathSizes{10}{9}{7}{6}\begin{document}
$$\widehat {AB} ( { \kern 1pt} { \kern 1pt} \textbf{\textit{F}} )$$
\end{document} and \documentclass{aastex}\usepackage{amsbsy}\usepackage{amsfonts}\usepackage{amssymb}\usepackage{bm}\usepackage{mathrsfs}\usepackage{pifont}\usepackage{stmaryrd}\usepackage{textcomp}\usepackage{portland, xspace}\usepackage{amsmath, amsxtra}\usepackage{upgreek}\pagestyle{empty}\DeclareMathSizes{10}{9}{7}{6}\begin{document}
$$\widehat {RMSE} ( { \kern 1pt} { \kern 1pt} \textbf{\textit{F}} )$$
\end{document}, for which we use \documentclass{aastex}\usepackage{amsbsy}\usepackage{amsfonts}\usepackage{amssymb}\usepackage{bm}\usepackage{mathrsfs}\usepackage{pifont}\usepackage{stmaryrd}\usepackage{textcomp}\usepackage{portland, xspace}\usepackage{amsmath, amsxtra}\usepackage{upgreek}\pagestyle{empty}\DeclareMathSizes{10}{9}{7}{6}\begin{document}
$${ \hat f_{kj}}$$
\end{document} and the corresponding value \documentclass{aastex}\usepackage{amsbsy}\usepackage{amsfonts}\usepackage{amssymb}\usepackage{bm}\usepackage{mathrsfs}\usepackage{pifont}\usepackage{stmaryrd}\usepackage{textcomp}\usepackage{portland, xspace}\usepackage{amsmath, amsxtra}\usepackage{upgreek}\pagestyle{empty}\DeclareMathSizes{10}{9}{7}{6}\begin{document}
$${f_{kj}}$$
\end{document}. Smaller values of both measures are preferable.
In Figure 1, we summarize the performance of the three approaches ADMIXTURE, STRUCTURE, and POPSTR for the three-population mixture scenarios. For POPSTR, we provide the results based on three types of available information (i) SNPs only (ii) CNVs only, and (iii) both SNPs and CNVs. We focus on comparing the results based on (iii) for POPSTR. When there are relatively large numbers of individuals primarily from a single ancestry as in scenarios [1], [3], and [4], the STRUCTURE and ADMIXTURE methods have similar performances (AB of 0.008–0.009 and RMSE of 0.005–0.007), while POPSTR shows smaller AB (0.007) and RMSE (0.005). On the contrary, when most individuals are substantially admixed as in scenario [2], all three methods suffer from increased bias (AB >0.01) compared to the biases in scenarios [1], [3], and [4]. Overall, POPSTR with only CNVs performs worse than the SNP-based approaches mainly due to the lack of information from the smaller number of loci (792 vs. 2500). The results under the four-population admixture scenarios are shown in Figure 2. In contrast to the results from the three-population example, the results for scenarios [1], [3] differ more substantially from those for scenario [4]. The best performance is achieved by POPSTR in scenario [4], where the AB of 0.016 is much smaller than that from STRUCTURE and ADMIXTURE (AB = 0.022). In scenarios [1] and [3], ADMIXTURE outperforms POPSTR. ADMIXTURE shows better performance than STRUCTURE across scenarios [1], [2], and [3], while POPSTR outperforms STRUCTURE in all four scenarios.
4. Real Data Example
4.1. HapMap project
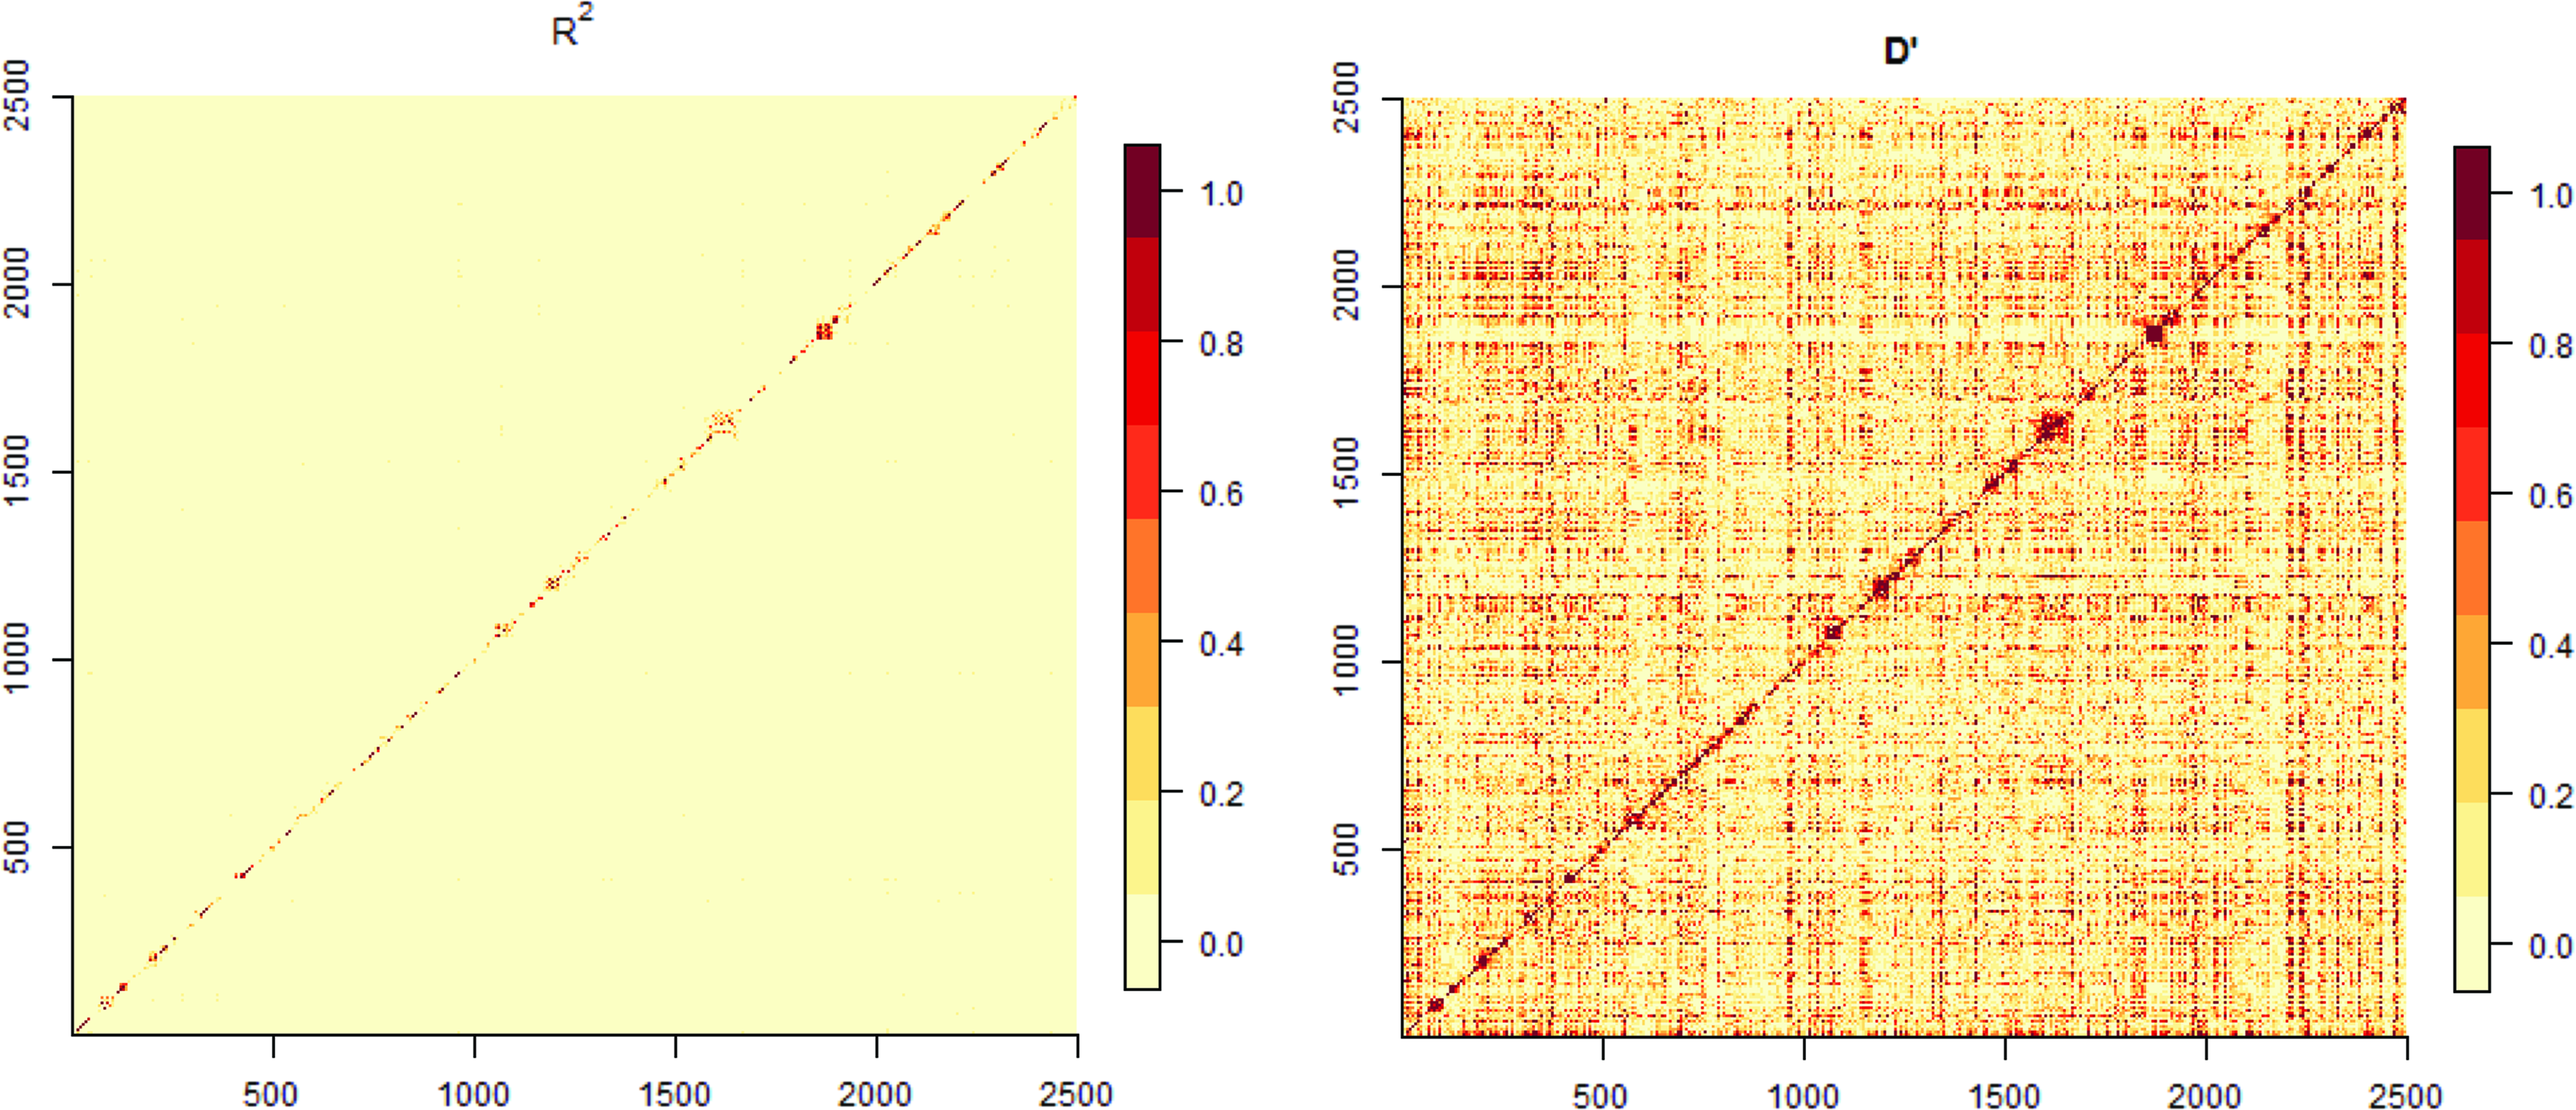
We applied our approach to HapMap 2005 project data sets that include both SNPs and CNVs. In the first illustration, we focused on 359 individuals from five ancestries MEX (50), JPT (42), YRI (113), CEU (112), and CHB (42), where we used the same filtering procedure as in Section 3 to sample 2500 SNPs and 792 CNVs. Thereafter, we examined whether the resulting data set exhibits LD by investigating \documentclass{aastex}\usepackage{amsbsy}\usepackage{amsfonts}\usepackage{amssymb}\usepackage{bm}\usepackage{mathrsfs}\usepackage{pifont}\usepackage{stmaryrd}\usepackage{textcomp}\usepackage{portland, xspace}\usepackage{amsmath, amsxtra}\usepackage{upgreek}\pagestyle{empty}\DeclareMathSizes{10}{9}{7}{6}\begin{document}
$$D \prime$$
\end{document} and r2. We particularly focused on the neighboring loci that may exhibit genetic linkage. As seen in Figure 3, we observed moderate LD, with several dark square boxes of varying size, in particular for \documentclass{aastex}\usepackage{amsbsy}\usepackage{amsfonts}\usepackage{amssymb}\usepackage{bm}\usepackage{mathrsfs}\usepackage{pifont}\usepackage{stmaryrd}\usepackage{textcomp}\usepackage{portland, xspace}\usepackage{amsmath, amsxtra}\usepackage{upgreek}\pagestyle{empty}\DeclareMathSizes{10}{9}{7}{6}\begin{document}
$$D \prime$$
\end{document} in the right panel. Before we proceed further, we present empirical support for our presumption that integrating CNV information with existing SNP data would provide better differentiation of population structure. We carried out a PCA (prcomp, R) and examined the marginal variations explained by the top principal components sequentially. As seen in Supplementary Figure S5, the CNV integration increases the total explained proportion of variation in our favor.
Two LD measures r2 and \documentclass{aastex}\usepackage{amsbsy}\usepackage{amsfonts}\usepackage{amssymb}\usepackage{bm}\usepackage{mathrsfs}\usepackage{pifont}\usepackage{stmaryrd}\usepackage{textcomp}\usepackage{portland, xspace}\usepackage{amsmath, amsxtra}\usepackage{upgreek}\pagestyle{empty}\DeclareMathSizes{10}{9}{7}{6}\begin{document}
$$D \prime$$
\end{document} are shown for 2500 SNPs from 359 individuals from MEX, JPT, YRI, CEU, and CHB. LD, linkage disequilibrium.
To determine the number of populations, we performed POPSTR conditional on a series of fixed number of ancestral populations. We progressively changed K from 3 to 8 and computed BIC values (Supplementary Fig. S2). According to the BIC, the joint model with three populations turns out to be optimal in both the three- and four-population scenarios. For the four-population scenarios, the small change in BIC between \documentclass{aastex}\usepackage{amsbsy}\usepackage{amsfonts}\usepackage{amssymb}\usepackage{bm}\usepackage{mathrsfs}\usepackage{pifont}\usepackage{stmaryrd}\usepackage{textcomp}\usepackage{portland, xspace}\usepackage{amsmath, amsxtra}\usepackage{upgreek}\pagestyle{empty}\DeclareMathSizes{10}{9}{7}{6}\begin{document}
$$K = 3$$
\end{document} and \documentclass{aastex}\usepackage{amsbsy}\usepackage{amsfonts}\usepackage{amssymb}\usepackage{bm}\usepackage{mathrsfs}\usepackage{pifont}\usepackage{stmaryrd}\usepackage{textcomp}\usepackage{portland, xspace}\usepackage{amsmath, amsxtra}\usepackage{upgreek}\pagestyle{empty}\DeclareMathSizes{10}{9}{7}{6}\begin{document}
$$K = 4$$
\end{document} is explained by genetic similarity between the MEX and CEU populations. For illustration purposes, we present the results from the four-population fit of POPSTR.
The convergence conditions for the posterior samples were satisfied numerically and visually, as seen in Supplementary Figure S4. Using 5000 iterations, the three-population MCMC chains converged before a thousand iterations. The posterior chains for the four ancestral probabilities also converged before 1000 iterations. Statistical inferences were performed with posterior samples after 2500 “burn-in” runs and thinning of every 10th iteration. Gelman and Rubin statistics (1992) was checked for numerical convergence for each chain. The absolute difference ratio in the log likelihoods is less than 10−6 and randomly selected MCMC chains visually converge, both of which empirically support the convergence of the MCMC chains.
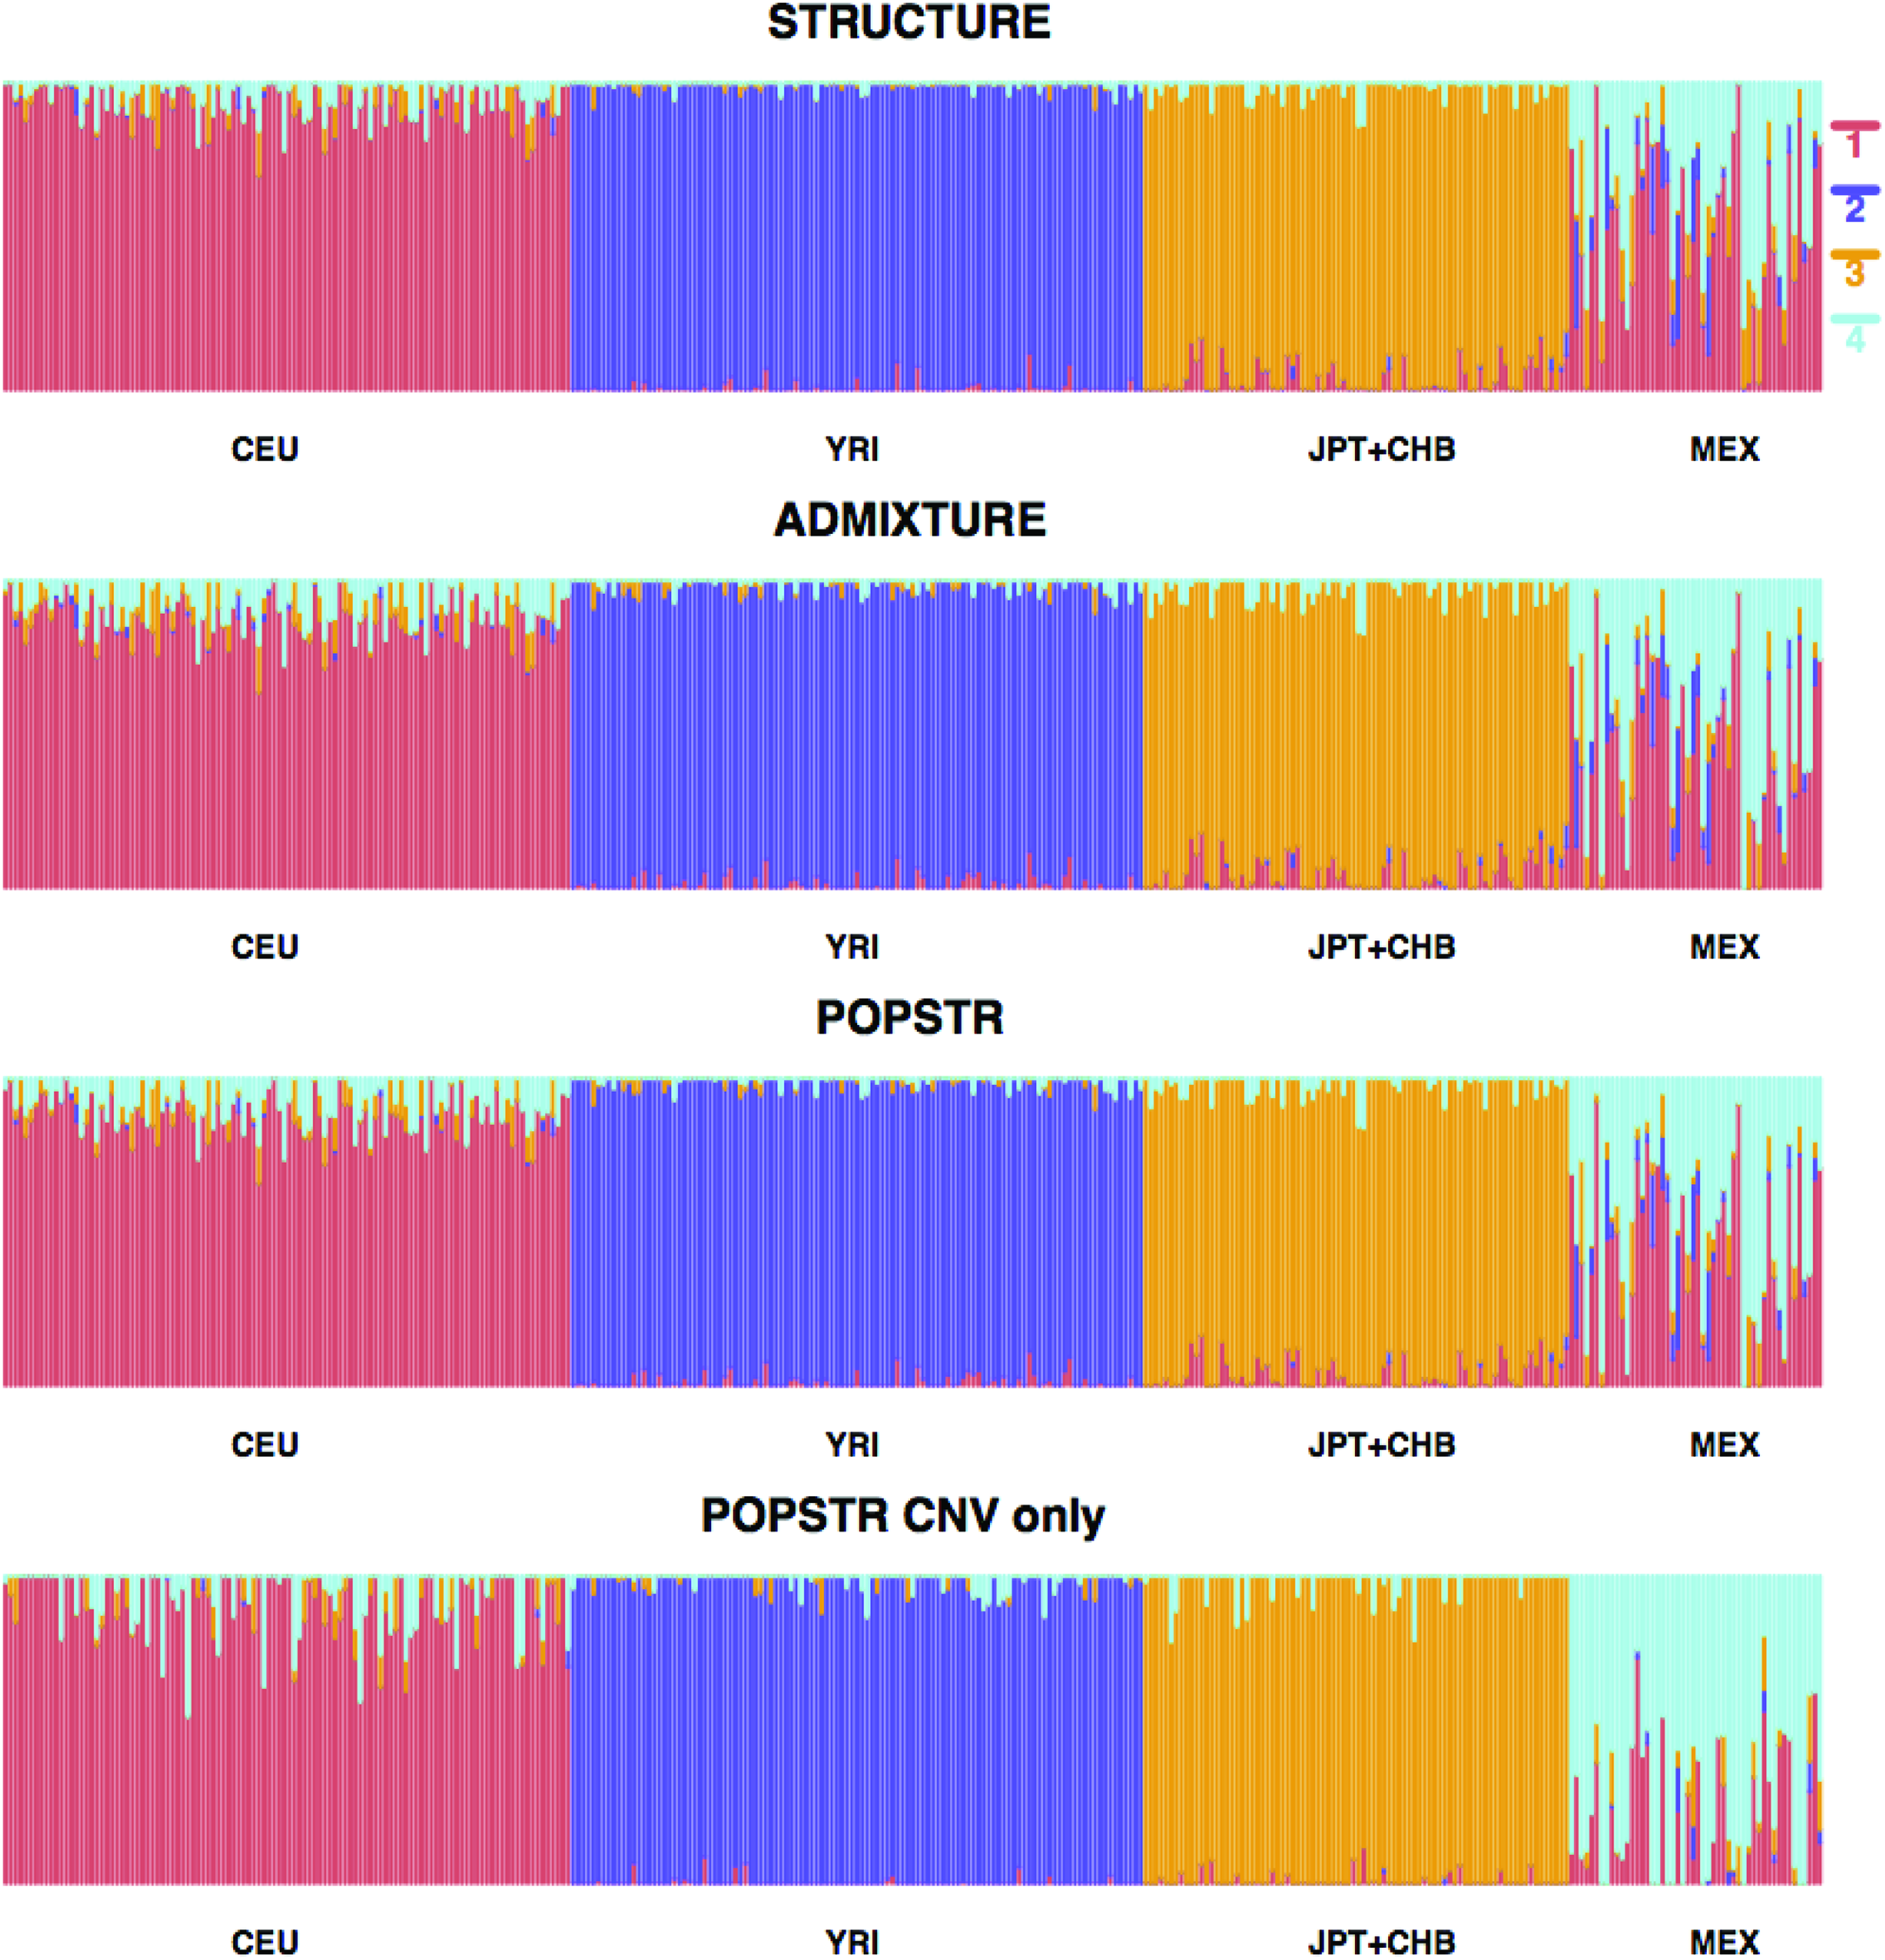
Figure 4 displays the estimated population structure using STRUCTURE, ADMIXTURE, and POPSTR (for SNP+CNV and CNV only) when K = 4. Compared to STRUCTURE, ADMIXTURE and POPSTR tend to give more weight to the population 4 ancestry for the MEX population. STRUCTURE and ADMIXTURE also show that MEX samples show relatively high admixture with population 1 while also exhibiting some mixture with populations 2 and 3. Some degree of ambiguity between CEU and MEX is expected due to the history of European colonialism. It is likely that many individuals who participated in HapMap studies in the MEX representative sample have substantial European admixture (Wang et al., 2008). POPSTR with CNVs only yields an average correlation of 0.92 across 359 individuals with the other three approaches, suggesting its potential utility when SNPs are not available.
Analyses of the HapMap 2005 data set using the CEU, YRI, JPT+CHB, and MEX populations, conditional on K = 4 using STRUCTURE (first), ADMIXTURE (second), POPSTR (third), and POPSTR with CNVs only (fourth). The admixture coefficient \documentclass{aastex}\usepackage{amsbsy}\usepackage{amsfonts}\usepackage{amssymb}\usepackage{bm}\usepackage{mathrsfs}\usepackage{pifont}\usepackage{stmaryrd}\usepackage{textcomp}\usepackage{portland, xspace}\usepackage{amsmath, amsxtra}\usepackage{upgreek}\pagestyle{empty}\DeclareMathSizes{10}{9}{7}{6}\begin{document}
$${q_{ik}}$$
\end{document} for each individual is represented by a vertical line where the height of each color reflects the estimated coefficient for a certain ancestral population. In the text, we refer to the ancestral populations as 1 = red, 2 = purple, 3 = orange, and 4 = blue.
We also analyzed another set of HapMap 2005 data using the following four different populations, as in ADMIXTURE: CEU (112), YRI (113), ASW (49), and MEX (50), where ASW represents a population of African ancestry from Southwestern United States. This data set consists of 324 individuals with 13,928 SNPs that were arbitrarily selected to be at least 200 kb apart (as discussed in ADMIXTURE) and have less than 5% missing genotypes. We applied the HWE test using a p-value cutoff of 0.001 to filter the number of SNPs down to 5714. The plots of LD measures \documentclass{aastex}\usepackage{amsbsy}\usepackage{amsfonts}\usepackage{amssymb}\usepackage{bm}\usepackage{mathrsfs}\usepackage{pifont}\usepackage{stmaryrd}\usepackage{textcomp}\usepackage{portland, xspace}\usepackage{amsmath, amsxtra}\usepackage{upgreek}\pagestyle{empty}\DeclareMathSizes{10}{9}{7}{6}\begin{document}
$$D \prime$$
\end{document} and r2 shown in Supplementary Figure S6 display significantly reduced \documentclass{aastex}\usepackage{amsbsy}\usepackage{amsfonts}\usepackage{amssymb}\usepackage{bm}\usepackage{mathrsfs}\usepackage{pifont}\usepackage{stmaryrd}\usepackage{textcomp}\usepackage{portland, xspace}\usepackage{amsmath, amsxtra}\usepackage{upgreek}\pagestyle{empty}\DeclareMathSizes{10}{9}{7}{6}\begin{document}
$$D \prime$$
\end{document} and r2 compared with Figure 3 in the previous example. High (in dark color) \documentclass{aastex}\usepackage{amsbsy}\usepackage{amsfonts}\usepackage{amssymb}\usepackage{bm}\usepackage{mathrsfs}\usepackage{pifont}\usepackage{stmaryrd}\usepackage{textcomp}\usepackage{portland, xspace}\usepackage{amsmath, amsxtra}\usepackage{upgreek}\pagestyle{empty}\DeclareMathSizes{10}{9}{7}{6}\begin{document}
$$D \prime$$
\end{document} at distant alleles may occur without any genetic linkage; thus, it is difficult to completely eliminate LD based on physical proximity.
Similarly, we determined the number of ancestral populations based on the BIC values. The three-population model was chosen for inference due to the best goodness-of-fit, while the four-population model has the second smallest BIC statistics (Supplementary Fig. S7). This result seems reasonable as the ASW group largely inherited their genetics from African and, to a lesser extent, European ancestry. In Figure 5, we display the population maps for the three-ancestral-population model using POPSTR compared with our benchmarks of ADMIXTURE and STRUCTURE. Similar to the previous example, the correlations among the three models are all high (>0.98). However, ADMIXTURE and POPSTR gave more weight to ancestral population 3—presumably representing Native American ancestry—for the MEX population compared with STRUCTURE, which gave more weight to ancestral population 1 (primarily European).
Analyses of the HapMap 2005 data set using the CEU, YRI, ASW, and MEX populations, conditional on K = 3 using STRUCTURE (top), ADMIXTURE (middle), and POPSTR (bottom). The admixture coefficient \documentclass{aastex}\usepackage{amsbsy}\usepackage{amsfonts}\usepackage{amssymb}\usepackage{bm}\usepackage{mathrsfs}\usepackage{pifont}\usepackage{stmaryrd}\usepackage{textcomp}\usepackage{portland, xspace}\usepackage{amsmath, amsxtra}\usepackage{upgreek}\pagestyle{empty}\DeclareMathSizes{10}{9}{7}{6}\begin{document}
$${q_{ik}}$$
\end{document} for each individual is represented by a vertical line where the height of each color reflects the estimated coefficient for a certain ancestral population. In the text, we refer to the ancestral populations as 1 = purple, 2 = red, and 3 = orange.
5. Discussion
We propose POPSTR, a Bayesian integrative modeling approach using SNPs and CNVs for inferring population structure. The joint likelihood of SNPs and CNVs becomes the product of their marginal likelihoods under the conditional independence assumption, which makes it easier to obtain estimates of the population admixture coefficients. The increased computational burden is handled via the implementation of the MALA, which improves the standard MCMC algorithm by providing a shortcut to the target posterior distribution. From simulation studies, the benefit of POPSTR is more pronounced when populations are very admixed with a scarcity of unmixed individuals. Simulation studies also support the utility of CNV data alone in the absence of SNP data. In the data analysis based on two HapMap 2005 data sets, we observed that POPSTR yielded comparable but subtly different results in ancestral estimation compared with ADMIXTURE and STRUCTURE. This may suggest that the CNV data provide additional information that SNPs do not offer.
Contrary to our assumption that the markers are independent after the filtering process, multiple CNV or SNP loci that are functionally connected to other loci in the same pathway can still lead to LD. Since the presence of severe LD is known to cause the underestimation of variation in allele frequencies and population-specific coefficients, in this article we considered filtering SNPs that were 200 kb apart. We note that this is not a panacea, as it can lead to loss of available information. Falush et al. (2003) tackled LD through modeling different sources of LD and discussed the influence of LD on admixture estimation, introducing a Hidden Markov Model structure in the likelihood for the SNPs. Correlations between CNVs and SNPs can also be the result of a common evolutionary process at certain genes or genes in the same pathways. For future research, we will deal with this functional connectivity by modeling the correlation structure in the joint likelihood framework.
Extensions of this joint model are not limited to hybrids of SNPs and CNVs. For example, Sohn et al. (2012) proposed a nonparametric Bayesian model using haplotypes and Shringarpure and Xing (2009) proposed a Bayesian variational inference model that uses microsatellites and SNPs to infer population structure. Pronold et al. (2012) implemented the t-test and linear discriminant analysis using CNVs to predict population ancestry. Gattepaille and Jakobsson (2012) proposed using haplotypes to resolve LD issues from SNPs and showed the accuracy improvement in genetic ancestry estimation. Hellenthal et al. (2014) modeled haplotypes to infer historical mixture events at fine scales. All of the above examples offer additional opportunities for improved ancestral estimation.
Contrary to our belief that such integration of different types of sequencing data improves estimation of admixed populations, the presence of noise and correlation between different data sources, if not properly handled, could lead to undesirable consequences. Hence, we recommend that one first examines the expected benefit via running exploratory PCA. The increased volume of data can be overcome if we select an informative subset of loci, which can be obtained a priori or through dimension-reduction techniques. In terms of computation, parallel computing platforms, which are becoming increasingly prevalent, can be an alternative route to reduce computing time. POPSTR also supports parallel computing for R where the number of threads is an input for running POPSTR.
Footnotes
Acknowledgment
This project was partly supported by a research contract from the Inova Translational Medicine Institute, Inova, Falls Church, VA.
Author Disclosure Statement
No competing financial interests exist.
References
1.
AlexanderD.H., NovembreJ., and LangeK.2009. Fast model-based estimation of ancestry in unrelated individuals. Genome Res. 19, 1655–1664.
2.
AtchadeY.2006. An adaptive version for the metropolis adjusted Langevin algorithm with a truncated drift. Methodol. Comput. Appl. Probab. 8, 235–254.
3.
BaldingD.2006. A tutorial on statistical methods for population association studies. Nat. Rev., 7, 781–791.
4.
CampbellC.D., OgubrnE.L., LunettaK.L., et al.2005. Demonstrating stratification in a European American population. Nat. Genet., 37, 868–872.
5.
CatarinaD.C., SampasN., TsalenkoA., et al.2011. Population-genetic properties of differentiated human copy-number polymorphisms. Am. J. Hum. Genet., 88, 317–332.
6.
ColobranR., ComasD., FanerR., et al.2008. Population structure in copy number variation and SNPs in the CCL4L chemokine gene. Genes Immun. 9, 279–288.
7.
ConradD., PintoD., RedonR., et al.2009. Origins and functional impact of copy number variation in the human genome. Nature. 464, 704–712.
8.
FalushD., StephensM., and PritchardJ.K.2003. Inference of population structure using multi-locus genotype data, linked loci, and correlated allele frequencies. Genetics, 164, 1567–1587.
9.
GattepailleL.M., and JakobssonM.2013. Inferring population size changes with sequence and SNP data: Lessons from human bottlenecks. Heredity, 110, 409–419.
10.
GelmanA., and RubinD.B.1992. Inference from iterative simulation using multiple sequences. Stat. Sci. 27, 457–511.
11.
HellenthalG., BusbyG.B.J., WilsonJ.F., et al.2014. A genetic atlas of human admixture history. Science, 14, 747–751.
12.
JakobssonM., ScholzS., ScheetP., et al.2008. Genotype, haplotype and copy-number variation in worldwide human populations. Nature, 451, 998–1003.
13.
McCarrollS.A., KuruvillaF.G., KornJ.M., et al.2008. Integrated detection and population-genetic analysis of SNPs and copy number variation. Nat. Genet., 40, 1166–1174.
14.
NovembreJ., and StephensM.2008. Interpreting principal component analyses of spatial population genetic variation. Nat. Genet., 40, 646–649.
15.
PattersonN., PriceA., and ReichD.2006. Population structure and eigenanalysis. PLoS Genet. 2, e190.
16.
Porras-HurtadoL., RuizY., SantosC., et al.2013. An overview of STRUCTURE: Applications, parameter settings, and supporting software. Front. Genet. 4, 98.
17.
PriceA., ButlerJ., PattersonN., et al.2008. Discerning the ancestry of European Americans in genetic association studies. PLoS Genet. 4, e236.
18.
PriceA., PattersonN., PlengeR., et al.2006. Principal components analysis corrects for stratification in genome-wide association studies. Nat. Genet., 38, 904–909.
19.
PritchardJ.K., StephensM., and DonnellyP.2000. Inference of population structure using multilocus genotype data. Genetics, 155, 945–959.
20.
PronoldM., ValiM., Pique-Regi, et al.2012. Copy number variation signature to predict human ancestry. BMC Bioinformatics. 13, 336.
21.
RajA., StephensM., and PritchardJ.K.2014. fastSTRUCTURE: Variational inference of population structure in large SNP data sets. Genetics. 197, 573–589.
22.
RedonR., IshikawaS., FitchK.R., et al.2006. Global variation in copy number in the human genome. Nature. 444, 444–454.
23.
RobertsG.O., and RosenthalJ.S.2001. Optimal scaling for various metropolis-hastings algorithms. Stat. Sci. 16, 351–367.
24.
RobertsG.O., and TweedieR.1996. Exponential convergence of Langevin distributions and their discrete approximations. Bernoulli. 2, 341–363.
25.
RosenbergN., PritchardJ., WeberJ., et al.2002. Genetic structure of human populations. Science. 298, 2381–2385.
26.
RousseeuwP.1987. Silhouettes: A graphical aid to the interpretation and validation of cluster analysis. Comput. Appl. Math. 20, 53–65.
27.
SchwarzG.1978. Estimating the dimension of a model. Ann Stat. 6, 461–464.
28.
ShringarpureS., and XingE.P.2009. mStruct: Inference of population structure in light of both genetic admixing and allele mutations. Genetics, 182, 575–593.
29.
SohnK., GhahramaniZ., and XingE.P.2012. Robust estimation of local genetic ancestry in admixed populations using a nonparametric Bayesian approach. Genetics, 191, 1295–1308.
30.
TangH., PengJ., WangP., et al.2005. Estimation of individual admixture: Analytical and study design considerations. Genet. Epidemiol., 28, 289–301.
31.
The International HapMap Consortium. 2005. A haplotype map of the human genome. Nature, 437, 1299–1320.
32.
TianC., GregersenP.K., and SeldinM.F.2008. Accounting for ancestry: Population substructure and genome-wide association studies. Hum. Mol. Genet., 17, 143–150.
33.
WangS., RayN., RojasW., et al.2008. Geographic patterns of genome admixture in Latin American Mestizos. PLoS Genet. 4, e1000037.
Supplementary Material
Please find the following supplemental material available below.
For Open Access articles published under a Creative Commons License, all supplemental material carries the same license as the article it is associated with.
For non-Open Access articles published, all supplemental material carries a non-exclusive license, and permission requests for re-use of supplemental material or any part of supplemental material shall be sent directly to the copyright owner as specified in the copyright notice associated with the article.