




Abstract
Abstract
In vitro experiments were conducted in this work to analyze the proliferation of tumor (DU-145) and normal (macrophage RAW 264.7) cells under the influence of a chemotherapeutic drug (doxorubicin). Approximate Bayesian Computation (ABC) was used to select among four competing models to represent the number of cells and to estimate the model parameters, based on the experimental data. For one case, the selected model was validated in a replicated experiment, through the solution of a state estimation problem with a particle filter algorithm, thus demonstrating the robustness of the ABC procedure used in this work.
Nomenclature
Introduction
I
Mathematical models play an important role in various aspects related to cancer, which range from the modeling of biophysical and biochemistry phenomena at the cellular scale, to larger scale and multiple scale phenomena related to imaging techniques and to treatments such as chemotherapy, radiotherapy, hyperthermia, etc. (see, e.g., Spratt et al., 1996; Gatemby, 1998; Bellomo et al., 2003; Byrne, 2003; Preziozi, 2003; Alarcón et al., 2004; Araujo and McElwain, 2004; Byrne et al., 2006; Sanga et al., 2006; Mohammadi et al., 2008; Gatenby 2009; Pinho et al., 2011, 2013; and Rodrigues et al., 2012, 2016). However, more detailed models certainly involve a larger number of input parameters and might not be more accurate than simpler mathematical models with fewer parameters, for example, to represent macroscopic variables like the number of tumor and normal cells or the mass of a chemotherapy drug in a region of the body. Indeed, model parameters represent a large source of uncertainties for the dependent variables, since, in general, they exhibit large variability from individual to individual and even for the same individual under different physiological conditions. Therefore, the choice of a mathematical model to accurately represent the phenomena under analysis, as well as the identification of the model parameters, is a subject of great importance for the individualized detection and treatment of cancer.
The main objective of this article is to apply model selection and model calibration (estimation of the model parameters) for the number of tumor and normal cells during in vitro chemotherapy experiments. Due to the scarce number of measurements, their related uncertainties were not represented in terms of classical statistical distributions and an Approximate Bayesian Computation (ABC) technique (Del Moral et al, 2007; Sisson et al., 2007; Toni et al., 2009; Toni and Stumpf, 2010a; Del Moral et al., 2012) was used for the simultaneous model selection/calibration based on the experimental data. The algorithm of Toni et al. (2009), which was successfully applied by da Costa et al. (2017) for the simultaneous model selection/calibration with synthetic measurements of the number of tumor cells in simulated experiments, is used in this work with actual experimental data involving tumor (DU-145 prostate line) and normal (RAW 264.7 macrophage) cells treated with doxorubicin. The different mathematical models examined in this work are systems of ordinary differential equations for the dependent variables, given by the number of cells and the mass of chemotherapeutic drug.
The model selected with the algorithm of Toni et al. (2009) was further validated in a replicated experiment for one specific case, by solving a state estimation problem (Kalman, 1960; Sorenson, 1970; Maybeck, 1979; Arulampalam et al., 2002; and Kaipio and Somersalo, 2004). In state estimation problems, uncertainties in the mathematical model that represents the physical phenomena and uncertainties in the measurements are appropriately accounted for within the Bayesian framework of statistics, to obtain more accurate estimates of the state variables. Sequential Monte-Carlo techniques, also referred to as particle filters, are the most general for the solution of state estimation problems and can be applied to nonlinear models with non-Gaussian uncertainties (Liu and Chen, 1998; Carpenter et al., 1999; Doucet et al., 2000; Arulampalam et al., 2002; Andrieu et al., 2004; Kaipio and Somersalo, 2004; Ristic et al., 2004; Del Moral et al., 2006; Johansen and Doucet, 2008; and Orlande et al., 2012). In this work, the particle filter algorithm of Liu and West (2001) was used for the model validation; this algorithm was successfully applied for the simultaneous estimation of state variables and parameters in the modeling of tumor growth by Costa et al. (2015).
The experiment performed in this work is presented in the next section, which is followed by a description of the mathematical models that are proposed to represent the experimental data. The algorithm of Toni et al. (2009), which is used in this study for model selection and model calibration, is then presented and applied to our experimental data. The results obtained in this work for the model selection/calibration are presented and discussed. Furthermore, the model selected for a specific case is validated with an additional set of experimental data, by using the algorithm of Liu and West (2001) of the particle filter.
Experiments
Cell culture
DU-145 prostate cancer cells and RAW 264.7 macrophage cells (ATCC—American Type Culture Collection, Manassas, VA) were purchased from the cell bank of the Federal University of Rio de Janeiro. The cell lines were grown in 75-cm3culture flasks with RPMI (Roswell Park Memorial Institute medium; Sigma-Aldrich) and DMEM (Dulbecco's modified Eagle's medium; Sigma-Aldrich), respectively, supplemented with 10% fetal bovine serum (FBS; Life Technologies, Grand Island, NY), 4 mM glutamine, and 100 U/mL penicillin and 100 μg/mL streptomycin. The cells were maintained at 37°C in a 5% CO2 humidified atmosphere. The medium was changed every 2 days until 90%–95% confluence of the culture. At confluence, the cells were passaged by detaching them with 0.025% trypsin diluted in Verséne solution-EDTA (ethylenediaminetetraacetic acid; NaCl 0.14 M, Na2HPO4 9 mM, KCl 3 mM, phenol red 0.02%, and EDTA 0.02%) and centrifuged at 1100 RPM for 10 minutes. After centrifugation, the sediments with the DU 145 cells and the RAW 264.7 cells were diluted in RPMI and DMEM, respectively, both containing 10% FBS. The cells were then counted in a hemocytometer and seeded into 96-well plates for cell proliferation assay.
Cell proliferation assay
The cell proliferation was observed by using the colorimetric method of MTT (bromide 3-[4,5-dimethyl-thiazole-2-il]-2,5-diphenyltetrazolium; Sigma-Aldrich). This assay detected viable cells through the conversion of MTT into formazan by cell mitochondrial enzyme succinate dehydrogenase. In brief, DU-145 and RAW 264.7 macrophages were seeded into 96-well plates at a concentration of 103 and 104 cells per well, respectively, in culture medium supplemented with 10% FBS for cell adhesion. After 3 hours, the culture medium was removed and the cells were treated with doxorubicin (10 μM), diluted in RPMI or DMEM (depending on the cell), and supplemented with 5% of FBS for the chemotherapy experiments.
The variation of the number of cells was measured by the addition of MTT (Sigma-Aldrich) solution (1 mg/mL). At each time, the MTT was removed, the formazan crystals solubilized with isopropanol and the absorbance measured in a spectrophotometer at 490 nm (Thermo Fisher). The measurements of the number of cells were made in triplicates; the mean and the standard deviations of each triplicate are reported in the article.
Table 1 summarizes the different experiments performed in this work. DU-145 (tumor) cells were used for experiments 1 and 2, whereas RAW 264.7 (macrophage) cells were used for experiments 3–5. No chemotherapeutic drug was used for experiments 1 and 3, but the interaction of the cells with doxorubicin was analyzed in experiments 2, 4, and 5. Experiment 5 was a repetition of experiment 4.
Experiments
Mathematical Models
There is a large number of mathematical models available in literature for the modeling of tumor growth with different degrees of refinement, for the vascular and avascular stages, which are in general based on systems of ordinary and/or partial differential equations (see, e.g., Spratt et al., 1996; Gatemby, 1998; Bellomo et al., 2003; Byrne, 2003; Preziozi, 2003; Alarcón et al., 2004; Araujo and McElwain, 2004; Byrne et al., 2006; Sanga et al., 2006; Mohammadi et al., 2008; Gatenby, 2009; Pinho et al., 2011, 2013; and Rodrigues et al., 2012, 2016). We note, however, that more refined models do not necessarily predict the dependent variables of interest more accurately, in special because a large number of uncertain input parameters is required for their solutions (Beck and Arnold, 1977; Mantzaris et al., 2004; Roose et al., 2007).
Four different models, based on ordinary differential equations, were used in this work to represent the time variation of the number of cells in the wells, namely: (1) Generalized Logistic model (Spratt et al., 1996; Tsoularis and Wallace, 2002); (2) Gompertz's model (Winsor, 1932; Spratt et al., 1996); (3) Exponential model (Spratt et al., 1996); and (4) Modified Gompertz's model. They are referred hereafter as models 1, 2, 3, and 4, respectively. Ordinary differential equation models were selected because of the nature of the experiments, where the measurements do not possess a local (spatial) resolution, but represent the average number of cells in each well at a specific time. Whenever the chemotherapy drug was used in the experiments, the pharmacodynamics model was considered in the form of a Holling's type 2 function (Holling, 1959a,b; Pinho et al., 2013; Costa et al., 2015; Rodrigues et al., 2016) and a first-order pharmacokinetics model was considered to govern the mass of drug in the well. The four models are given by:
where
and N(t) and Q(t) are the number of cells and mass of chemotherapy drug in the well, respectively, subscripts i = 1, 2, 3, 4 designate the model, α is the cell growth rate, K is the cell support capacity, μ is the cell reduction rate due to the chemotherapy, a is a Holling's type 2 constant that controls the drug intake by cells, β is the saturation rate, and λ is the decay rate of the chemotherapy drug.
While models 1, 2, and 3 have been classically used to represent the growth of tumors (Spratt et al., 1996), model 4 was proposed in this work to account for reductions in the growth rate of the number of cells as time increases. Note that model 4 reduces to model 2 for small values of β.
Each model was subjected to the initial conditions given by the number of cells shown in Table 1, depending on the case analyzed. The drug was administered as a single bolus at time t = 0 in the chemotherapy experiments (cases 2, 4, and 5), so that the initial condition for the mass of drug was Q0 = 5.4352 mg.
Model Selection and Model Calibration
Parameters appearing in the mathematical formulation of physical problems can be estimated by several statistical techniques (Beck and Arnold, 1977; Ozisik and Orlande, 2000; Putter et al., 2002; Brown and Sethna, 2003; Kaipio and Somersalo, 2004; Timmer et al., 2004; and Sisson et al., 2007). However, techniques within the Bayesian framework, like the Markov Chain Monte Carlo method, recently became popular because of nowadays available computer power. In the Bayesian framework, prior knowledge about the parameters, modeled in the form of a statistical distribution,
The experimental uncertainties cannot be appropriately modeled for several practical cases and, thus, the likelihood function might not be represented in terms of analytical statistical distributions. The so-called ABC can be utilized for such cases, as well as for others, where the computation of the likelihood function becomes intractable (Beaumont et al., 2002; Marjoram et al., 2003; Toni et al., 2009; Wegmann et al., 2009; Toni and Stumpf, 2010a). The objective of ABC is to approximate the posterior distribution
ABC is used in this work for simultaneous model selection and parameter estimation because the available measured data are too scarce to be appropriately represented in terms of an analytical statistical distribution. Related works can be found in the literature, such as Toni et al. (2009), Toni and Stumpf (2010b), and Drovandi and Pettitt (2011a,b). The algorithm of Toni et al. (2009), which is an extension of the Sequential Monte Carlo algorithm of Sisson et al. (2007), is used for the selection of the four models given by Equations (1.a–d), as applied to the experimental data described previously. Therefore, the objective is to approximately obtain the combined posterior distribution (Toni et al., 2009):
where
Approximate Bayesian Computation Algorithm
Toni et al. (2009).
Results and Discussions
For the application of the algorithm of Toni et al. (2009) to the measurements of the number of cells from the experiments presented in Table 1, the distance function was specified as
where
The tolerance for
In Equation (4), where W is the trace of the covariance matrix of the measurements. The tolerance for the first iteration was set as ɛ1 = 3 × 10¹³ cell2. The algorithm was then stopped either if the tolerance based on the Discrepancy Principle was satisfied or if no new particles were accepted (a clear indication that the representation of the experimental data could not be improved with the competing models).
Each of the four models given by Equations (1.a–d) was initially assumed as equally probable for the analysis of the experiments described in Table 1. Similarly, uniform priors were prescribed for each parameter. Table 3 shows the minimum and maximum values specified for these uniform distributions, which differ by several orders of magnitude for most of the parameters. Therefore, from a practical point of view, these uniform priors can be considered as noninformative despite their finite variances. The perturbation kernel Kp (see step 3 in Table 2) was given in terms of a random walk process with uniform distribution U(–σ, σ) for each parameter, where σ is half of the interval of the uniform prior given by Table 3.
Uniform Priors for the Parameters
The results obtained for experiments 1 and 2 (Table 1) are first analyzed. These experiments dealt with the DU-145 (tumor) cells without and with chemotherapy, respectively. Figure 1 presents the number of particles selected for the models, as the populations advanced in the algorithm of Toni et al. (2009), for experiment 1. We notice in this figure that the number of particles selected for model 1 steadily decreased after population 12 and then disappeared at population 23. As the number of particles selected for model 1 decreased, the number of particles selected for model 4 increased after population 13. Models 2 and 4 might closely compete for the representation of the experimental data, such as observed in Figure 1, since model 4 reduces to model 2 for small values of β. On the other hand, since the tolerance for the distance function decreased as the populations advanced, model 4 provided the best representation for the measurements of experiment 1, at population 23.
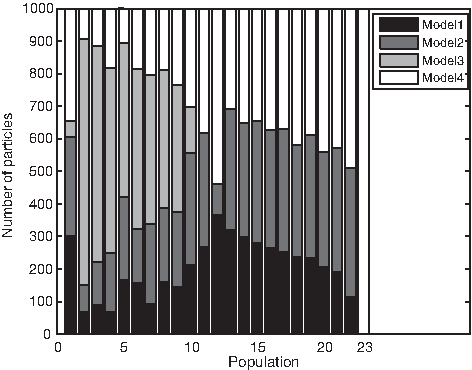
Number of particles selected for the models in each population. Experiment 1 (DU-145 cells without chemotherapy).
A comparison of the measurements and of the number of cells obtained with model 4 and its estimated parameters are presented in Figure 2A, B, at the first and final populations, respectively, for experiment 1. These figures show that the measurements were not correctly predicted in population 1. On the other hand, as the populations advanced and the tolerances were reduced, the best model was selected and calibrated for the most accurate prediction of the measurements. The median of the distance function of the particles selected for model 4 was reduced by two orders of magnitude, from the first to the last populations, for experiment 1. Figure 2A, and B show that, without the use of the chemotherapeutic drug in experiment 1, the number of tumor cells increased very fast from the initial condition of 103 cells to about 3.5 × 10⁵ cells in 60 hours.
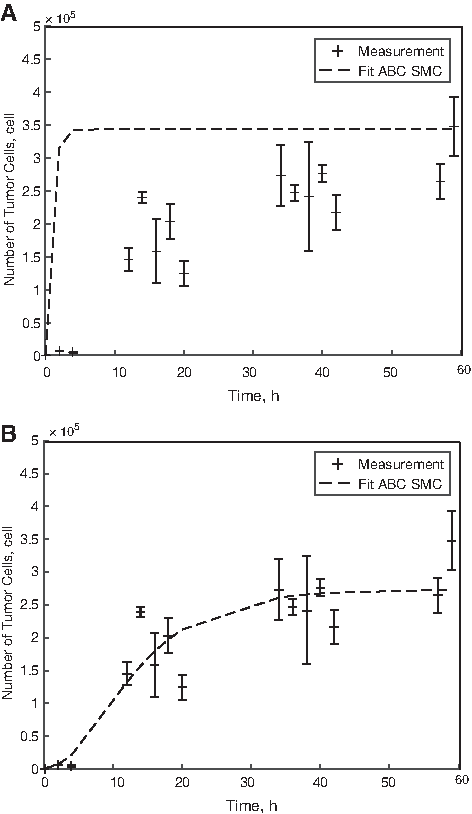
Measurements and number of cells estimated with model 4 for experiment 1 (DU-145 cells without chemotherapy).
The number of particles selected in each population is presented in Figure 3 for experiment 2, which also involved DU-145 cells, but under the effects of doxorubicin. Model 2, which is actually a special case of model 4 for small β, was selected as the one that better represents the measurements in this experiment. Figure 3 shows that both models 3 and 4 were not selected from population 26 onward. At population 26, model 2 exhibited the largest number of selected particles, except for few selections of model 1. As the tolerances were further reduced, there was a clear competition between models 1 and 2 to represent the experimental data. However, the particles of model 2 were the most selected after population 26 and, at population 36, no other model was selected.
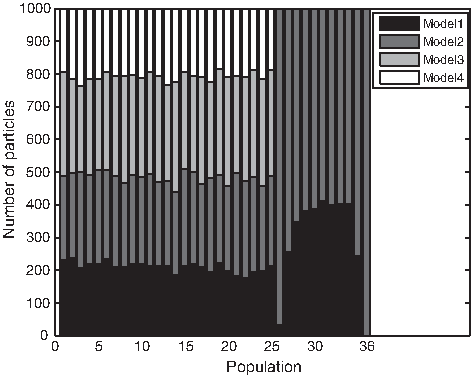
Number of particles selected for the models in each population. Experiment 2 (DU-145 cells with chemotherapy).
A comparison of measurements and number of cells predicted with model 2 at the final population is shown in Figure 4. Due to the large uncertainties in the measurements for this experiment, a reduction of only 4.5-fold was obtained for the median of the distance function of particles selected for model 2, from the first to the last populations. The number of cells predicted with model 2 follows the same trend of the experimental data, as shown in Figure 4. A comparison of Figures 2 and 4 reveals that the chemotherapeutic drug was capable of limiting the number of tumor cells. On the other hand, the tumor cells have still proliferated from their initial condition, thus demonstrating that the amount of drug used in this case (10 μM bolus at time t = 0) was not sufficient for their eradication.
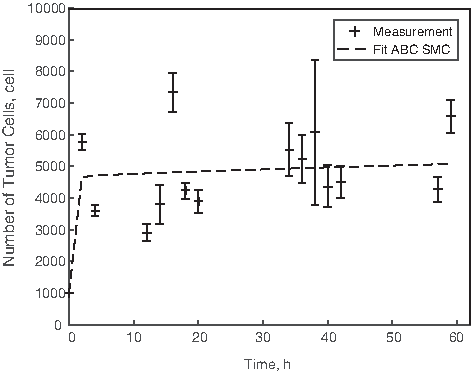
Measurements and number of cells estimated with model 2 for experiment 2 (DU-145 cells with chemotherapy) at the final population.
Table 4 shows the mean and 1% and 99% quantiles of the estimated parameters, for models 4 and 2 in experiments 1 and 2, respectively. It is noticed in this table that, with the exception of the parameters related to the pharmacodynamics (μ and a), all the others are estimated with quite small uncertainties.
Estimated Parameters for Experiments 1 and 2 at the Final Population
Experiments 3 and 4, which involved RAW 264.7 (macrophage) cells, without and with chemotherapy, respectively, are now analyzed. Such as for the tumor cells (Fig. 1), model 4 was selected to represent the measurements of experiment 3 for macrophage cells without chemotherapy, as shown in Figure 5. This figure shows that the number of particles selected for model 4 gradually increased from population 14 onward. At populations 22 and 23, model 4 was the only one selected. Although the algorithm had already selected model 4 among the competing models at population 22, one more population was needed to improve the parameter estimation for a more accurate representation of the experimental data. In fact, the agreement between the measurements and the estimated number of cells obtained with this model and its estimated parameters is quite good, as shown in Figure 6. Such as for experiment 1, the median of the distance function of the particles selected for model 4 was reduced by two orders of magnitude from the first to the last populations in experiment 3. Similar results were obtained for experiment 4 (macrophage cells with chemotherapy), where model 4 was also selected as the one that better represents the experimental data (Fig. 7). The comparison between measurements and estimated number of cells is presented in Figure 8 for experiment 4.
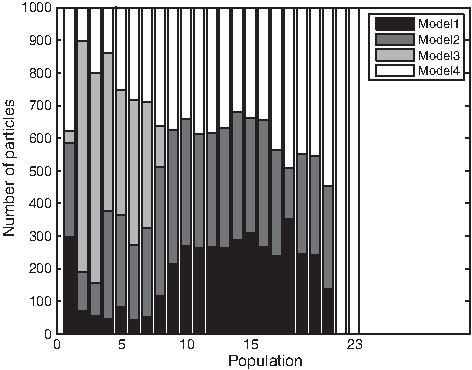
Number of particles selected for the models in each population. Experiment 3 (RAW 264.7 cells without chemotherapy).
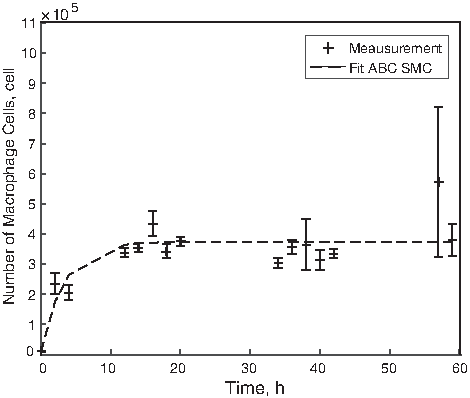
Measurements and number of cells estimated with model 4 for experiment 3 (RAW 264.7 cells without chemotherapy) at the final population.
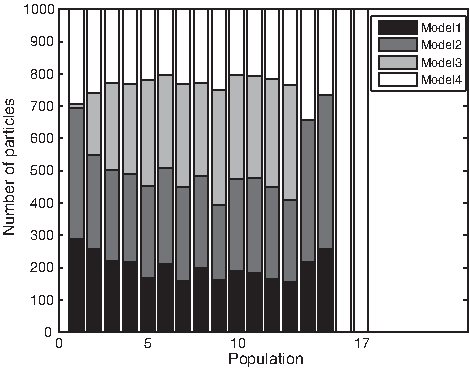
Number of particles selected for the models in each population. Experiment 4 (RAW 264.7 cells with chemotherapy).
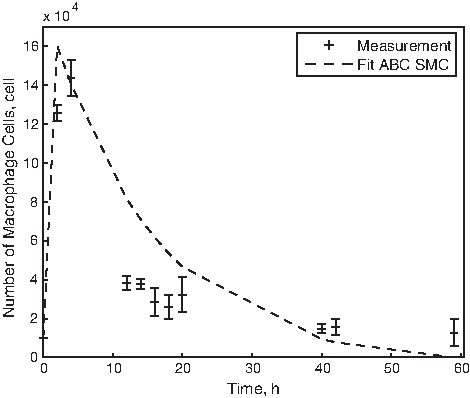
Measurements and number of cells estimated with model 4 for experiment 4 (RAW 264.7 cells with chemotherapy) at the final population.
It is interesting to compare Figures 4 and 8, for experiment 2 (tumor cells with chemotherapy) and for experiment 4 (macrophage cells with chemotherapy), respectively. Although doxorubicin, with the dosage used in the experiments of a single 10 μM bolus at time t = 0, was not capable of completely killing the tumor cells (Fig. 4), it substantially affected the macrophage cells (Fig. 8). After a sudden proliferation, the macrophage cells were practically reduced to the initial condition (104 cells) after 60 hours. This reduction of the number of macrophage cells was not observed in experiment 3 without chemotherapy, as shown in Fig. 6.
The estimated parameters for model 4 in experiments 3 and 4 are presented in Table 5, in terms of their mean, as well as their 1% and 99% quantiles. Model 4 was also selected for experiment 5, which is a repetition of experiment 4. The parameters estimated for experiment 5 are also presented in Table 5. Except for the support capacity, K, and the rate of cell reduction due to the chemotherapy, μ, the mean estimated for the parameters fall within the credibility intervals of the replicated experiment. Differences in the estimated support capacities and rates of cell reduction for experiments 4 and 5 can be associated to linear dependence among parameters, in special, α, K, and β.
Estimated Parameters for Experiments 3, 4, and 5 at the Final Population
After the application of Toni et al.'s algorithm (2009) for the model selection and model calibration described previously, the particle filter algorithm of Liu and West (2001) was used for the solution of state estimation problems in the replicated experiments (experiments 4 and 5). State estimation problems are also referred to as nonstationary inverse problems (Kaipio and Somersalo, 2004). In this kind of problems, the available measured data are used together with prior knowledge about the physical phenomena and the measuring devices, to sequentially produce estimates of the desired dynamic variables. This is accomplished in such a manner that the error is minimized statistically (Maybeck, 1979; Winkler, 2003; Kaipio and Somersalo, 2004; Orlande et al., 2012). In state estimation problems, uncertainties in the mathematical model and in the measurements are taken into account for the better prediction of the state variables, which are given in the present work by the number of cells and the mass of chemotherapy drug. The algorithm of Liu and West (2001) is an extension of the Auxiliary Sampling Importance Resampling algorithm of the particle filter (Pitt and Shephard, 1999; Arulampalam et al., 2002; Doucet et al., 2001; Ristic et al., 2004) for simultaneous estimation of state variables and model parameters, where the uncertainties in the parameters are modeled in terms of a combination of Gaussian kernels (Liu and West, 2001).
Details of Liu and West's algorithm (2001) are avoided in this study for the sake of brevity, but they can be readily found in Doucet et al. (2001), Da Silva et al. (2014), Orlande et al. (2012), Costa et al. (2015), and Váron et al. (2015). Costa et al. (2015) applied Liu and West's algorithm (2001) for the simultaneous estimation of state variables and parameters in ordinary differential equation models of tumor growth, which included as state variables the number of tumor, normal and angiogenic cells, as well as the mass of chemotherapy drug in the body.
The solution of the state estimation problem is illustrated by using the measurements of experiment 4 and by initially taking the parameter values as those estimated in experiment 5, for model 4. Uncertainties in the mathematical model were assumed as additive, uncorrelated, Gaussian, with zero mean and a standard deviation of 10% of the value of the state variables. Uncertainties in the model parameters were also assumed as additive, uncorrelated, Gaussian and with zero mean, but with a standard deviation of 15% of the parameter values. The particle filter algorithm of Liu and West (2001) was applied with 2000 particles (Costa et al., 2015).
Figures 9 and 10 present the transient variations of the number of cells and of the mass of the chemotherapy drug, estimated with Liu and West's algorithm (2001). Figure 9 shows that the particle filter is capable of very accurately tracking the measured data by using model 4, which was selected above with the ABC algorithm. The mass of chemotherapeutic drug, for which there are no measurements available, can also be estimated with small uncertainties as presented in Figure 10. This figure shows the reduction of the mass of chemotherapy drug in the well, as it is consumed by the cells during the experiment. Figure 11A–E presents the time evolution of the model parameters estimated with the particle filter algorithm of Liu and West (2001) for experiment 4. The parameter values estimated with the ABC algorithm of Toni et al. (2009; Table 5) are also presented in these figures. Figure 11A–E shows that the values estimated with the ABC algorithm of Toni et al. (2009) are all inside the credibility intervals predicted with the particle filter algorithm of Liu and West (2001).
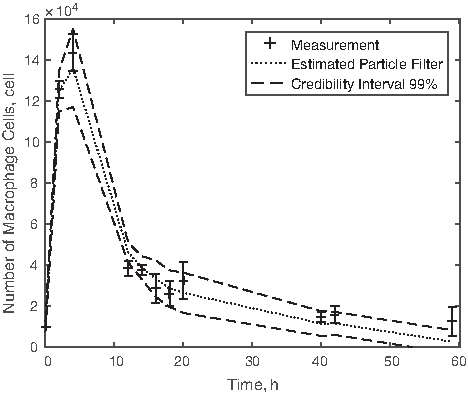
Number of cells estimated with the particle filter algorithm of Liu and West (2001) for experiment 4.
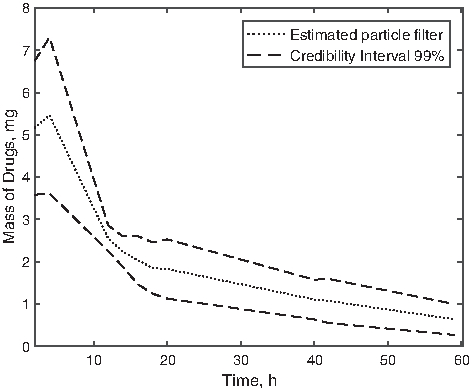
Mass of chemotherapy drug estimated with the particle filter algorithm of Liu and West (2001) for experiment 4.
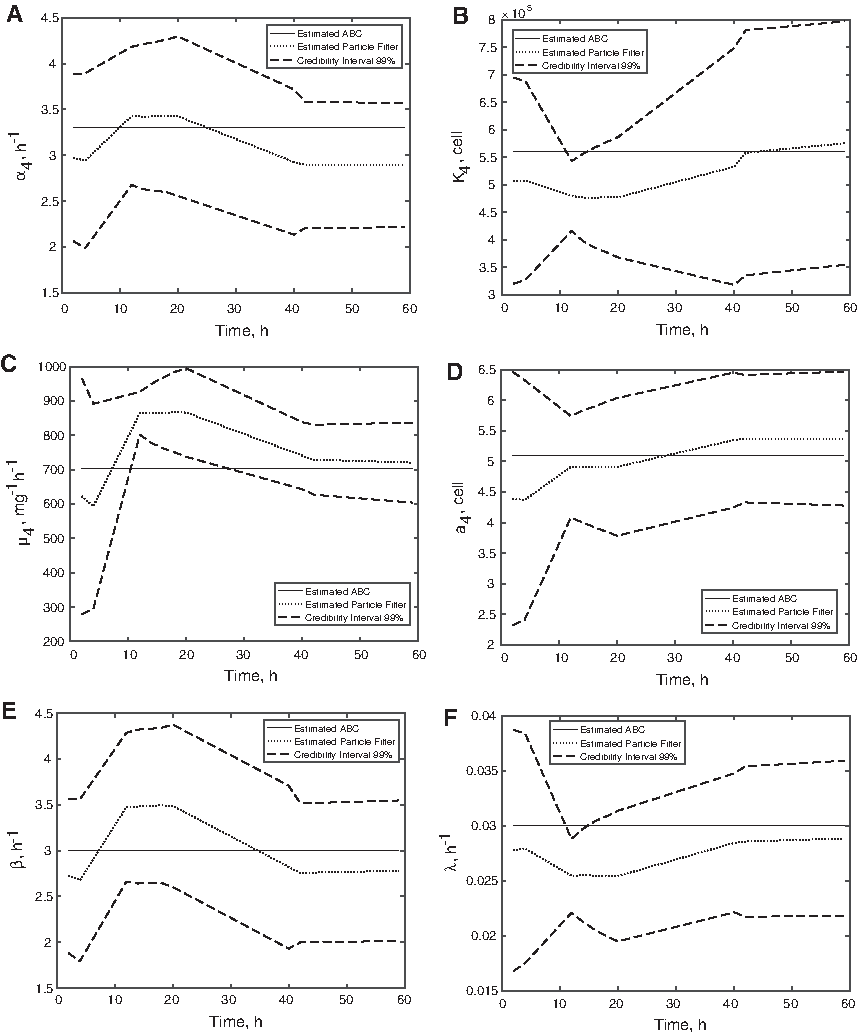
Parameters estimated with the particle filter algorithm of Liu and West (2001) for experiment 4:
Conclusions
In this article, we presented the application of an ABC algorithm for the simultaneous model selection and parameter estimation in chemotherapy in vitro experiments. The experiments dealt with tumor (DU-145) and normal (macrophage RAW 264.7) cells under the influence of doxorubicin. In each experiment, the time evolution of the number of cells was measured. Four models based on ordinary differential equations were proposed to represent the number of cells as a function of time, where the pharmacodynamics was considered in the form of a Holling's type 2 function and the pharmacokinetics as a first-order model. The ABC algorithm of Toni et al. (2009) used in this work was capable of selecting the model and estimating the parameter values that most accurately represent the measurements, in experiments with and without chemotherapy for the two cell lines. Such was the case, despite that all models were initially considered as equally probable and the prior information for the parameters were considered as uniform distributions with large variances.
While the Gompertz model was selected for the experiment with the tumor cells under chemotherapy, the Modified Gompertz model was selected for the other experiments. With the chemotherapy dosage used in the experiments, of one single 10 μM bolus of doxorubicin at the initial time, the tumor cells have still proliferated from their initial condition, although their support capacity was smaller than that for the case without chemotherapy. On the other hand, the chemotherapy drug substantially affected the macrophage cells, which were reduced to their initial condition at the end of the experiment. This reduction of the number of macrophage cells was not observed in the experiments without chemotherapy.
A state estimation problem was solved with the particle filter algorithm of Liu and West (2001) as a validation of the approach used in this work for model selection and parameter estimation. Indeed, in a replicated experiment for the case with macrophage cells under chemotherapy, the particle filter was capable of very accurately tracking the measured data, by using the model selected with the ABC algorithm used in this work.
Footnotes
Acknowledgments
This work has been financed by FAPERJ, CAPES, and CNPq. The scholarship provided by FAPEAM for J.M.J. Costa is also greatly appreciated.
Author Disclosure Statement
The authors declare there are no relationships with any people or organizations that could inappropriately influence (bias) this work.