Understanding how an amino acid substitution affects a protein's structure can aid in the design of pharmaceutical drugs that aim at countering diseases caused by protein mutants. Unfortunately, performing even a few amino acid substitutions in vitro is both time and cost prohibitive, whereas an exhaustive analysis that involves systematically mutating all amino acids in the physical protein is infeasible. Computational methods have been developed to predict the effects of mutations, but even many of them are computationally intensive or are else dependent on homology or experimental data that may not be available for the protein being studied. In this work, we motivate and present a computation pipeline whose only input is a Protein Data Bank file containing the 3D coordinates of the atoms of a biomolecule. Our high-throughput approach uses our ProMuteHT algorithm to exhaustively generate in silico amino acid substitutions at each residue, and it also includes an energy minimization option. This is in contrast to our previous work, where we analyzed the effects of in silico mutations to Alanine, Serine, and Glycine only. We exploit the speed of a fast rigidity analysis approach to analyze our protein variants, and develop a Mutation Sensitivity (MuSe) Map, to permit identifying residues that are most sensitive to mutations. We present a case study to show the degree to which a MuSe Map and whisker plots are able to locate amino acids whose mutations most affect a protein's structure as inferred from a rigidity analysis approach.
1. Introduction
Amutation in a protein's amino acid sequence can have deleterious effects on a protein's stability and function, which may lead to a serious disease. For example, active site mutations of α-galactosidase (Garman and Garboczi, 2002) are the cause of Fabry disease, a lysosomal disorder that causes a wide range of symptoms including cardiac and kidney complications. To understand better the structural basis of a disease, point mutations can be laboriously performed in vitro, in the physical protein, and their effects assessed via wet lab experiments. The aim of site-specific mutagenesis is to study structural stability and kinetics in response to a mutation, and it can be used to infer a protein's folding mechanism (Ladurner and Fersht, 1997; Wu et al., 1999). To systematically engineer all of the possible mutations in a physical protein and perform experiments on the resulting structures is impractical due to the number of mutations possible. For example, 20398 structures can, in principle, be engineered for the 398 residue α-galactosidase protein using the 20 naturally occurring amino acids.
To complement mutation studies performed on physical proteins, computational methods and analysis techniques are available. Most of them aim at predicting how an amino acid substitution affects a protein's stability. Some existing algorithms fix the atoms in the backbone of a protein and proceed to search for the best side-chain conformation, whereas others utilize rotamer side chain libraries to adjust a structure in response to an amino acid substitution (Ponder and Richards, 1987; Dunbrack and Karplus, 1994). These libraries are built up by using a variety of approaches, which include 3D modeling with energetics calculations, or analyzing homologous sets of proteins to infer the most probable side-chain conformations. In computational experiments by Lee and Levitt (1991), the side-chains in each of the 78 structures of mutant proteins were perturbed. A heuristic energy measure, \documentclass{aastex}\usepackage{amsbsy}\usepackage{amsfonts}\usepackage{amssymb}\usepackage{bm}\usepackage{mathrsfs}\usepackage{pifont}\usepackage{stmaryrd}\usepackage{textcomp}\usepackage{portland, xspace}\usepackage{amsmath, amsxtra}\usepackage{upgreek}\pagestyle{empty}\DeclareMathSizes{10}{9}{7}{6}\begin{document}
$$E_{calc}$$
\end{document}, was used to predict the stability of each protein. In another work, Gilis and Rooman (1997) estimated the folding free energy changes on mutations using database-derived potentials, and correlated them with experimentally measured ones. Similarly, Prevost et al. (1991) used molecular dynamics (MD) simulations to study the effect of mutating barnase, and they predicted that the major contributions to the free energy difference arose from non-bonded interactions.
Approaches that rely on energetic analysis as an indicator of the effects of mutations are often unable to predict how mutations far removed from the active site affect a protein's structure. That is because amino acid substitutions at residues not in the active site induce little or no changes to the structure of a protein, else induce limited energetic perturbations (Piana et al., 2002). Thus, progress has been made in developing software to complement wet lab methods, but many such tools rely on computationally intensive energy calculations, may need a rich data set, built up from a variety of experimental methods, which is not available, or permit hypothesis testing of the effect of a single amino acid substitution at a specific residue only.
Therefore, there is a need for efficient, fast methods for performing high-throughput studies, capable of exhaustive analyses, to help reason about and identify those residues in a biomolecule that affect a protein's stability and, hence, are good targets for pharmaceutical trials. In this work, we present a computation pipeline whose only input is a Protein Data Bank (PDB) (Berman et al., 2000) structure file. We use our rigidity analysis software, which relies on ProMuteHT, to exhaustively generate in silico single-point mutants with all residues mutated to all naturally occurring amino acids. We perform high-throughput rigidity analysis on all of our generated mutant structures, and we develop a Mutation Sensitivity (MuSe) Map to aid in identifying those residues that are most susceptible to amino acid substitutions. To the best of our knowledge, this is the only available approach that generates an exhaustive set of mutants, and analyzes them by using a rigidity analysis approach. Our computation pipeline is not dependent on homology data, experimental stability data, or any information other than what is contained in a PDB file. In our previous work, our software was limited to mutating each residue to only 3 of the 20 naturally occurring amino acids, Alanine, Serine and Glycine. In this work, our recently enhanced mutation capabilities enable us to in silico mutate each residue to all 19 other naturally occurring amino acids, and they permit us to perform a more holistic assessment of the effects of mutating a residue.
2. Related Work
Existing computational approaches and servers provide reasonably accurate predictions about the effects of a mutation. However, most of them permit reasoning about the effect of a single mutation one at a time (Nicholson et al., 1989; Zhou and Zhou, 2002; Capriotti et al., 2005; Mooney, 2005; Cheng et al., 2006; Masso and Vaisman, 2007; Worth et al., 2011). Therefore, those methods are prohibitive for high-throughput studies. Automute, DMutant, I-Mutant 2.0, and MuPro use a variety of approaches, and are dependent on various datasets, including homology information about similar protein structures. However, finding an adequate number of homologues is often infeasible (Mooney, 2005; Moult, 2005). For example, Reva et al. (2011) use an evolutionary conservation impact score approach to separate disease-associated mutants from those with non deleterious polymorphisms (Rhee et al., 2010). Their algorithm works best when at least 10 homologues with a mutation at the same location are available, which is not the case for most residues in most proteins. Thus, some existing approaches are dependent on homology or experimental data that are not easy to attain for a single residue of interest, yet alone for all residues in a polypeptide chain.
Machine-learning methods have also been developed to help predict the effects of mutations and to infer how mutating a residue affects a protein's structure. Cheng et al. (2006) used Support Vector Machines (SVM) to predict with 84% accuracy the sign of the stability change for a protein induced by a single-site mutation. Data of amino acid replacements that are tolerated within families of homologous proteins have been used to devise stability scores for predicting the effect of residue substitutions (Topham et al., 1997). That work has been extended and implemented into an online web server (Worth et al., 2011), but that tool does not allow high-throughput assessment of the effects of mutations of all the residues in a polypeptide. In yet other work (Jagodzinski et al., 2013), an SVM-based machine-learning model that combines rigidity analysis and evolutionary conservation, in addition to amino acid type and solvent-accessible surface area, to a dataset of proteins with experimentally known critical residues, achieved more than 77% accuracy in predicting the sign of the change of stability for a single point mutation to Glycine or Alanine. That approach, too, has not been extended into a pipeline permitting high-throughput analysis to assess the effect of all possible point mutations.
Brender and Zhang (2015) have developed a scoring function that reasons about protein-protein interfaces. They used a Random Forest (RF) approach to achieve a Pearson correlation coefficient of ∼80% between predicted and observed binding free-energy changes on mutations. Jia et al. (2015) have developed several machine learning-based approaches to generate several models based on thermostability data for assessing the effects of single-point mutations. Their accuracy rates, as measured against \documentclass{aastex}\usepackage{amsbsy}\usepackage{amsfonts}\usepackage{amssymb}\usepackage{bm}\usepackage{mathrsfs}\usepackage{pifont}\usepackage{stmaryrd}\usepackage{textcomp}\usepackage{portland, xspace}\usepackage{amsmath, amsxtra}\usepackage{upgreek}\pagestyle{empty}\DeclareMathSizes{10}{9}{7}{6}\begin{document}
$$\Delta \Delta G$$
\end{document} data attained from the literature about mutations done on physical proteins, range from 78% to 85% among several machine-learning approaches [SVM; RF; naive Bayes classifier (NBC); K-nearest neighbor (KNN); artificial neural network (ANN); and partial least squared regression (PLS)], with the RF approach having the highest accuracy. Li and Fang (2012) developed the RF algorithm for predicting thermostability changes due to amino acid substitutions, in which they relied on 41 features, and achieved accuracies of 79.9%, 78.2%, and 78.7% for single-, double-, and multiple-point mutations. Most recently, Harhoodi et al. (2017) have used a variety of machine learning-based methods relying on structural and rigidity features only—not needing energetics calculations—to achieve fast run times for predicting the effects of single mutations with upward of a 70% accuracy.
3. Methods
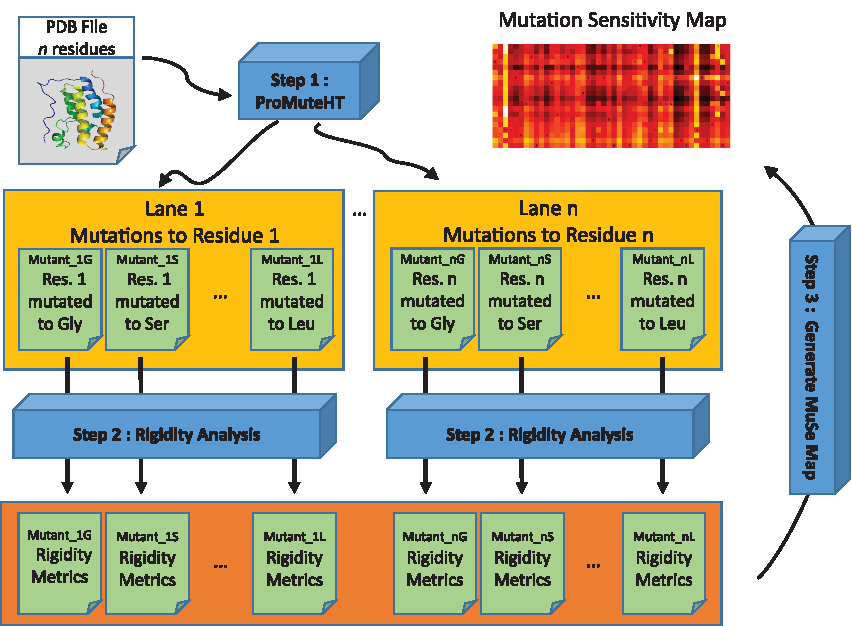
Motivated by a need for a fast method for high-throughput assessment of the effects of mutations on a protein's structure, we have devised a computation pipeline that exhaustively generates in near real time mutant structures with single amino acid substitutions at all residue locations. Our approach is dependent on a series of steps that involve (1) generating mutant structures, (2) performing rigidity analysis of each mutant, and (3) generating a MuSe Map for exploring which residues are most susceptible to amino acid substitutions. In this section, we describe each component of our pipeline, summarized in Figure 1.
Compute pipeline. We use ProMuteHT (Andersson and Jagodzinski, 2017) to exhaustively generate in silico mutations for each residue in a PDB structure file. Each mutant is analyzed by using an efficient rigidity analysis algorithm that provides flexibility information about a protein. The aggregated rigidity data for all mutants is analyzed; the output is a MuSe Map enabling identifying residue locations whose mutations impact most the structure of the protein. MuSe, mutation sensitivity; PDB, Protein Data Bank.
3.1. Generating mutants
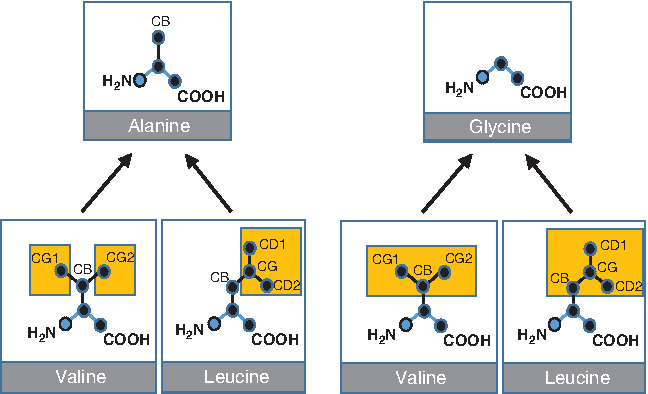
In this work, we rely on ProMuteHT (Andersson and Jagodzinski, 2017) (for Protein Mutator High Throughput), our recently developed algorithm for in silico generating protein variants. It distinguishes between two types of amino acid substitutions, large-to-small (LTS) and small-to-large (STL) mutations. In an LTS in silico mutation (Fig. 2 schematic), atoms from a PDB file are removed to simulate an amino acid substitution. As an example, mutating Valine or Leucine to Alanine involves removing the CG1 and CG2 atoms from Valine, and CG, CD1, and CD2 atoms from Leucine. Mutating Valine or Leucine to Glycine involves removing all of the side chain atoms, including the CB atom. The CB, CG1, etc. are the Cβ, Cγ, etc. atom nomenclature terms in use in PDB files. One of the main advantages of using our ProMuteHT program is that it is fast due to LTS calculations not requiring calculations of energetics terms. This is one reason that we are able to generate many mutant structure files in a short amount of time. In Andersson and Jagodzinski (2017), we report on how generating hundreds of mutant structures can be done in minutes.
ProMuteHT LTS in silico mutations. The amino acid substitution involves retaining only the atoms of the target, smaller, residue. To mutate Valine or Leucine to Alanine, we remove the carbon atoms at the γ and δ positions (yellow boxes). No energy calculations are performed. Reproduced from Andersson and Jagodzinski (2017). LTS, large-to-small.
When an STL mutation is performed, our compute pipeline relies on the freely availably SCWRL 4.0 (Krivov et al., 2009) software that makes predictions about a side chain's orientation. SCWRL uses rotamer libraries (Bower et al., 1997) based on kernel density estimates to predict side-chain confirmations. In the case of a multiple chain polypeptide, our software extracts each chain in the PDB file, and it uses SCWRL to mutate the residue in the chain where the mutation is being performed. ProMuteHT then combines the non-mutated chain(s) and the altered one, and the end product is a multi-chain protein with a single mutation.
On both the mutant and wild type (WT) structures, we perform a brief energy minimization run. This is especially necessary when an STL mutation is involved. That is because SCWRL does not take into account steric clashes that arise due to the introduction of new atoms of a larger residue in the space where the smaller residue's atoms were located. The energy minimization step of the pipeline integrates with the freely available NAMD (Phillips et al., 2005) software library. We perform 300 energy minimization steps, which takes ∼3 to 10 seconds of computation time for a WT and mutant pair, depending on the protein's size.
3.2. Rigidity analysis
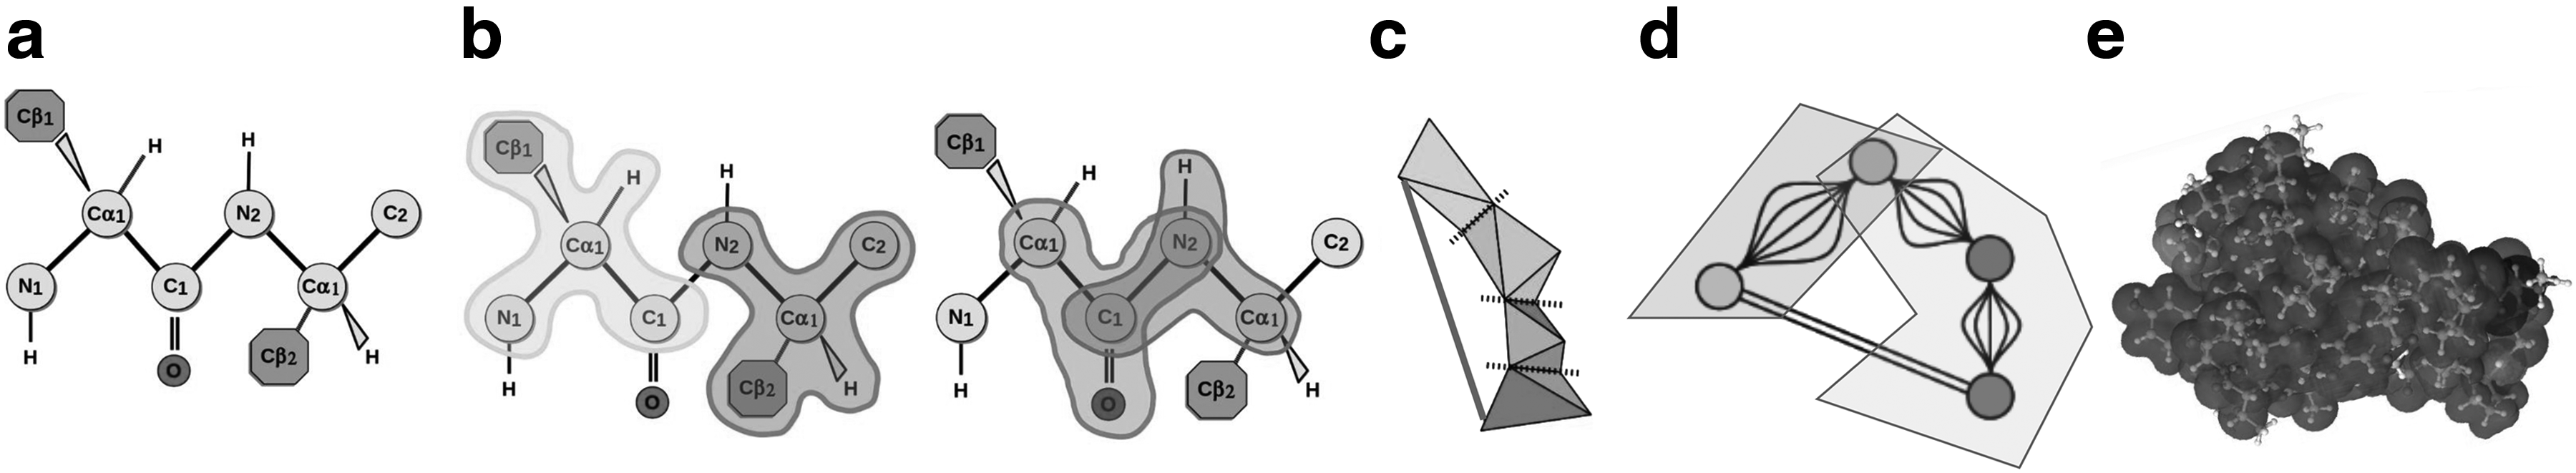
Rigidity Analysis (Jacobs et al., 2001) is an efficient computational technique for identifying the flexible regions of biomolecules (summarized in Fig. 3). Rigidity Analysis, which identifies rigid clusters of atoms, is distinguished from most other methods because it is fast. It does not rely on homologous protein data, machine-learning methods that must be trained, nor costly all-atom energy calculations. The analysis of a 300-amino-acid protein requires less than a minute of compute time on a personal computer. A first generation of rigidity-based mutation analysis tools are available, but the extent of the types of in silico mutations that they can perform and the analysis that they afford are limited, nor can those tools perform high-throughput experiments.
Rigidity analysis. Sets of atoms belonging to rigid clusters are identified. Bonds and other stabilizing interactions are identified in a PDB file (a), location of non-rotatable bonds provides information about rigid components (b), a mechanical model (c) is constructed, and rigidity analysis of the associated graph of the model identifies rigid graph nodes (d), which is used to infer rigid and flexible clusters of atoms in the original PDB structure (e).
The use of rigidity analysis to probe how a single mutation affects a protein's structure was first conceived of in 2010, culminating in a PhD dissertation and publication (Jagodzinski, 2012; Jagodzinski et al., 2012). For that line of work, in silico mutant proteins were computationally generated by KINARI-Mutagen via a process referred to as excision. On input of a PDB structure file, KINARI-Mutagen identified hydrogen bonds and hydrophobic interactions. The stabilizing interactions involving the atoms of the side chain being mutated to Glycine were removed from the protein's model. This was equivalent to computationally mutating a specific residue to Glycine, the smallest amino acid that has no side-chain atoms that form stabilizing interactions.
The effect of a mutation on the protein's structural stability was correlated with its effect on the rigidity of the protein. In KINARI-Mutagen as well as previous work using it (Akbal-Delibas et al., 2013; Jagodzinski et al., 2013), the effect of a mutation was measured by recording the change in the size of the Largest Rigid Cluster (LRC) of the mutant versus the WT (non-mutated protein). The rationale was that the LRC is an indicator of the protein's rigidity or flexibility. Predictions were validated against wet lab \documentclass{aastex}\usepackage{amsbsy}\usepackage{amsfonts}\usepackage{amssymb}\usepackage{bm}\usepackage{mathrsfs}\usepackage{pifont}\usepackage{stmaryrd}\usepackage{textcomp}\usepackage{portland, xspace}\usepackage{amsmath, amsxtra}\usepackage{upgreek}\pagestyle{empty}\DeclareMathSizes{10}{9}{7}{6}\begin{document}
$$\Delta \Delta G$$
\end{document} free energy of unfolding measurements from the ProTherm (Kumar et al., 2005) database. We use the KINARI open-source publicly available rigidity analysis software (Fox et al., 2012) to perform rigidity analysis of the WT and mutant structures generated by ProMuteHT.
3.3. Concurrent execution
To drastically reduce the computation time needed to analyze the rigidity of all the mutant structures generated by ProMuteHT, and to facilitate high-throughput analysis, we leverage the multiple pipeline capabilities available in many modern processors via the use of the Thread library (threads.h) in C++. Our software detects how many cores and pipelines are available, and it performs that many simultaneous rigidity analyses. Our concurrent approach is feasible because the read and write sets of each invocation of the rigidity analyses are disjoint (Andrews, 2000; Reinders, 2007).
3.4. Rigidity distance
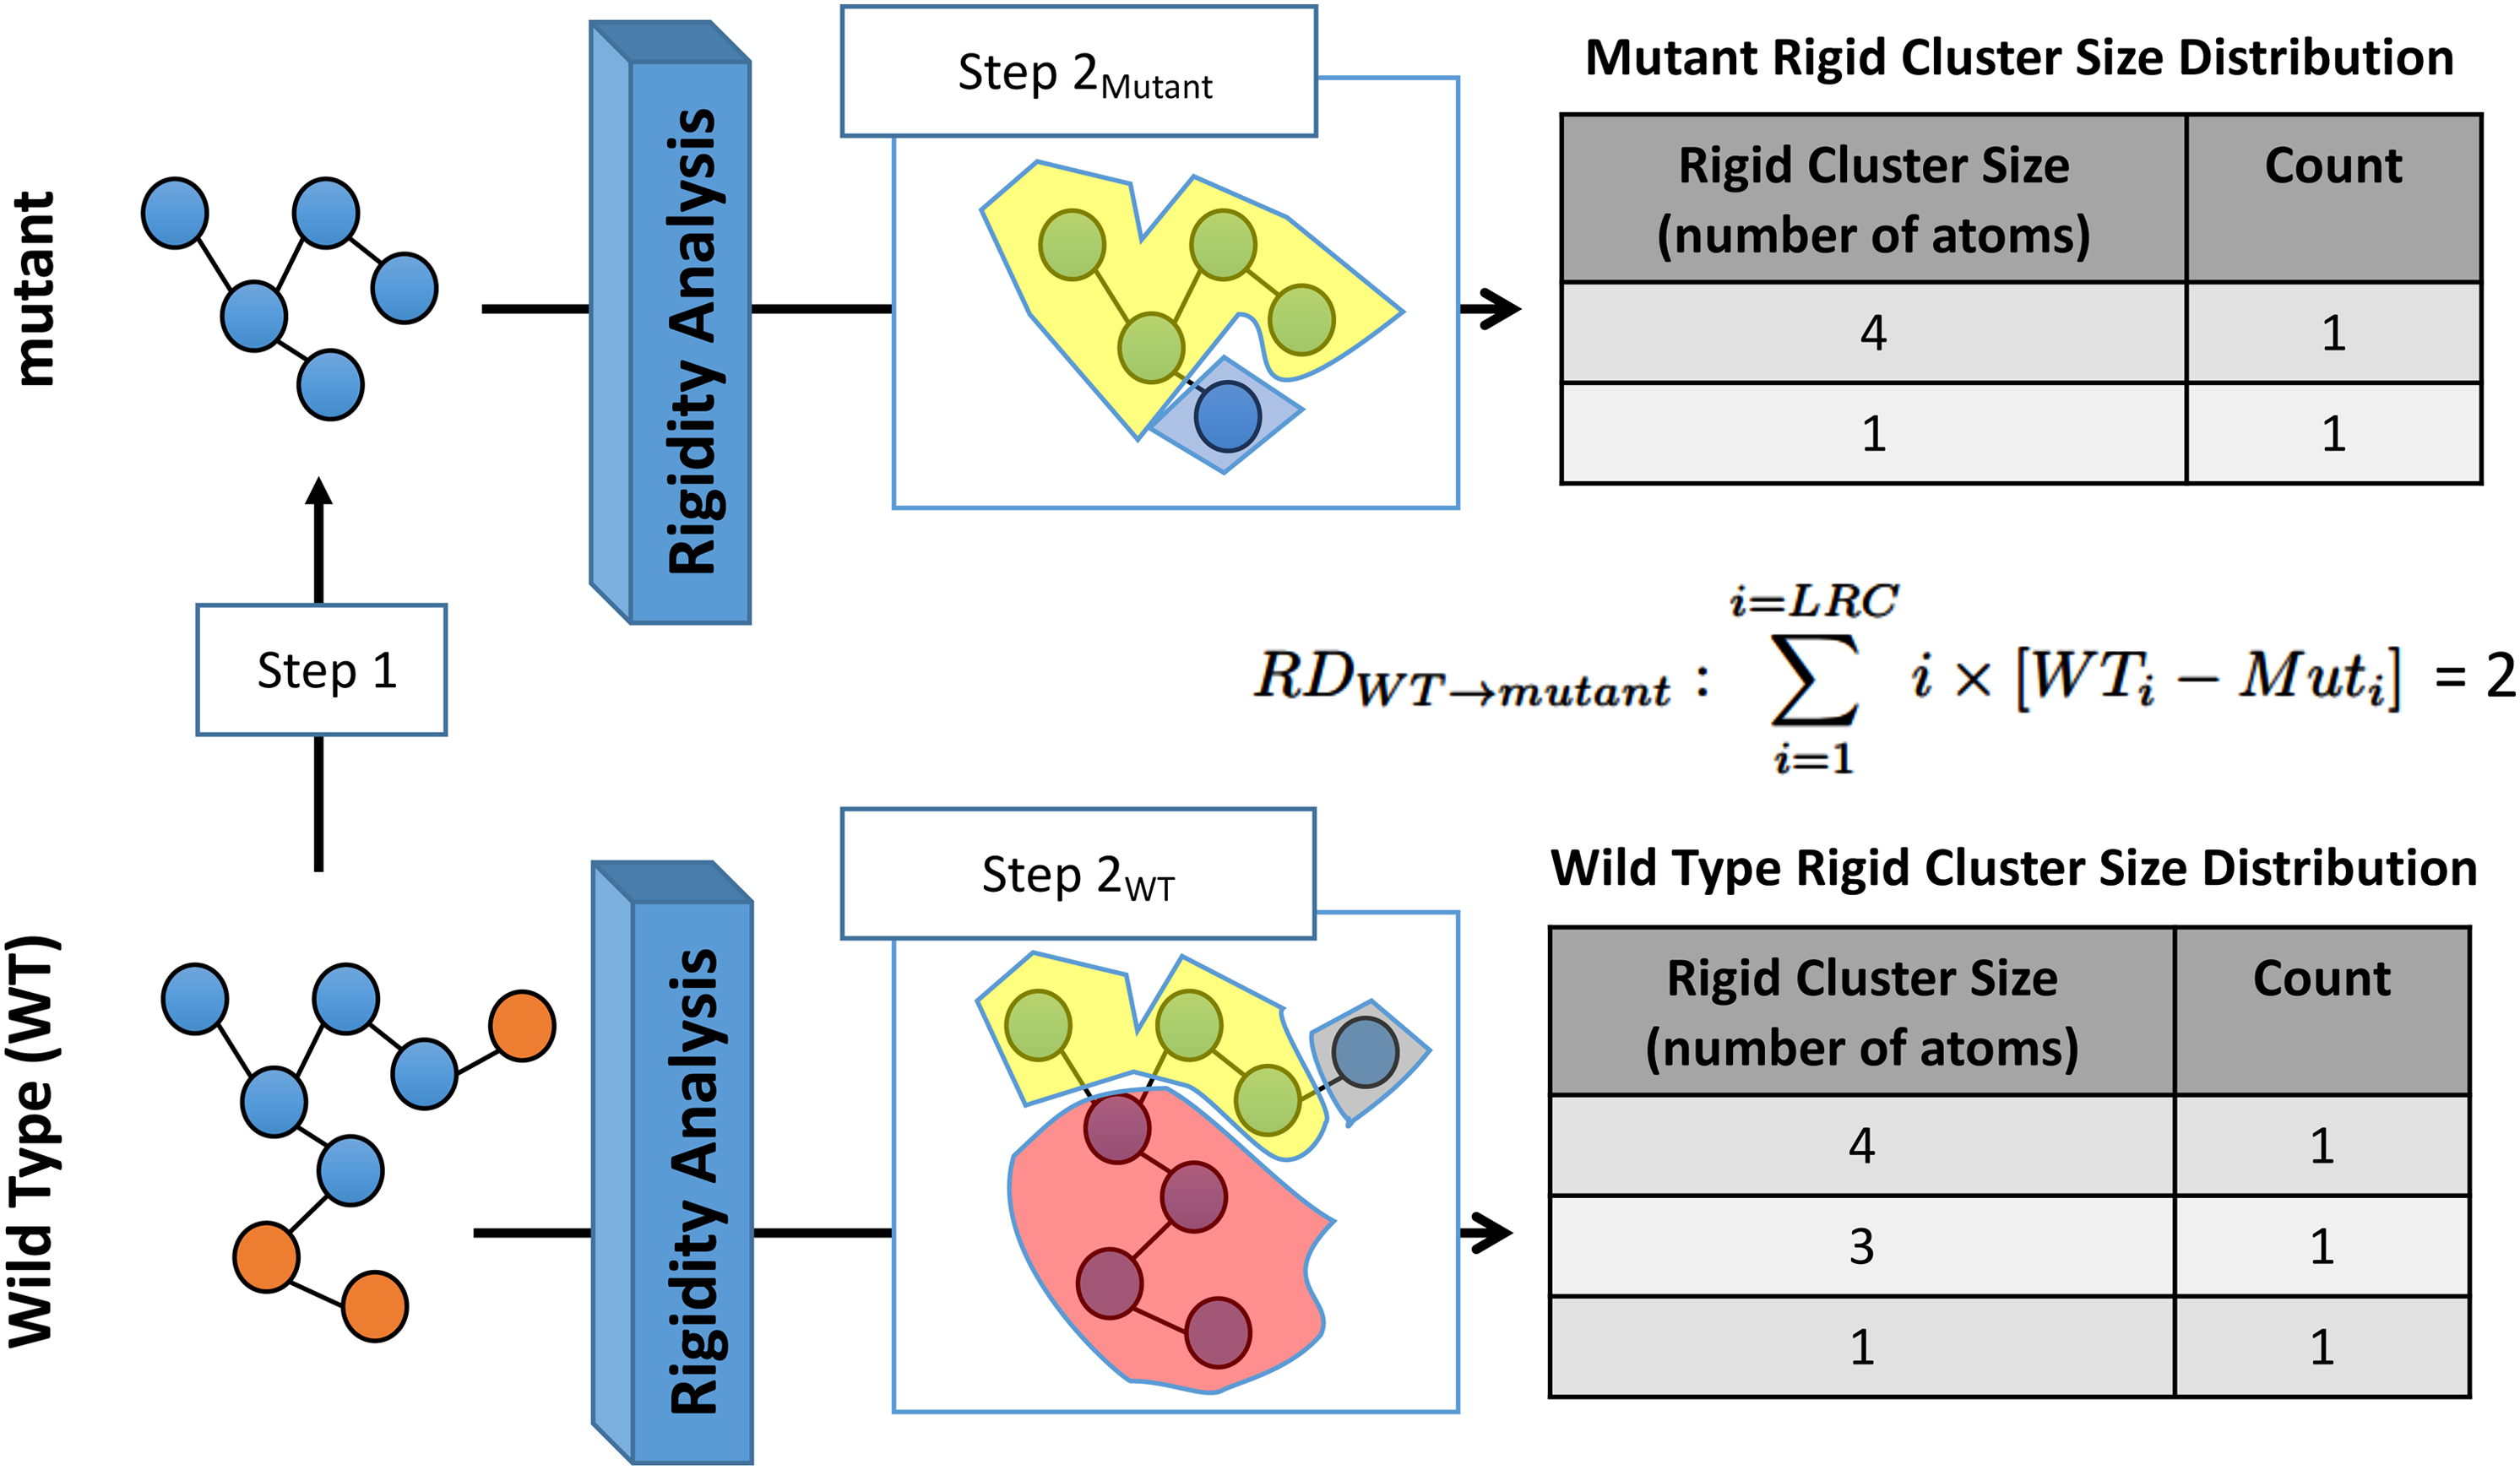
Our approach to determine the effect of a mutation using only structural data is dependent on using the rigidity analysis of a mutant and WT to infer the effect(s) of the amino acid substitution(s) on a protein structure. To achieve this, we compare the rigidity analysis results of the WT, non-mutated form of a protein, with the rigidity analysis results of the mutant. In our recent work (Andersson et al., 2016), we demonstrated that comparing the rigid cluster size distribution of the WT with the rigid cluster size distribution of a mutant provides information about the effects of an in silico mutation. For this work, the following \documentclass{aastex}\usepackage{amsbsy}\usepackage{amsfonts}\usepackage{amssymb}\usepackage{bm}\usepackage{mathrsfs}\usepackage{pifont}\usepackage{stmaryrd}\usepackage{textcomp}\usepackage{portland, xspace}\usepackage{amsmath, amsxtra}\usepackage{upgreek}\pagestyle{empty}\DeclareMathSizes{10}{9}{7}{6}\begin{document}
$$RD_{WT \rightarrow mutant}$$
\end{document} rigidity distance metric was defined to quantitatively assess the impact of mutating a residue to one of the other 19 naturally occurring amino acids:
\documentclass{aastex}\usepackage{amsbsy}\usepackage{amsfonts}\usepackage{amssymb}\usepackage{bm}\usepackage{mathrsfs}\usepackage{pifont}\usepackage{stmaryrd}\usepackage{textcomp}\usepackage{portland, xspace}\usepackage{amsmath, amsxtra}\usepackage{upgreek}\pagestyle{empty}\DeclareMathSizes{10}{9}{7}{6}\begin{document}
\begin{align*}
RD_{WT \rightarrow mutant} : \mathop \sum \limits_{i = 1}^{i = LRC} i \times [ WT_i - Mut_i ]
\end{align*}
\end{document}
WT refers to wild type, Mut refers to mutant, and LRC is the size of the LRC (in atoms). The metric takes into account the different sizes of the rigid clusters and their counts of the WT and the different sizes of the rigid clusters and their counts of the mutant. Each successive summation term of the \documentclass{aastex}\usepackage{amsbsy}\usepackage{amsfonts}\usepackage{amssymb}\usepackage{bm}\usepackage{mathrsfs}\usepackage{pifont}\usepackage{stmaryrd}\usepackage{textcomp}\usepackage{portland, xspace}\usepackage{amsmath, amsxtra}\usepackage{upgreek}\pagestyle{empty}\DeclareMathSizes{10}{9}{7}{6}\begin{document}
$$RD_{WT \rightarrow mutant}$$
\end{document} metric calculates the difference in the count of a specific cluster size, i, of the WT and mutant structures, and it weighs that difference by i. Figure 4 shows a sample calculation of \documentclass{aastex}\usepackage{amsbsy}\usepackage{amsfonts}\usepackage{amssymb}\usepackage{bm}\usepackage{mathrsfs}\usepackage{pifont}\usepackage{stmaryrd}\usepackage{textcomp}\usepackage{portland, xspace}\usepackage{amsmath, amsxtra}\usepackage{upgreek}\pagestyle{empty}\DeclareMathSizes{10}{9}{7}{6}\begin{document}
$$RD_{WT \rightarrow mutant}$$
\end{document} for a WT and hypothetical mutant structure, which differ in their count and sizes of rigid clusters.
Rigidity Distance: Comparing the rigid cluster distributions (sizes and counts) for the WT and mutant structures enables us to assess quantitatively the effect of the amino acid substitution. After performing an in silico point mutation on the WT (Step 1) to generate a mutant (red spheres are the atoms that are removed from the PDB file), rigidity analysis of both structures identifies clusters of atoms that are rigid (Step \documentclass{aastex}\usepackage{amsbsy}\usepackage{amsfonts}\usepackage{amssymb}\usepackage{bm}\usepackage{mathrsfs}\usepackage{pifont}\usepackage{stmaryrd}\usepackage{textcomp}\usepackage{portland, xspace}\usepackage{amsmath, amsxtra}\usepackage{upgreek}\pagestyle{empty}\DeclareMathSizes{10}{9}{7}{6}\begin{document}
$$2^{Mutant}$$
\end{document} and Step \documentclass{aastex}\usepackage{amsbsy}\usepackage{amsfonts}\usepackage{amssymb}\usepackage{bm}\usepackage{mathrsfs}\usepackage{pifont}\usepackage{stmaryrd}\usepackage{textcomp}\usepackage{portland, xspace}\usepackage{amsmath, amsxtra}\usepackage{upgreek}\pagestyle{empty}\DeclareMathSizes{10}{9}{7}{6}\begin{document}
$$2^{WT}$$
\end{document}). The Rigidity Distance \documentclass{aastex}\usepackage{amsbsy}\usepackage{amsfonts}\usepackage{amssymb}\usepackage{bm}\usepackage{mathrsfs}\usepackage{pifont}\usepackage{stmaryrd}\usepackage{textcomp}\usepackage{portland, xspace}\usepackage{amsmath, amsxtra}\usepackage{upgreek}\pagestyle{empty}\DeclareMathSizes{10}{9}{7}{6}\begin{document}
$$RD_{WT \rightarrow mutant}$$
\end{document} metric based on the rigid cluster size distributions provides a quantitative measure of the effect of the mutation. Notice for this example that the LRC of both the WT and mutant are the same, yet each largest cluster contains different atoms. The \documentclass{aastex}\usepackage{amsbsy}\usepackage{amsfonts}\usepackage{amssymb}\usepackage{bm}\usepackage{mathrsfs}\usepackage{pifont}\usepackage{stmaryrd}\usepackage{textcomp}\usepackage{portland, xspace}\usepackage{amsmath, amsxtra}\usepackage{upgreek}\pagestyle{empty}\DeclareMathSizes{10}{9}{7}{6}\begin{document}
$$RD_{WT \rightarrow mutant}$$
\end{document} takes into account this fact, and also relies on atoms not in the LRC. LRC, largest rigid cluster; WT, wild type.
4. Analysis
To enable a user to identify which residues are most susceptible to mutations as inferred by using a rigidity analysis approach, we have developed a heat map that we call a MuSe Map. We also rely on whisker plots to determine quantitatively which residues are most sensitive to mutations. We describe these analysis aspects of our work in this section.
4.1. MuSe Map
The main motivation of this work is to enable high-throughput exhaustive analysis of the effects of point mutations. To help make sense of the \documentclass{aastex}\usepackage{amsbsy}\usepackage{amsfonts}\usepackage{amssymb}\usepackage{bm}\usepackage{mathrsfs}\usepackage{pifont}\usepackage{stmaryrd}\usepackage{textcomp}\usepackage{portland, xspace}\usepackage{amsmath, amsxtra}\usepackage{upgreek}\pagestyle{empty}\DeclareMathSizes{10}{9}{7}{6}\begin{document}
$$RD_{WT \rightarrow mutant}$$
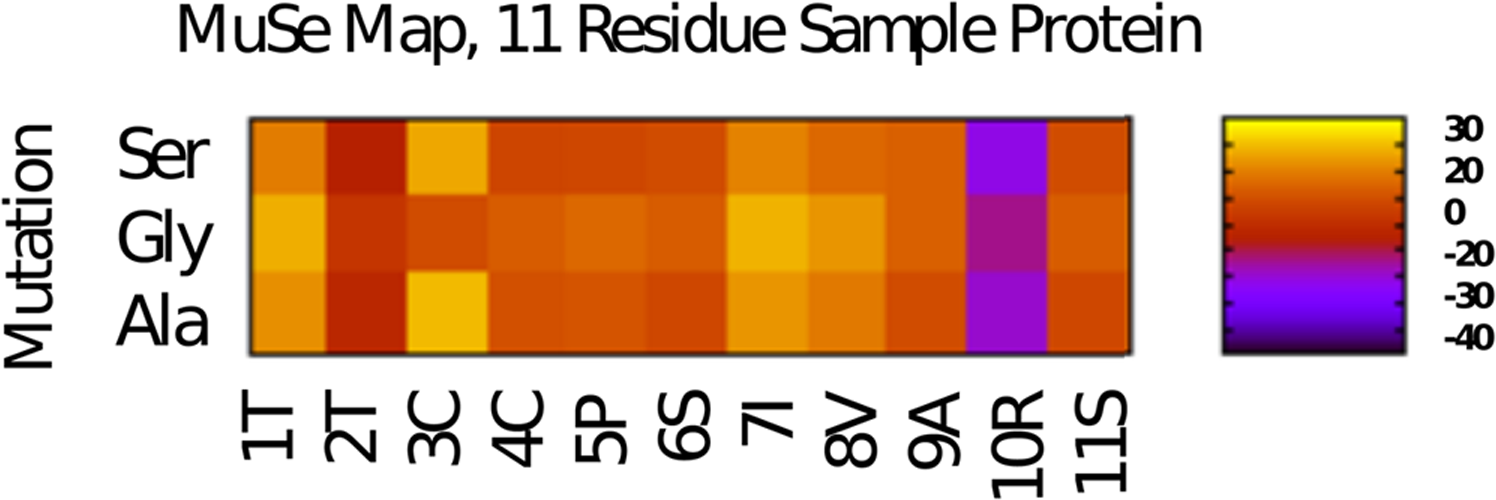
\end{document} scores computed for each WT, mutant pair of structures, we have developed a MuSe Map to help identify those amino acids of a protein that are most susceptible to in silico mutations. A sample MuSe Map is shown in Figure 5, whereas a full-sized MuSe Map, with mutations to all amino acids, is shown in Figure 6.
MuSe Map. Each entry in a MuSe Map contains a color that specifies the \documentclass{aastex}\usepackage{amsbsy}\usepackage{amsfonts}\usepackage{amssymb}\usepackage{bm}\usepackage{mathrsfs}\usepackage{pifont}\usepackage{stmaryrd}\usepackage{textcomp}\usepackage{portland, xspace}\usepackage{amsmath, amsxtra}\usepackage{upgreek}\pagestyle{empty}\DeclareMathSizes{10}{9}{7}{6}\begin{document}
$$RD_{WT \rightarrow mutant}$$
\end{document} score for the \documentclass{aastex}\usepackage{amsbsy}\usepackage{amsfonts}\usepackage{amssymb}\usepackage{bm}\usepackage{mathrsfs}\usepackage{pifont}\usepackage{stmaryrd}\usepackage{textcomp}\usepackage{portland, xspace}\usepackage{amsmath, amsxtra}\usepackage{upgreek}\pagestyle{empty}\DeclareMathSizes{10}{9}{7}{6}\begin{document}
$$i^{th}$$
\end{document} residues for the mutations that were performed in silico. In this figure, only mutations to Serine, Glycine, and Alanine are specified, although the complete MuSe Map contains mutations to all amino acids. The legend on the right correlates a color to a specific \documentclass{aastex}\usepackage{amsbsy}\usepackage{amsfonts}\usepackage{amssymb}\usepackage{bm}\usepackage{mathrsfs}\usepackage{pifont}\usepackage{stmaryrd}\usepackage{textcomp}\usepackage{portland, xspace}\usepackage{amsmath, amsxtra}\usepackage{upgreek}\pagestyle{empty}\DeclareMathSizes{10}{9}{7}{6}\begin{document}
$$RD_{WT \rightarrow mutant}$$
\end{document} score. Colors corresponding to \documentclass{aastex}\usepackage{amsbsy}\usepackage{amsfonts}\usepackage{amssymb}\usepackage{bm}\usepackage{mathrsfs}\usepackage{pifont}\usepackage{stmaryrd}\usepackage{textcomp}\usepackage{portland, xspace}\usepackage{amsmath, amsxtra}\usepackage{upgreek}\pagestyle{empty}\DeclareMathSizes{10}{9}{7}{6}\begin{document}
$$RD_{WT \rightarrow mutant}$$
\end{document} values that deviate greatly from 0 indicate residues that are sensitive to in silico mutations.
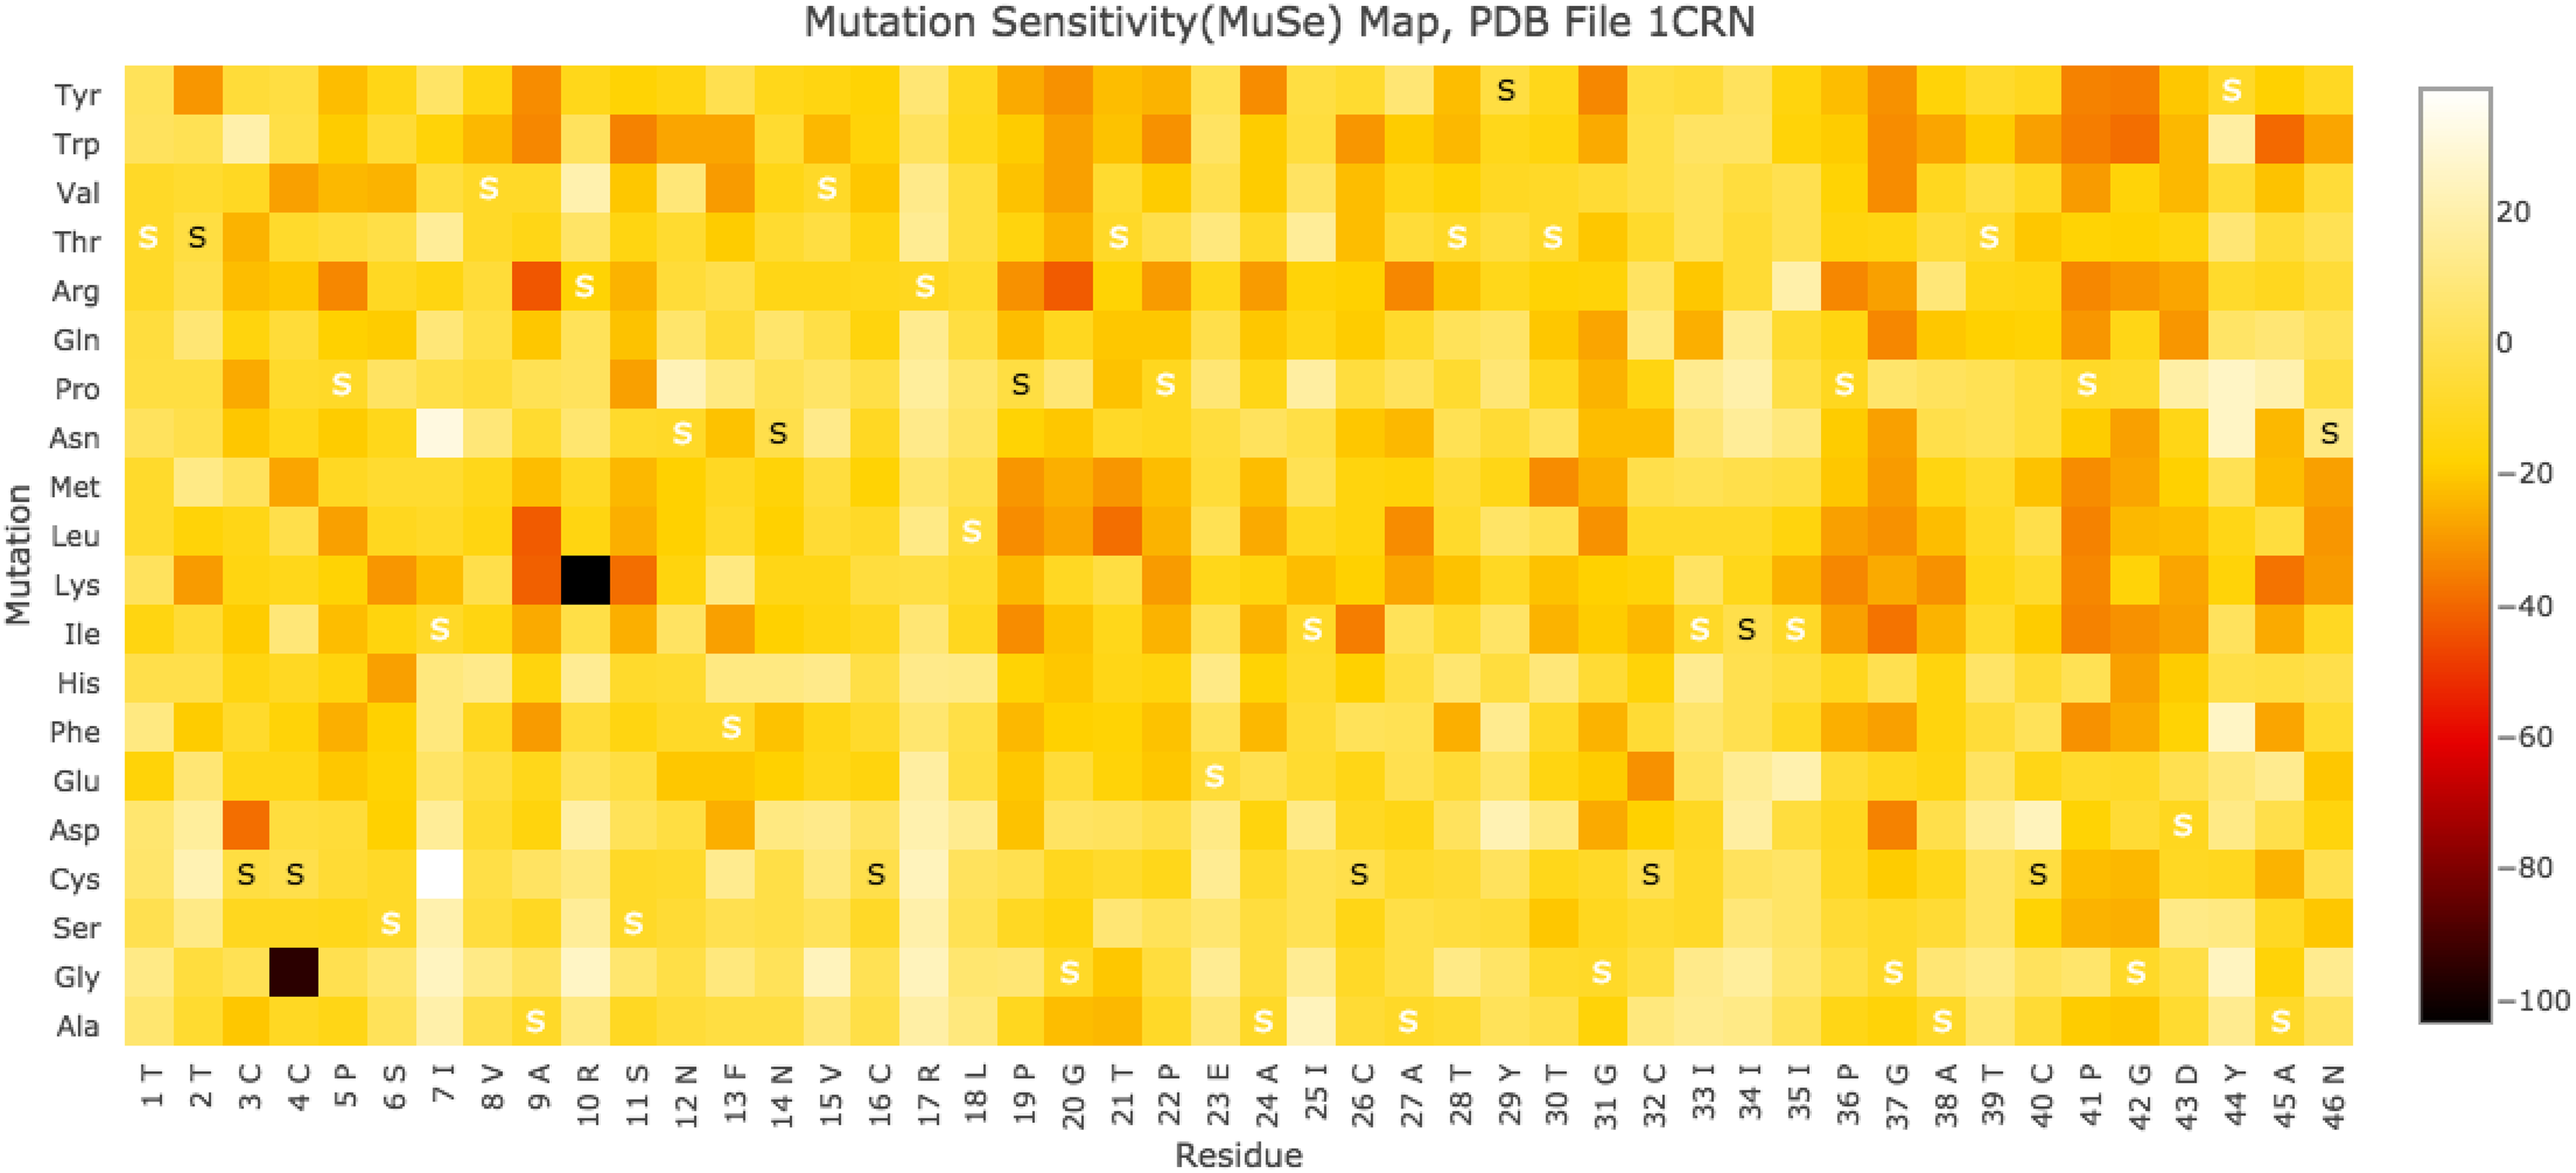
1CRN MuSe Map. The MuSe Map for PDB structure 1CRN, which is made up of 46 residues, graphically shows the \documentclass{aastex}\usepackage{amsbsy}\usepackage{amsfonts}\usepackage{amssymb}\usepackage{bm}\usepackage{mathrsfs}\usepackage{pifont}\usepackage{stmaryrd}\usepackage{textcomp}\usepackage{portland, xspace}\usepackage{amsmath, amsxtra}\usepackage{upgreek}\pagestyle{empty}\DeclareMathSizes{10}{9}{7}{6}\begin{document}
$$RD_{WT \rightarrow mutant}$$
\end{document} scores for each WT residue (x-axis) when mutated to all possible other amino acids (y-axis). An “S” is placed in a square to specify a mutation to the same amino acid as exists in the WT. The legend on the right correlates a color to a specific \documentclass{aastex}\usepackage{amsbsy}\usepackage{amsfonts}\usepackage{amssymb}\usepackage{bm}\usepackage{mathrsfs}\usepackage{pifont}\usepackage{stmaryrd}\usepackage{textcomp}\usepackage{portland, xspace}\usepackage{amsmath, amsxtra}\usepackage{upgreek}\pagestyle{empty}\DeclareMathSizes{10}{9}{7}{6}\begin{document}
$$RD_{WT \rightarrow mutant}$$
\end{document} score. Colors corresponding to \documentclass{aastex}\usepackage{amsbsy}\usepackage{amsfonts}\usepackage{amssymb}\usepackage{bm}\usepackage{mathrsfs}\usepackage{pifont}\usepackage{stmaryrd}\usepackage{textcomp}\usepackage{portland, xspace}\usepackage{amsmath, amsxtra}\usepackage{upgreek}\pagestyle{empty}\DeclareMathSizes{10}{9}{7}{6}\begin{document}
$$RD_{WT \rightarrow mutant}$$
\end{document} values that deviate greatly from 0 indicate residues that are sensitive to in silico mutations.
To generate the MuSe Map for a protein, we tally all \documentclass{aastex}\usepackage{amsbsy}\usepackage{amsfonts}\usepackage{amssymb}\usepackage{bm}\usepackage{mathrsfs}\usepackage{pifont}\usepackage{stmaryrd}\usepackage{textcomp}\usepackage{portland, xspace}\usepackage{amsmath, amsxtra}\usepackage{upgreek}\pagestyle{empty}\DeclareMathSizes{10}{9}{7}{6}\begin{document}
$$RD_{WT \rightarrow mutant}$$
\end{document} scores for the WT, mutant pairs of structures generated by our pipeline. From those data, a heat map is generated where a column represents the \documentclass{aastex}\usepackage{amsbsy}\usepackage{amsfonts}\usepackage{amssymb}\usepackage{bm}\usepackage{mathrsfs}\usepackage{pifont}\usepackage{stmaryrd}\usepackage{textcomp}\usepackage{portland, xspace}\usepackage{amsmath, amsxtra}\usepackage{upgreek}\pagestyle{empty}\DeclareMathSizes{10}{9}{7}{6}\begin{document}
$$i^{th}$$
\end{document} residue in the protein's sequence, and the rows designate all of the naturally occurring amino acid in silico mutations that were performed. Each entry in the MuSe Map is color coded to specify the \documentclass{aastex}\usepackage{amsbsy}\usepackage{amsfonts}\usepackage{amssymb}\usepackage{bm}\usepackage{mathrsfs}\usepackage{pifont}\usepackage{stmaryrd}\usepackage{textcomp}\usepackage{portland, xspace}\usepackage{amsmath, amsxtra}\usepackage{upgreek}\pagestyle{empty}\DeclareMathSizes{10}{9}{7}{6}\begin{document}
$$RD_{WT \rightarrow mutant}$$
\end{document} score for the \documentclass{aastex}\usepackage{amsbsy}\usepackage{amsfonts}\usepackage{amssymb}\usepackage{bm}\usepackage{mathrsfs}\usepackage{pifont}\usepackage{stmaryrd}\usepackage{textcomp}\usepackage{portland, xspace}\usepackage{amsmath, amsxtra}\usepackage{upgreek}\pagestyle{empty}\DeclareMathSizes{10}{9}{7}{6}\begin{document}
$$i^{th}$$
\end{document} residue for each of the 20 mutations. An S is placed in a cell of the MuSe Map to specify that the mutated and WT residue are the same. The process of generating a MuSe Map is detailed in Figure 7.
Creating a MuSe Map. ProMuteHT exhaustively generates in-silico point mutations, and rigidity analysis is performed on each structure. A heat map is generated from the calculated \documentclass{aastex}\usepackage{amsbsy}\usepackage{amsfonts}\usepackage{amssymb}\usepackage{bm}\usepackage{mathrsfs}\usepackage{pifont}\usepackage{stmaryrd}\usepackage{textcomp}\usepackage{portland, xspace}\usepackage{amsmath, amsxtra}\usepackage{upgreek}\pagestyle{empty}\DeclareMathSizes{10}{9}{7}{6}\begin{document}
$$RD_{WT \rightarrow mutant}$$
\end{document} scores. For this example, the \documentclass{aastex}\usepackage{amsbsy}\usepackage{amsfonts}\usepackage{amssymb}\usepackage{bm}\usepackage{mathrsfs}\usepackage{pifont}\usepackage{stmaryrd}\usepackage{textcomp}\usepackage{portland, xspace}\usepackage{amsmath, amsxtra}\usepackage{upgreek}\pagestyle{empty}\DeclareMathSizes{10}{9}{7}{6}\begin{document}
$$RD_{WT \rightarrow mutant}$$
\end{document} scores for residue 1 are 3, −9, and 3 when mutated to Serine, Alanine, and Glycine, respectively. The resulting MuSe Map's first column's three rows are color coded to represent those scores. The MuSe Map depicted here is an abbreviated one and shows mutations to Glycine, Alanine, and Serine only.
4.2. Whisker plots
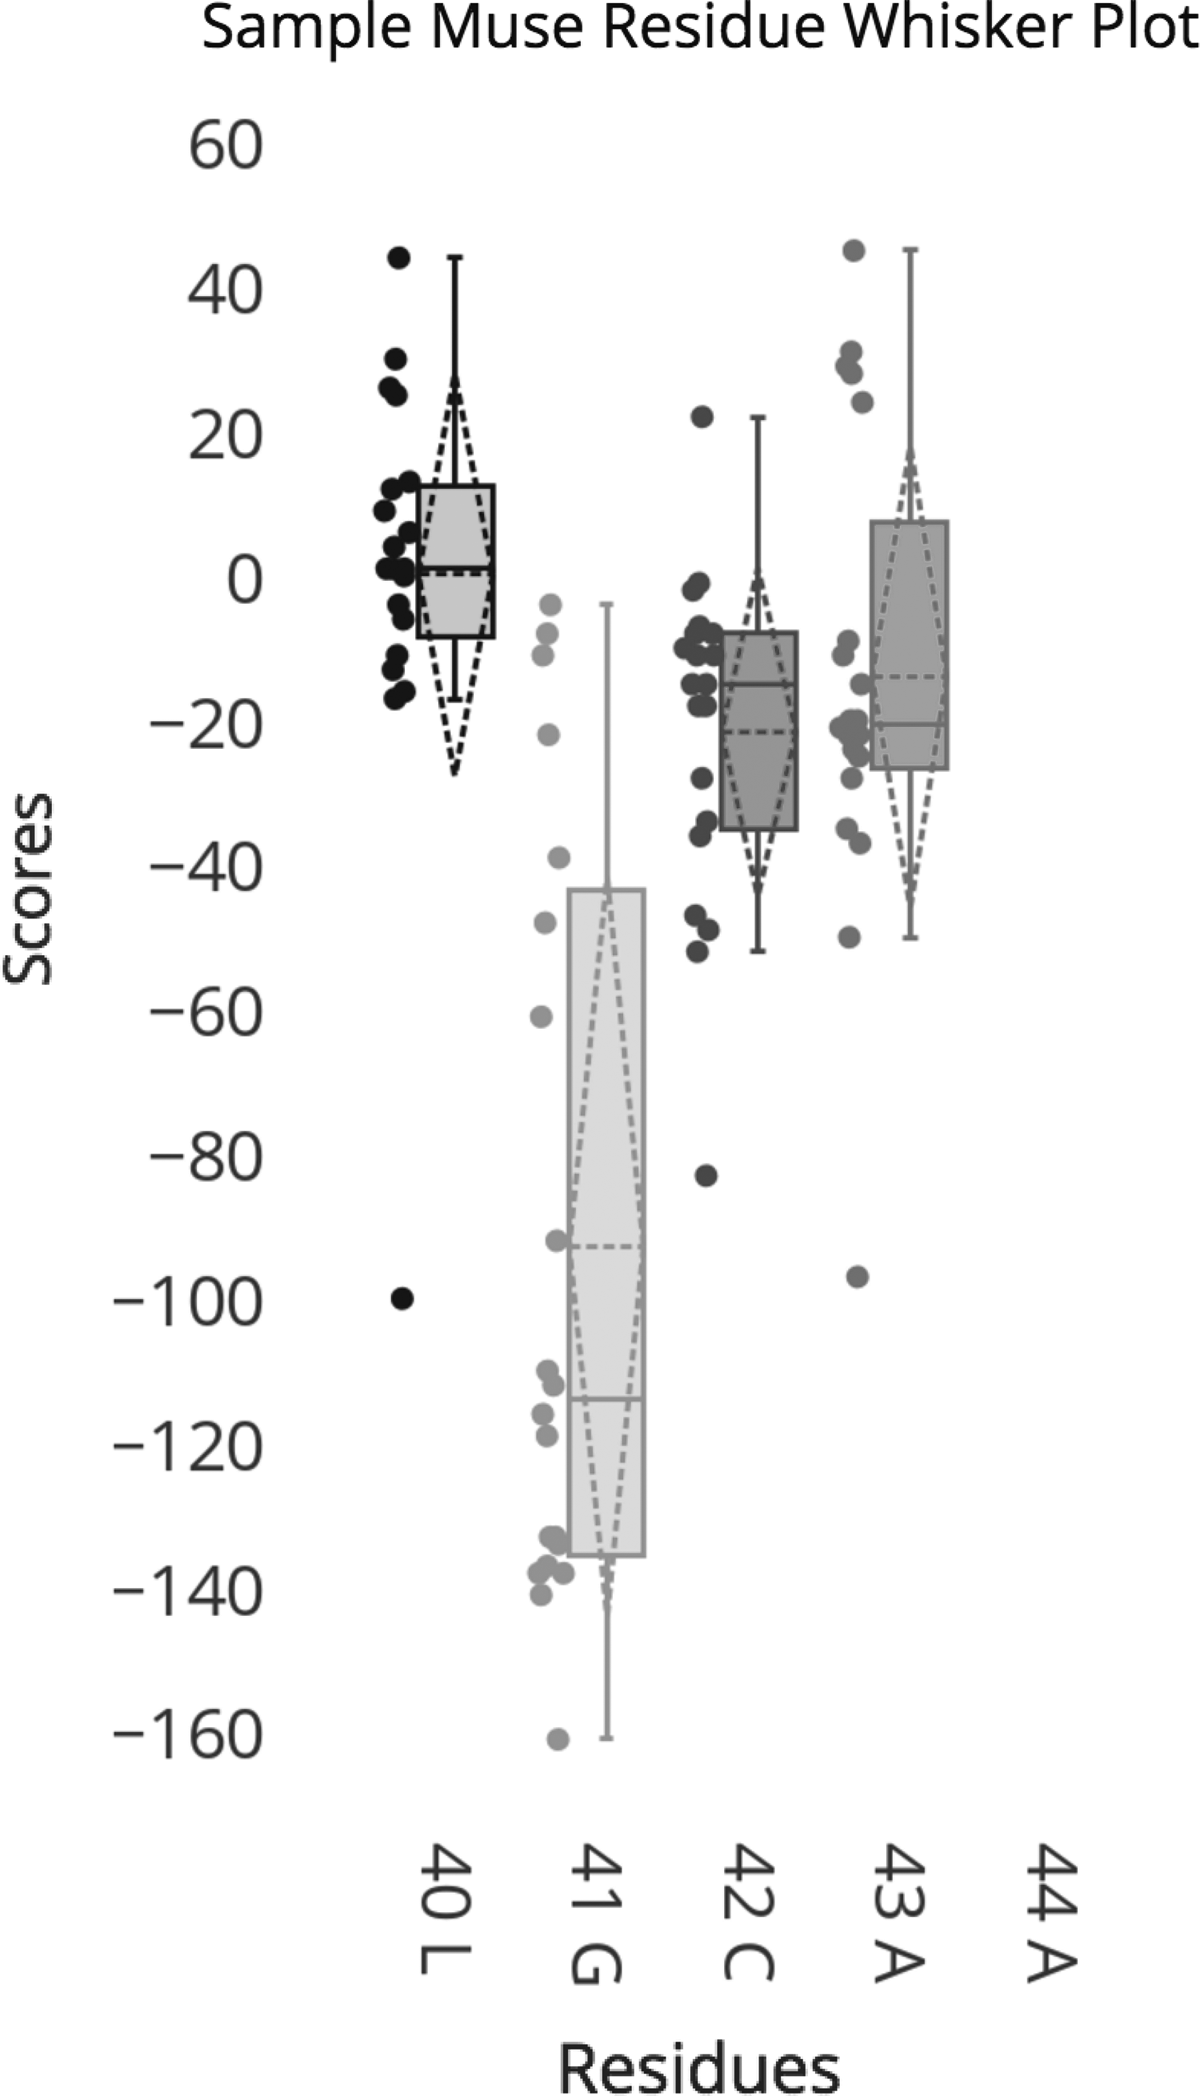
To help identify candidate residues in a protein that are most susceptible to in silico mutations, we rely on whisker plots (also knowns as box plots). Whisker plots graphically depict the quartiles of a data set, and they enable visualizing how similar a set of points is relative to a mean value. Using them is a convenient way to display dispersion (the spread) of the data, and to identify outliers. Figure 8 shows sample whisker plots for five residues. Each dot to the left of each whisker plots designates a single \documentclass{aastex}\usepackage{amsbsy}\usepackage{amsfonts}\usepackage{amssymb}\usepackage{bm}\usepackage{mathrsfs}\usepackage{pifont}\usepackage{stmaryrd}\usepackage{textcomp}\usepackage{portland, xspace}\usepackage{amsmath, amsxtra}\usepackage{upgreek}\pagestyle{empty}\DeclareMathSizes{10}{9}{7}{6}\begin{document}
$$RD_{WT \rightarrow mutant}$$
\end{document} value for a mutation. If the in silico mutations to all possible other amino acids for a residue produce identical or nearly identical \documentclass{aastex}\usepackage{amsbsy}\usepackage{amsfonts}\usepackage{amssymb}\usepackage{bm}\usepackage{mathrsfs}\usepackage{pifont}\usepackage{stmaryrd}\usepackage{textcomp}\usepackage{portland, xspace}\usepackage{amsmath, amsxtra}\usepackage{upgreek}\pagestyle{empty}\DeclareMathSizes{10}{9}{7}{6}\begin{document}
$$RD_{WT \rightarrow mutant}$$
\end{document} scores, then the resulting whisker plot would have a small spread (e.g., mutation 40 L). If the in silico mutations to all possible other amino acids for each residue produce a large range of \documentclass{aastex}\usepackage{amsbsy}\usepackage{amsfonts}\usepackage{amssymb}\usepackage{bm}\usepackage{mathrsfs}\usepackage{pifont}\usepackage{stmaryrd}\usepackage{textcomp}\usepackage{portland, xspace}\usepackage{amsmath, amsxtra}\usepackage{upgreek}\pagestyle{empty}\DeclareMathSizes{10}{9}{7}{6}\begin{document}
$$RD_{WT \rightarrow mutant}$$
\end{document} values, then the whisker plot would have a large spread (e.g., mutation 41G). The extent of the spread of the \documentclass{aastex}\usepackage{amsbsy}\usepackage{amsfonts}\usepackage{amssymb}\usepackage{bm}\usepackage{mathrsfs}\usepackage{pifont}\usepackage{stmaryrd}\usepackage{textcomp}\usepackage{portland, xspace}\usepackage{amsmath, amsxtra}\usepackage{upgreek}\pagestyle{empty}\DeclareMathSizes{10}{9}{7}{6}\begin{document}
$$RD_{WT \rightarrow mutant}$$
\end{document} values for a single residue in a protein is considered an indicator of the variability, or sensitivity, of that amino acid to mutations.
MuSe Map whisker plot. The solid horizontal line represents the median, the dashed horizontal line represents the mean, and the reflexive dashed triangle shows the standard deviation for the data set.
5. Results: A Detailed Analysis
To demonstrate the utility of both the MuSe Map and the use of the whisker plots, we analyzed PDB structure 1HHP, which is the 99-residue monomeric unit (one-half) of the dimer aspartyl protease. HIV-1 protease plays a crucial function in the maturation process of HIV, and it is a major target for drug studies that aim at combating AIDS (Vondrasek, 1998; Blair et al., 2000).
In the MuSe Map for 1HHP (Fig. 9), single-point mutations that strongly destabilize the structure are located by noting the location of black or nearly black squares, indicative of very negative \documentclass{aastex}\usepackage{amsbsy}\usepackage{amsfonts}\usepackage{amssymb}\usepackage{bm}\usepackage{mathrsfs}\usepackage{pifont}\usepackage{stmaryrd}\usepackage{textcomp}\usepackage{portland, xspace}\usepackage{amsmath, amsxtra}\usepackage{upgreek}\pagestyle{empty}\DeclareMathSizes{10}{9}{7}{6}\begin{document}
$$RD_{WT \rightarrow mutant}$$
\end{document} values. Those locations include mutating residue 28 to Aspartic Acid, mutating residue 31 to Valine, mutating residues 56 to Lysine, and mutating residue 87 to Glutamic Acid. Residues 28 and 31 are near the active site, at the dimer interface of the biological unit of the protease, and residue 56, a Valine in the WT, is on the flap.
1HHP MuSe Map. The MuSe Map for HIV-1 protease identifies several residues that have strong destabilizing effects on the structure (residues 21, 25, 34, 35, 57, 81–88, strongly negative \documentclass{aastex}\usepackage{amsbsy}\usepackage{amsfonts}\usepackage{amssymb}\usepackage{bm}\usepackage{mathrsfs}\usepackage{pifont}\usepackage{stmaryrd}\usepackage{textcomp}\usepackage{portland, xspace}\usepackage{amsmath, amsxtra}\usepackage{upgreek}\pagestyle{empty}\DeclareMathSizes{10}{9}{7}{6}\begin{document}
$$RD_{WT \rightarrow mutant}$$
\end{document} values), and those residues that have strong stabilizing effects (residues 55 and 79, strong positive \documentclass{aastex}\usepackage{amsbsy}\usepackage{amsfonts}\usepackage{amssymb}\usepackage{bm}\usepackage{mathrsfs}\usepackage{pifont}\usepackage{stmaryrd}\usepackage{textcomp}\usepackage{portland, xspace}\usepackage{amsmath, amsxtra}\usepackage{upgreek}\pagestyle{empty}\DeclareMathSizes{10}{9}{7}{6}\begin{document}
$$RD_{WT \rightarrow mutant}$$
\end{document} values).
The 1HHP MuSe Map also identifies residues that contain multiple black or nearly black squares, indicating those locations in the polypeptide that are sensitive to mutations in response to more than one amino acid substitution. These are residues 81 and 89. Interestingly, residue 81 has been shown in a variety of studies to play a crucial drug resistance role, and it is a member of the active site cavity (Weber and Agniswamy, 2009).
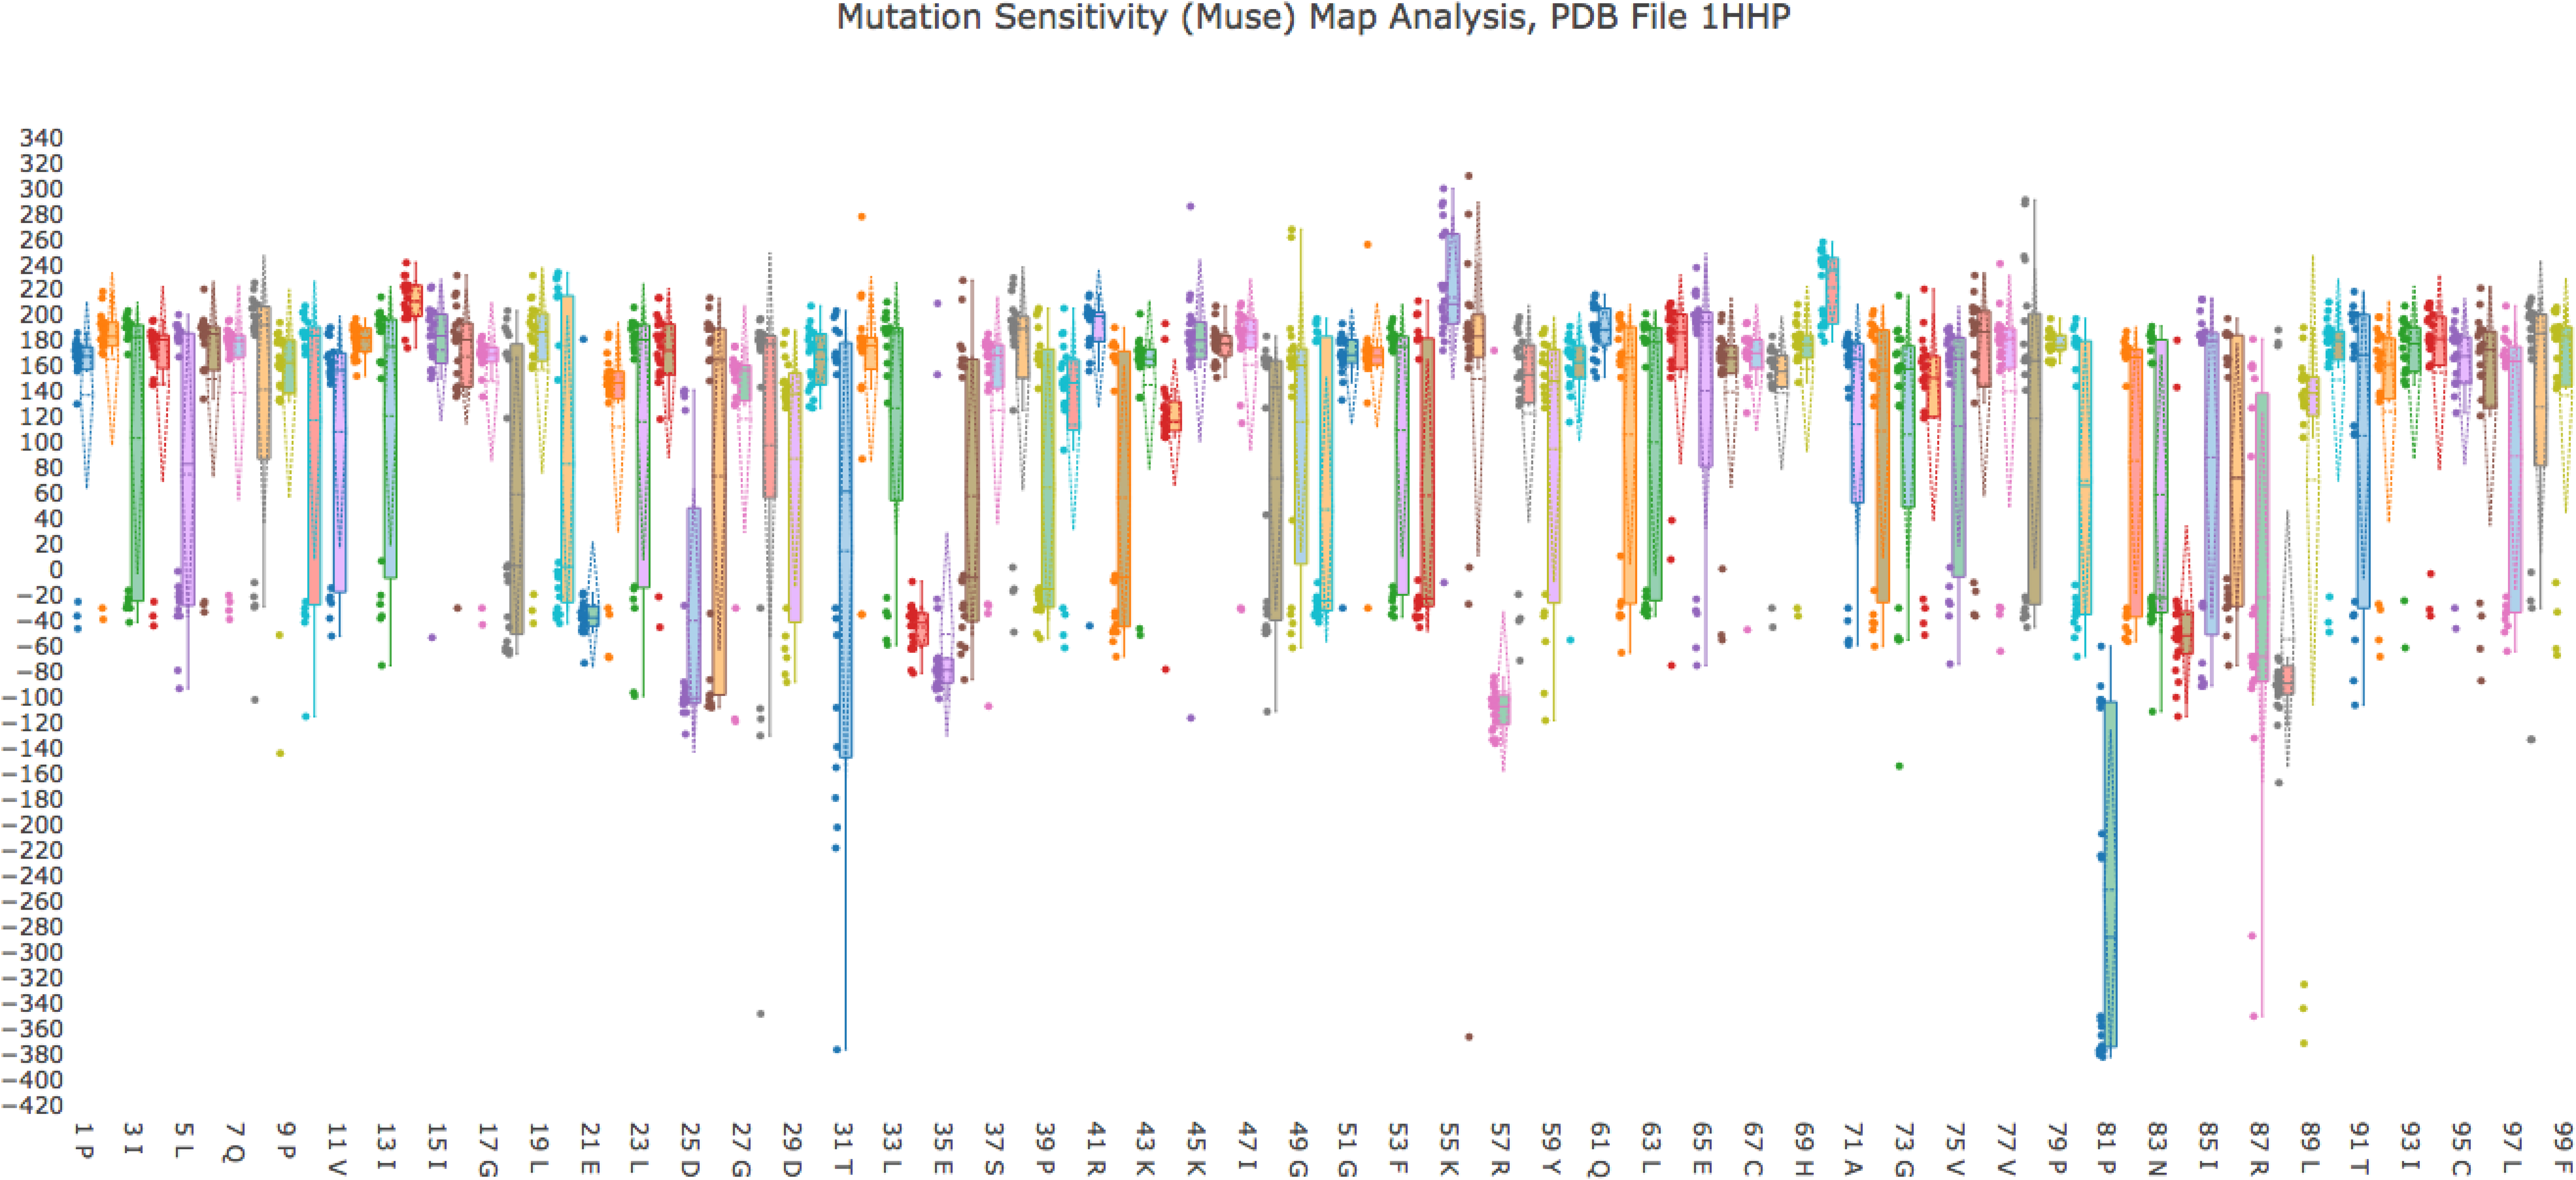
The whisker analysis plot for 1HHP (Fig. 10) is informative too. Table 1 lists the residues from the 1HHP whisker analysis plot that have the greatest spread \documentclass{aastex}\usepackage{amsbsy}\usepackage{amsfonts}\usepackage{amssymb}\usepackage{bm}\usepackage{mathrsfs}\usepackage{pifont}\usepackage{stmaryrd}\usepackage{textcomp}\usepackage{portland, xspace}\usepackage{amsmath, amsxtra}\usepackage{upgreek}\pagestyle{empty}\DeclareMathSizes{10}{9}{7}{6}\begin{document}
$$RD_{WT \rightarrow mutant}$$
\end{document} values. The hot spot column in that table designates whether a residue was identified as either a hot or warm spot as inferred from a study of the atomic-level characterization of the dimer interface (Sousa et al., 2011). Hot spots are those residues that were identified to be most energetically important for dimer formation, whereas warm spots are those residues that were identified to have a binding free energy difference between 2.0 and 4.0 kCal/mol when mutated to Alanine. The right-most column of Table 1 designates whether a residue was found to be among the more important residues that play a role in drug resistance (Yi, 2011).
1HHP whisker analysis. A composite figure of whisker plots for \documentclass{aastex}\usepackage{amsbsy}\usepackage{amsfonts}\usepackage{amssymb}\usepackage{bm}\usepackage{mathrsfs}\usepackage{pifont}\usepackage{stmaryrd}\usepackage{textcomp}\usepackage{portland, xspace}\usepackage{amsmath, amsxtra}\usepackage{upgreek}\pagestyle{empty}\DeclareMathSizes{10}{9}{7}{6}\begin{document}
$$RD_{WT \rightarrow mutant}$$
\end{document} scores for all residues in a protein permits identifying which mutations among which residues are most destabilizing (low \documentclass{aastex}\usepackage{amsbsy}\usepackage{amsfonts}\usepackage{amssymb}\usepackage{bm}\usepackage{mathrsfs}\usepackage{pifont}\usepackage{stmaryrd}\usepackage{textcomp}\usepackage{portland, xspace}\usepackage{amsmath, amsxtra}\usepackage{upgreek}\pagestyle{empty}\DeclareMathSizes{10}{9}{7}{6}\begin{document}
$$RD_{WT \rightarrow mutant}$$
\end{document} scores), and which mutations among which residues have a stabilizing effect (high \documentclass{aastex}\usepackage{amsbsy}\usepackage{amsfonts}\usepackage{amssymb}\usepackage{bm}\usepackage{mathrsfs}\usepackage{pifont}\usepackage{stmaryrd}\usepackage{textcomp}\usepackage{portland, xspace}\usepackage{amsmath, amsxtra}\usepackage{upgreek}\pagestyle{empty}\DeclareMathSizes{10}{9}{7}{6}\begin{document}
$$RD_{WT \rightarrow mutant}$$
\end{document} scores). Each whisker plot also graphically depicts the spread of the data, so in the case of \documentclass{aastex}\usepackage{amsbsy}\usepackage{amsfonts}\usepackage{amssymb}\usepackage{bm}\usepackage{mathrsfs}\usepackage{pifont}\usepackage{stmaryrd}\usepackage{textcomp}\usepackage{portland, xspace}\usepackage{amsmath, amsxtra}\usepackage{upgreek}\pagestyle{empty}\DeclareMathSizes{10}{9}{7}{6}\begin{document}
$$RD_{WT \rightarrow mutant}$$
\end{document} values that vary greatly from the mean (high spread), that information specifies a residue that is sensitive to different degrees to an amino acid substitution depending on which mutation is performed.
Mutation Sensitivity Map Correlations with Other Studies
From the MuSe Map and whisker plots, we selected the 10 residues exhibiting the greatest range in \documentclass{aastex}\usepackage{amsbsy}\usepackage{amsfonts}\usepackage{amssymb}\usepackage{bm}\usepackage{mathrsfs}\usepackage{pifont}\usepackage{stmaryrd}\usepackage{textcomp}\usepackage{portland, xspace}\usepackage{amsmath, amsxtra}\usepackage{upgreek}\pagestyle{empty}\DeclareMathSizes{10}{9}{7}{6}\begin{document}
$$RD_{WT \rightarrow mutant}$$
\end{document} values, indicating those locations in PDB file 1HHP that we identified as having the greatest sensitivity to amino acid substitutions. Of them, only residue 31 was not verified via studies we found in the literature of being either a hot spot or a residue that plays a role in drug resistance. Hot spots are residues identified to be most energetically important for dimer formation (Sousa et al., 2011).
Only residue 31, which did have the greatest \documentclass{aastex}\usepackage{amsbsy}\usepackage{amsfonts}\usepackage{amssymb}\usepackage{bm}\usepackage{mathrsfs}\usepackage{pifont}\usepackage{stmaryrd}\usepackage{textcomp}\usepackage{portland, xspace}\usepackage{amsmath, amsxtra}\usepackage{upgreek}\pagestyle{empty}\DeclareMathSizes{10}{9}{7}{6}\begin{document}
$$RD_{WT \rightarrow mutant}$$
\end{document} spread among all the residues, we did not identify as being either a hot or warm spot, nor was it found to play a drug resistance role in the protease. We consider it encouraging that on analysis of the MuSe Map and whisker plots, it was possible to identify the majority of the residues in 1HHP that have been shown to be either functionally or structurally important.
6. Conclusions
In this work, we have motivated and demonstrated a high-throughput approach for assessing the effects of mutations on a protein's stability by using rigidity data attained from variants generated by our ProMuteHT program. The run times of our approach are fast, with an analysis of a 46-amino-acid protein needing just minutes of compute time, owing to our computation pipeline leveraging concurrency principles. Another reason for the speed of our approach, and indeed what distinguishes it from most others, is that the analysis is structure based only. Aside from the use of a brief energy minimization step to account for steric clashes when generating mutants in silico, energy calculations do not play any role in generating our MuSe Map. However, it should be noted that excluding energy terms might be related to a possible limitation of our approach. Namely, a mutation on a protein structure might induce a destabilizing or stabilizing effect due to reasons that are not structure based, which our method would then not be able to reason about because our features are all purely structural in nature.
Footnotes
Acknowledgments
The authors thank the Computer Science Department and the College of Science and Engineering at Western Washington University for help in student and faculty funds that made this work possible.
Author Disclosure Statement
No competing financial interests exist.
References
1.
Akbal-DelibasB., JagodzinskiF., and HaspelN.2013. A conservation and rigidity based method for detecting critical protein residues. BMC Struct. Biol., 13(Suppl 1), S6.
2.
AnderssonE., HsiehR., SzetoH., et al.2016. Assessing the effects of single and multiple mutations on protein stability using rigid cluster size distributions. Presented at the 6th IEEE International Conference on Computational Advances in Bio and Medical Sciences (ICCABS). Atlanta, Georgia.
3.
AnderssonE., and JagodzinskiF.2017. ProMuteHT: A high throughput compute pipeline for generating protein mutants in silico. Presented at the Proceedings of ACMBCB 2017, Boston.
4.
AndrewsG.2000. Foundations of multithreaded, parallel, and distributed programming. Wesley, University of Arizona at Arizona.
5.
BermanH., WestbrookJ., FengZ., et al.2000. The Protein Data Bank. Nucleic Acids Res. 28, 235–242.
6.
BlairW., LinP.-F., MeanwellN., et al.2000. HIV-1 entry: An expanding portal for drug discovery. Drug Discov. Today. 5, 183–194.
7.
BowerM., CohenF., and DunbrackR.1997. Prediction of protein side-chain rotamers from a backbone-dependent rotamer library: A new homology modeling tool. J. Mol. Biol. 267, 1268–1282.
8.
BrenderJ., and ZhangY.2015. Predicting the effect of mutations on protein-protein binding interactions through structure-based interface profiles. PLoS Comput. Biol. 11, e1004494.
9.
CapriottiE., FariselliP., and CasadioR.2005. I-Mutant2.0: Predicting stability changes upon mutation from the protein sequence or structure. Nucleic Acids Res. 33, W306–W310.
10.
ChengJ., RandallA., and BaldiP.2006. Prediction of protein stability changes for single-site mutations using support vector machines. Proteins. 62, 1125–1132.
11.
DunbrackR.J., and KarplusM.1994. Conformational analysis of the backbone-dependent rotamer preferences of protein sidechains. Nat. Struct. Biol. 1, 334–340.
12.
FoxN., JagodzinskiF., and StreinuI.2012. KINARI-Lib: A C++ library for mechanical modeling and pebble game rigidity analysis, 29–32. In: Minisymposium on Publicly Available Geometric/Topology Software. Eds: KaravelasM., and TeillM.Chapel Hill, North Carolina.
13.
GarmanS., and GarbocziD.2002. Structural basis of Fabry disease. Mol. Genet. Metab. 77, 3–11.
14.
GilisD., and RoomanM.1997. Predicting protein stability changes upon mutation usings database derived potentials: Solvent accessiblity determines the importances of local versus non-local interactions along the sequence. J. Mol. Biol. 272, 276–290.
15.
HarhoodiR., ShelbourneM., HsiehR., et al.2017. Predicting the effect of point mutations on protein structural stability. Proceedings of the 8th ACM Conference on Bioinformatics, Computational Biology, and Health Informatics (ACMBCB), Boston.
16.
JacobsD., RaderA., ThorpeM., et al.2001. Protein flexibility predictions using graph theory. Proteins. 44, 150–165.
17.
JagodzinskiF.2012. Towards large-scale validation of protein flexibility using rigidity analysis [Ph.D. thesis]. University of Massachusetts Amherst, Amherst.
18.
JagodzinskiF., Akbal-DelibasB., and HaspelN.2013. An evolutionary conservation & rigidity analysis machine learning approach for detecting critical protein residues, 780–786. Proceedings of the ACM-BCB (ACM International conference on Bioinformatics and Computational Biology), Washington.
19.
JagodzinskiF., HardyJ., and StreinuI.2012. Using rigidity analysis to probe mutation-induced structural changes in proteins. J. Bioinform. Comput. Biol. 10, 1242010.
20.
JiaL., YarlagaddaR., and ReedC.2015. Structure based thermostability prediction models for protein single point mutations with machine learning tools. PLoS One. 10, e0138022.
21.
KrivovG., ShapovalovM., and DunbrackR.2009. Improved prediction of protein side-chain conformations with scwrl4. Proteins. 77, 778–795.
22.
KumarM., BavaK., GromihaM., et al.2005. Protherm and pronit: Thermodynamic databases for proteins and protein-nucleic acid interactions. Nucleic Acids Res. 34, D204–D206.
23.
LadurnerA., and FershtA.1997. Glutamine, alanine or glycine repeats inserted into the loop of a protein have minimal effects on stability and folding rates1. J. Mol. Biol. 273, 330–337.
24.
LeeC., and LevittM.1991. Accurate prediction of the stability and activity effects of site-directed mutagenesis on a protein core. Nature. 352, 448–451.
25.
LiY., and FangJ.2012. PROTS-RF: A robust model for predicting mutation-induced protein stability changes. PLoS One. 7, e47247.
26.
MassoM., and VaismanI.2007. Accurate prediction of enzyme mutant activity based on multibody statistical potential. Bioinfo. 23, 3155–3161.
27.
MooneyS.2005. Bioinformatics approaches and resources for single nucleotide polymorphism functional analysis. Brief. Bioinform. 6, 44–56.
28.
MoultJ.2005. A decade of CASP: Progress, bottlenecks and prognosis in protein structure prediction. Curr. Opin. Struct. Biol., 15, 285–289.
29.
NicholsonH., SoderlindE., TronrudD., et al.1989. Contributions of left-handed helical residues to the structure and stability of bacteriophage T4 lysozyme. J. Mol. Biol. 210, 181–193.
30.
PhillipsJ., BraunR., WangW., et al.2005. Scalable molecular dynamics with NAMD. J. Comput. Chem. 26, 1781–1802.
31.
PianaS., CarloniP., and RothlisbergerU.2002. Drug resistance in hiv-1 protease: Flexibility-assisted mechanism of compensatory mutations. Protein Sci. 11, 2393–2402.
32.
PonderJ., and RichardsF.1987. Tertiary templates for proteins: Use of packing criteria in the enumeration of allowed sequences for different structural classes. J. Mol. Biol. 193, 775–791.
33.
PrevostM., WodakS., TidorB., et al.1991. Contribution of the hydrophobic effect to protein stability: Analysis based on simulations of the Ile-96-Ala mutation in barnase. Proc. Natl. Acad. Sci. U S A. 88, 10880–10884.
34.
ReindersJ.2007. Intel Threading Building Blocks: Outfitting C++ for Multi-Core Processor Parallelism. O'Reilly Media, Inc., Sebastopol, California.
35.
RevaB., AntipinY., and SanderC.2011. Predicting the functional impact of protein mutations: Application to cancer genomics. Nucl. Acids Res. 39, e118.
36.
RheeS.-Y., TaylorJ., FesselW., et al.2010. HIV-1 protease mutations and protease inhibitor cross-resistance. Antimicrob. Agents Chemother. 59, 4253–4261.
37.
SousaS., TamamesB., FernandesP., et al.2011. Detailed atomistic analysis of the hiv-1 protease interface. J. Phys. Chem. B. 115, 7045–7057.
38.
TophamC., SrinivasanN., and BlundellT.1997. Prediction of the stability of protein mutants based on structural environment-dependent amino acid substitutions and propensity tables. Protein Eng. 10, 7–21.
39.
VondrasekA.W.J.1998. Inhibitors of hiv-1 protease: A major success of structure-assisted drug design 1. Annu. Rev. Biophys. Biomol. Struct. 27, 249–284.
40.
WeberI., and AgniswamyJ.2009. Hiv-1 protease: Structural perspectives on drug resistance. Viruses. 1, 1110–1136.
41.
WorthC., PreissnerR., and BlundellL.2011. SDM-a server for predicting effects of mutations on protein stability and malfunction. Nucleic Acids Res. 39, W215–W222.
42.
WuG., FiserA., ter KuileB., et al.1999. Convergent evolution of trichomonas vaginalis lactate dehydrogenase from malate dehydrogenase. Proc. Natl. Acad. Sc. U S A. 96, 6285–6290.
43.
YiM.2011. Dynamical basis for drug resistance of hiv-1 protease. BMC Struct. Biol. 11, 31.
44.
ZhouH., and ZhouY.2002. Distance-scaled, finite ideal-gas reference state improves structure-derived potentials of mean for structure selection and stability prdiction. Protein Sci. 11, 2714–2726.