
Abstract
Abstract
Since the discovery of right-handed twist of a β-strand, many studies have been conducted to understand the twist. Given the atomic structure of a protein, twist angles have been defined using atomic positions of the backbone. However, limited study is available to characterize twist when the atomic positions are not available, but the central lines of β-strands are. Recent studies in cryoelectron microscopy show that it is possible to predict the central lines of β-strands from a medium-resolution density map. Accurate measurement of twist angles is important in identification of β-strands from such density maps. We propose an effective method to quantify twist angles from a set of splines. In a data set of 55 pairs of β-strands from 11 β-sheets of 11 proteins, the spline measurement shows comparable results as measured using the discrete method that uses atomic positions directly, particularly in capturing twist angle change along a pair, different levels of twist among different pairs, and the average of twist angles. The proposed method provides an alternative method to characterize twist using the central lines of a β-sheet.
1. Introduction
A β-
Secondary structure elements such as helices and β-sheets are the most striking structural features visible in medium-resolution density maps (three-dimensional (3D) images). Various computational methods have been developed to detect helices and β-sheets (Jiang et al., 2001; Kong et al., 2004; Dal Palu et al., 2006; Baker et al., 2007; Zeyun and Bajaj, 2008), including the recent methods SSEhunter, SSELearner, VolTrac, and SSETracer (Baker et al., 2007; Rusu and Wriggers, 2012; Si et al., 2012; Si and He, 2013). A helix detected from 3D image can be represented by its axis, and a β-sheet can be represented as a set of voxels at the β-sheet region. A few methods have been recently developed to generate candidates of central lines of β-strands from simple β-sheet images (Si and He, 2014) and β-barrel images (Si and He, 2017) that are segmented from the density map of an entire protein. An accurate measurement of β-strand twist is important to distinguish the correct set of central lines from candidate sets.
A β-sheet is composed of at least two β-strands that are stabilized by interstrand hydrogen bonds. The direction of each β-strand is the direction of protein sequence. Given the atomic positions of a protein structure, two procedures were previously defined to calculate the twist of β-strands. The former measured the twist of hydrogen bonding direction or peptide planes about the axis parallel to the β-strand (Chothia, 1973; Richardson, 1981). This measurement involves single strand demonstrating a right-handed twist of about 5° per amino acid on average (Chothia et al., 1977). The latter measured the angle formed by two vectors along two neighboring strands, respectively (Quiocho et al., 1977), and showed a left-handed twist about an axis perpendicular to the strand direction. In this article, we propose a method to measure twist using the central lines of β-strands. We compare twist angles measured using atomic positions and central lines, respectively, and show that the proposed method is sensitive enough to capture the nature of twist along a pair of central lines.
2. Methodology
2.1. Measurement of a twist angle from atomic positions of two neighboring β-strands
We measured twist angles directly from atomic positions of the backbone described previously (Ho and Curmi, 2002). Let v1 be a vector formed by two consecutive midpoints on β-strand
2.2. Measurement of twist angles from a pair of central lines of β-strands
When the 3D image of a β-sheet is available, central lines of β-strands can be derived from the image using computational methods such as StrandTwister (Si and He, 2014) and StrandRoller (Si and He, 2017). For the purpose of characterization of twist, a cubic spline generated from the midpoints used in the sparse method in Section 2.1 was used as a central line, instead of splines derived from the image of a β-sheet. Let

Twist angles calculated from atomic positions and central lines of β-strand in protein 1ATZ (PDB ID) sheet A.
2.3. Averaged minimum twist
Both discrete and spline methods measure twist locally for individual β-strands. The level of twist is often different at different locations of the strand and for different β-strands. To characterize the level of twist for different β-sheets, we define in Equation (1) an average minimum twist (AMT),
3. Results and Discussion
Eleven β-sheets, each from a different protein, were used in analysis of twist angles. The atomic structure of each protein was downloaded from Protein Data Bank (PDB). Twist angles were measured both sparsely (using the discrete method) and finely (using splines). The splines (Figs. 1A and 2A) appear to align well with the ribbons that represent the central lines of β-strands in Chimera (Pettersen et al., 2004). Since the distance between two consecutive midpoints is about 3.3 Å, the number of twist angles measured from a pair of splines is three times of twist angles measured sparsely if 1.1 Å vector length is used for splines.

Twist angles calculated from atomic positions and central lines of β-strands in protein 1AOP (PDB ID). See Figure 1 caption for more details in labels and legends.
3.1. Twist angles measured using the discrete method and the spline method
The discrete measurement shows that the smallest twist angle is 10.21° that is the fifth angle of pair
The PDB ID and the pair ID; bthe average and cstandard deviation of twist angles of the pair measured using the spline method with nearest vectors; dthe average and estandard deviation of twist angles measured by the discrete method; fAvg_all: the average of 55 pairs of average twist angles in the column.
N/A, not available when the number of data points is <3; PDB, Protein Data Bank.
The change among twist angles along a pair is shown similarly from both the spline and the discrete measurements. As an example, twist angles of pair (2,3) of 1AOP are monotonically decreasing shown from the discrete measurement (red curve in Fig. 2B). They are also monotonically decreasing in the spline measurement if the nearest vector was used (red curve in Fig. 2C). The twist curve appears as a well for pair (1,2) of 1AOP in both measurements (cyan curves in Fig. 2B, C). Although the overall nature of twist change along a pair can be reflected from both methods, the spline measurement shows smoother transition than the discrete measurement, as expected from more sampling using splines. We observed this property from both 1ATZ, 1AOP, and the rest of the nine β-sheets in the test (data not shown). The comparison of twist angles using the two methods is summarized in Table 1. We observed that the average twist angles among 55 pairs of β-strands are comparable between the two methods (Column 2 vs. Column 4 and Column 7 vs. Column 9 of Table 1). The average twist angles of all 55 pairs are 22.25° for discrete measurement, very close to 22.06° for the spline measurement.
3.2. Measurement using nearest vectors and sequential vectors
Unlike discrete measurement in which vectors are defined by atomic positions of the backbone, twist measurement using splines needs to have well-defined vectors. We investigated two ways to define vectors. The nearest-vector method emphasizes local twist angles more than the sequential method. Although similar twist angles are produced by the two definitions of vectors for most of the angles in the test, different values are observed. For example, the second angle of pair
3.3. Vector length
Twist angles are generally different when measured with different vector lengths. We sampled vector length of 0.7, 1.1, 1.5, 2.5, and 3.2 Å for the data set of 11 proteins. To examine the overall effect of twist for the comparable regions among the 11 β-sheets, we monitored the AMT that is the average of twist angles nearby the minimum twist regions of two longest pairs for a β-sheet. We observe that AMT stays similar when different vector lengths are used for some β-sheets (1ATZ, 1AKY, and 1B3A). However, it is quite different for some other β-sheets (1D5T, 1A12, and 1QNA), and thus further investigation is needed. The nature of twist produced by different pairs is different. We observed that most pairs show increasing or decreasing twist angles along the pair, but some pairs show odd fluctuations. Those β-sheets that show less stable AMT between 0.7 and 1.5 Å vector length tend to have “unusual” pairs, such as 1AOP (Figs. 2 and 3). It appears that AMT is more stable for vector length <1.5 Å for most of the cases. The twist angles shown in Figures 1, 2, and Table 1 were calculated using 1.1 Å that is about one-third of the distance between two consecutive midpoints of the backbone. It is notable that the average twist angles for the spline method are also comparable with those generated by the discrete methods when 1.1 Å was used as the vector length (Table 1).
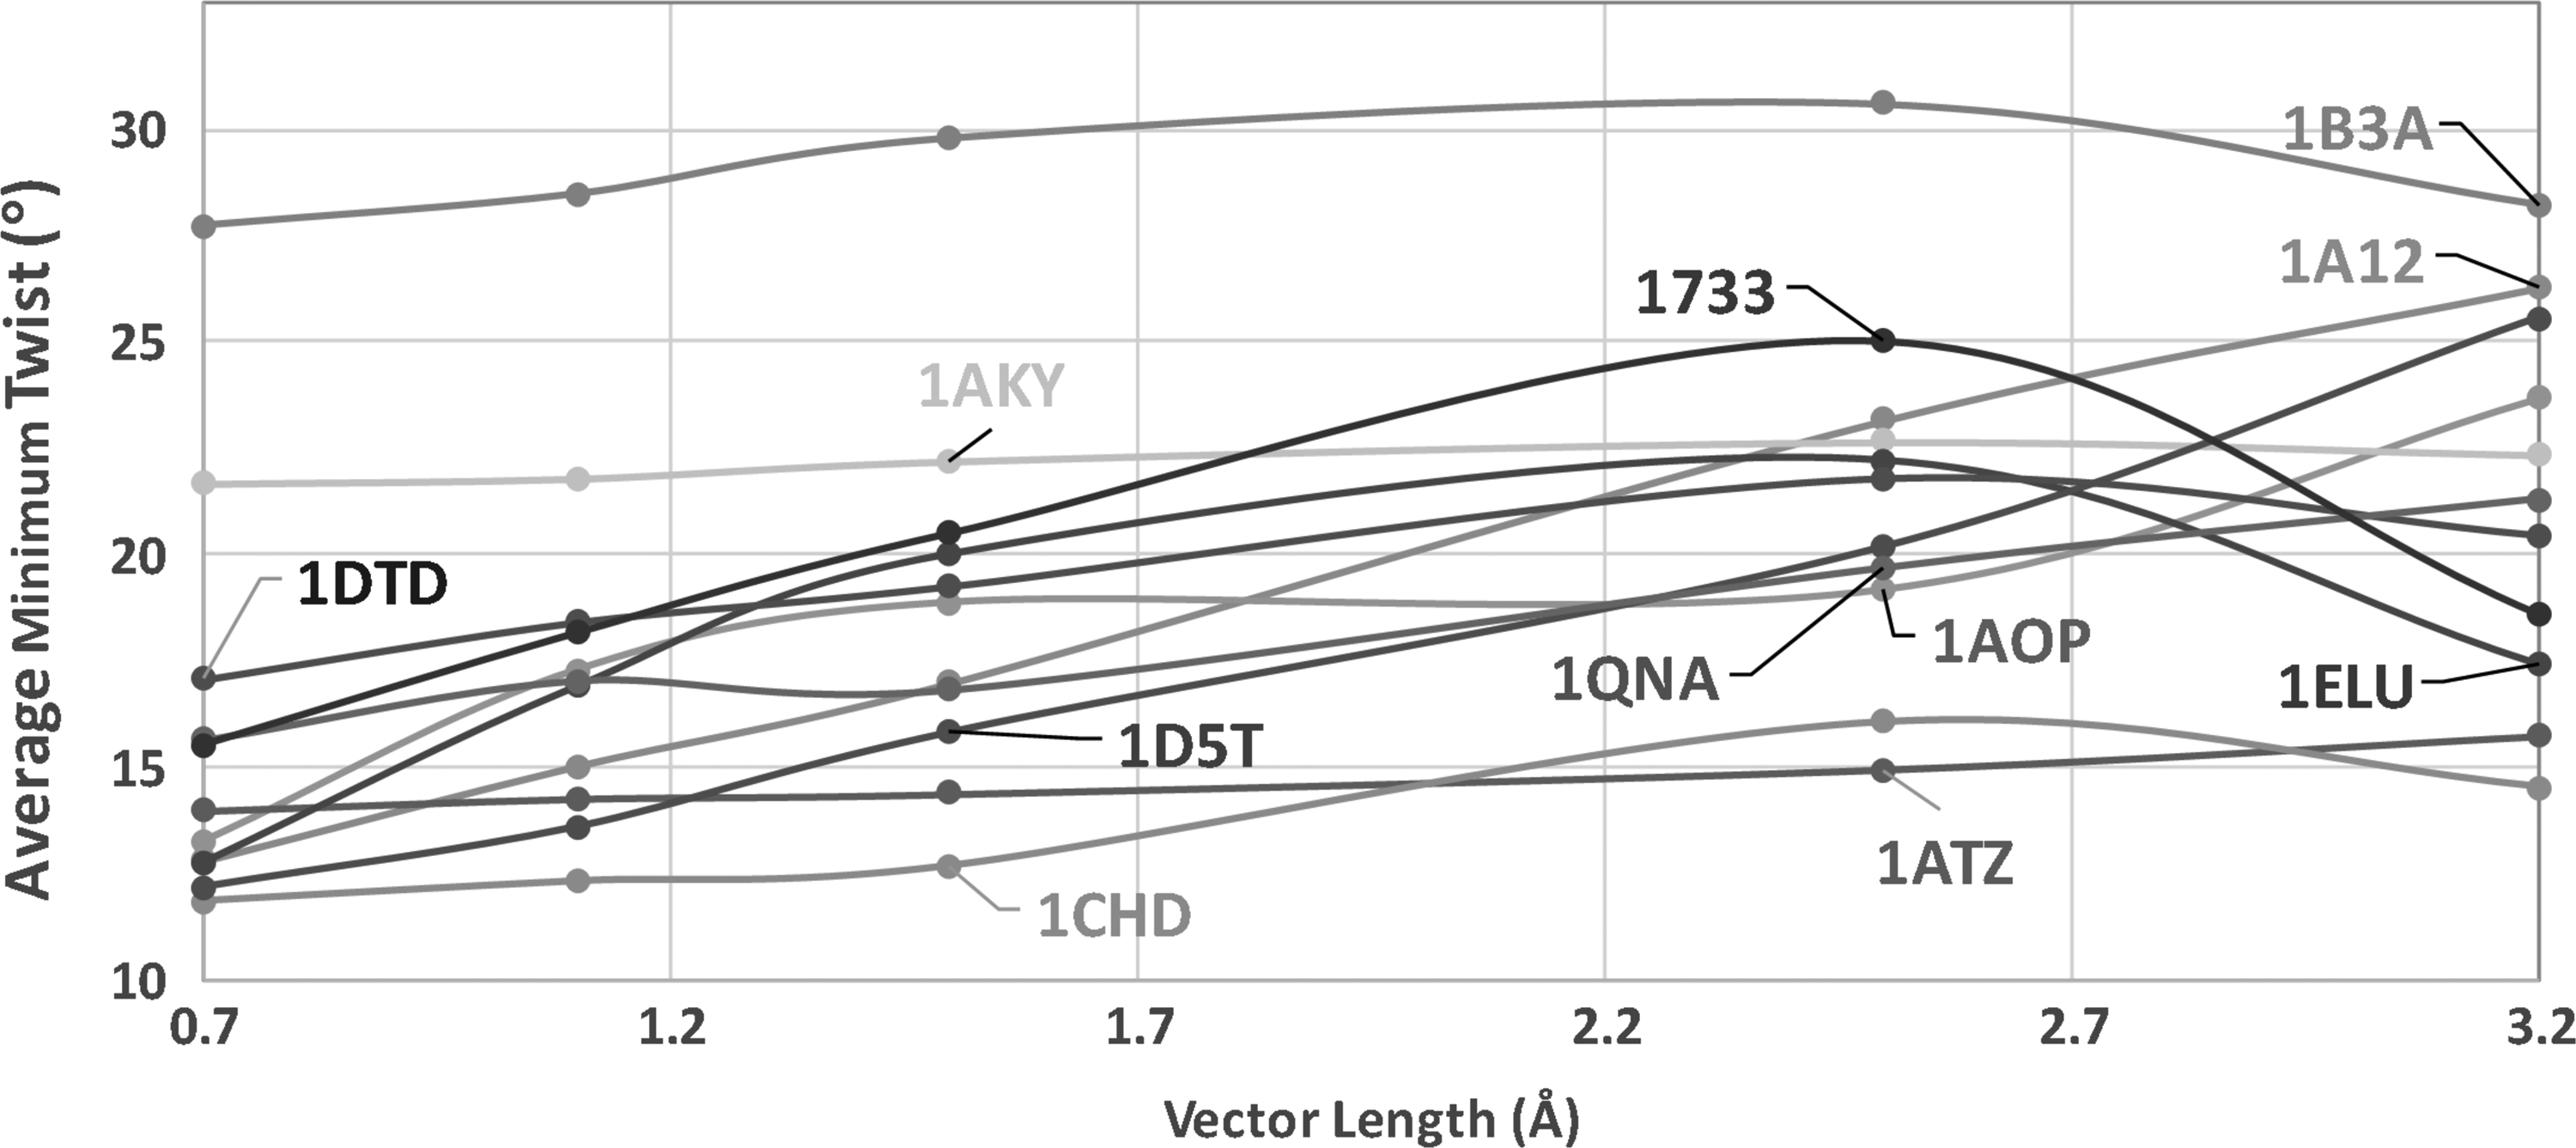
Effect of vector length shown as the averaged minimum twist for 11 β-sheets. Nearest vectors were used in the measurement.
4. Conclusion
Twist of β-strands has been analyzed extensively in the literature. However, most studies are based on the discrete measurement directly using atomic positions of the protein backbones. We propose a new method to measure twist angles using a pair of splines of β-strands. In this method, a pairing segment is first determined and the angles are measured using the nearest-vector method with a 1.1 Å vector length. In a data set of 55 pairs of β-strands from 11 β-sheets of 11 proteins, the spline measurement shows comparable results as measured using the discrete method, particularly in terms of capturing twist angle change along a pair, overall amount of twist among different pairs, and the average of twist angles. The proposed method provides an alternative method to characterize twist angles at different regions of the β-sheet. It can be used to characterize twist when the atomic structure is not available but the central lines of β-strands are available, a situation in analysis of 3D image data at medium resolutions obtained from cryo-EM.
Footnotes
Acknowledgments
The work in this article was supported, in part, by NSF DBI-1356621, NIH R01-GM062968, Modeling and Simulation Scholarship (to T.I.), and Honors College Undergraduate Research Scholarship (to M.P.) of Old Dominion University.
Authors' Contributions
All authors participated in the design of the method. T.I. implemented the method and conducted the test. M.P. assisted the organization of data and results. J.H. wrote the article.
Author Disclosure Statement
No competing financial interests exist.