
Abstract
Abstract
PFstats is a software developed for the extraction of useful information from protein multiple sequence alignments. By analyzing positional conservation and residue coevolution networks, the software allows the identification of structurally and functionally important residue groups and the discovery of probable functional subclasses. Furthermore, it contains tools for the identification of the possible biological significance of these findings. PFstats contains methods for maximizing the significance of alignments through filtering and weighting, residue conservation and coevolution analysis, automatic UniprotKb queries for residue–position annotation and many possible data visualization methods.
1. Introduction
P
Correlated mutations may also be present in MSAs. Residue correlations can be interpreted as a result of the selection for coevolved positions in certain protein regions, which can for example preserve a given interface, functional site, or structural feature (a disulfide bond, for example).
Correlation analysis can, therefore, lead to the detection of contacts (Göbel et al., 1994), protein–protein interactions (Pazos et al., 1997; da Fonseca et al., 2017), clade-specific properties (Lima Afonso et al., 2013), metal binding, or oligomeric states (Bachega et al., 2009), etc., with many methods being used for such calculations (Lockless and Ranganathan, 1999; Dekker et al., 2004; Gloor et al., 2005; Morcos et al., 2011). Reliable prediction of contacts from such methods, initially proposed in the 90s (Göbel et al., 1994), was until the development of newer methodologies (Morcos et al., 2011; Jones et al., 2012) that could overcome the high number of false positives, which originally prevented their successful application to structure prediction. Moreover, the availability of protein sequences has also grown substantially due to the advances in genomics.
We present a software, PFstats, that aims at detecting positions of functional and structural relevance in protein families using both conservation analysis and decomposition of residue coevolution networks (Bleicher et al., 2011). In this method, correlation or anticorrelation signals between residue–position pairs (e.g., H15-D38) are detected and then used to build a “correlation network” representing all coevolution signals in a protein family. Then, this network is decomposed into communities to detect sets of coevolved residues that may serve as determinants of functional subclasses in a protein family. Built-in analysis tools act upon these sets (and also conserved positions) to provide the user with useful information about that protein family and selected reference sequences to be analyzed specifically.
A first case study was conducted with the transcarbamylase family-specific substrate binding domain. Enzymes in the transcarbamylase family catalyze the transfer of a carbamyl group from carbamyl phosphate (CP) to an amino group of a second substrate (Shi et al., 2015). There are two best characterized enzymes, aspartate transcarbamylase (ATCase), which catalyzes the first step in the pyrimidine biosynthetic pathway, the condensation of
As a second case study, we analyzed the C-terminal domain of the citrate synthase (CS) family (Pfam: PF00285). This family includes the orthologous enzymes CS, 2-methylcitrate synthase (2-MCS) and ATP citrate lyase (ACL). CSs are ancient enzymes that catalyze the first reaction in the tricarboxylic acid (TCA) cycle, converting oxaloacetate (OAA) and acetyl-coenzyme A (AcCoA) into citrate and coenzyme A (CoA). 2-MCS is involved in the second step of 2-methylcitrate cycle, a pathway present in some bacteria and fungi that metabolize propionyl-CoA into pyruvate (Brock et al., 2002). This enzyme catalyzes the condensation of propionyl-CoA and OAA to (2S,3S)-2-methylcitrate (2-MC) and CoA (Chittori et al., 2011). ACL is involved in the reductive TCA cycle, it catalyzes the formation of AcCoA and OAA from citrate and CoA with a concomitant hydrolysis of ATP to ADP and phosphate (Elshourbagy et al., 1990).
CSs are found in two structural types. Type 1 CSs (CS-I) are found in archaea, eukaryotes, and Gram-positive bacteria, its structure is formed by a homodimer and they lack regulatory properties (Stokell et al., 2003). Type 2 CSs (CS-II) are found in most Gram-negative bacteria, its structure is formed by three dimers (hexamer) and its activity is strongly inhibited by NADH through an allosteric mechanism (Nguyen et al., 2001; Maurus et al., 2003). Nevertheless, both CS-I and CS-II subunits have the same overall fold and very similar active sites (Stokell et al., 2003). Most of the residues from the CS active site are also conserved in 2-MCS and ACL, suggesting that they follow similar catalytic mechanisms (Gerike et al., 1998; Fatland et al., 2002; Chittori et al., 2011). It has been shown that 2-MCS still presents minor CS activity, but CS does not present any 2-MCS activity (Gerike et al., 1998). The structure of 2-MCS is decameric.
2. Methods
2.1. Software development
PFstats was developed under a client server architecture with most operations on the client side. Local UniprotKb (UniProt: a hub for protein information, 2015) and PDB (Bernstein et al., 1977) copies are stored on the server. A REST web service allows the communication between client and data banks through POST methods, serving as an online API for PFstats. The implemented methods in the web service include the search for sequence annotations, protein structures, and taxonomic data. The client-side program was implemented in C++, applying the QT framework (www.qt.io) for the development of the graphical user interface and the OpenMP library (Dagum and Menon, 1998) for algorithm parallelization. The web service application was developed in Java using the Jersey library (https://jersey.java.net/).
The present project includes several functions to support the studying of protein families, contributing for the discovery of subclass determining residues and functional sites. The methods available in PFstats include sequence filtering and weighting, amino acids conservation and correlation analysis, amino acid alphabet reduction, automated UniprotKB queries, and multiple data visualizations. PFstats uses the following libraries for data visualization: 3Dmol (Rego and Koes, 2015) for structural visualizations, vis.js (http://visjs.org) for network visualization, D3.js (Bostock et al., 2011) for the taxonomic plot visualization, QcustomPlot (Eichhammer, 2014, www.qcustomplot.com) for the representativeness chart, and MSAViewer (Yachdav et al., 2016) for the alignment and conservation view.
Besides the methods described in Bleicher et al. (2011), PFstats also adapts conservation and coevolution metrics for weighted alignments. Weights were assigned to the sequences using the Henikoff & Henikoff algorithm (Henikoff and Henikoff, 1994), as described in the Supplementary Data S1.
To adapt the original correlation score (Bleicher et al., 2011) to weighted alignments, the cumulative binomial distribution parameters k, n, and p (k being the number of “successes,” n the number of “trials,” and p the a priori success probability) were modified so that k is given by N × P(Ax, By), n by N × P(Ax), and p by P(By), N being the number of sequences in the full alignment, P(Ax) the sum of weights of all sequences having residue A at position x, P(By) the sum of weights of all sequences having residue B at position y, and P(Ax, By) the sum of weights of all sequences having both Ax and By.
2.2. Case study 1: ATCase/OTCase
The full alignment from entry PF00185 was obtained from Pfam v31.0. It presented 9815 sequences, 3761 being annotated as OTCases (EC 2.1.3.3), 3750 ATCases, 65 AOTCases, and 33 PTCases. The alignment was filtered by coverage to remove fragments (80% of the HMM size for the protein family) and redundancy (80% maximum identity), and the network was generated with minimum correlation score of 10 (i.e., the frequency shift related to the correlation or anticorrelation is associated with a binomial probability of <10−10), MrsA fraction of 0.2 (i.e., residues must be present in at least 20% of the sequences to have their correlation assessed), and Δf of 0.2 (i.e., in an anticorrelation the frequency of the tested residue must be <20%, or >80% in a positive correlation). Nine communities were found.
2.3. Case study 2: citrate synthase family, C-terminal
This analysis was also performed from the full alignment obtained from Pfam (PF00285), but now instead of using filters, we applied weights (Henikoff and Henikoff, 1994) to maximize the MSA representativeness. The alignment has 8641 sequences, 434 annotated as CS activity (EC 2.3.3.1), 271 as ACL (EC 2.3.3.8), and 26 as 2-MC (EC 2.3.3.5). The parameters used to generate the network were minimum correlation score of 10, MrsA fraction of 0.25, and delta frequency of 0.2. Eight communities were found, five of them being residue pairs. No anticorrelations were found.
3. Results
3.1. PFstats—a software for protein family analysis
PFstats is currently available for Debian-based Linux and Windows machines, and its source code is available for compilation in other operating systems supporting Qt. Graphical interface and terminal versions are available. The project website contains all binaries, user guides, and compilation instructions.
MSAs are the main input, and as such their quality is essential for obtaining relevant results. For this reason, PFstats includes filtering and weighting routines, including methods for removal of fragments, possibly unrelated sequences and redundancy. Alignments can also be filtered by taxon to restrict the analysis to a given clade.
Another implemented approach is the assignment of weights to the sequences to reduce the redundancy and highlight “rare” sequences, eventually coming from subclasses less represented in the alignment. By weighting sequences instead of removing them from the alignment, it is possible to take advantage of as much available information as possible and remediate cases wherein there is a large imbalance in the representation of subclasses.
Since correlation is detected by assessing frequency shifts and their significance in subalignments, minimum subalignment sizes must be determined, which is accomplished using a modified version of the Dima and Thirumalai method (Dima and Thirumalai, 2006), applying sequence entropy as a conservation method.
The assembly and decomposition of correlation networks follow the methodology previously described by our group (Bleicher et al., 2011). These analyses can also be made on reduced amino acid alphabets (Betts and Russell, 2009; Wang and Wang, 1999; Murphy et al., 2000; Pommié et al., 2004).
PFstats can use PDB files as secondary inputs, allowing structural visualization of coevolved sets and residue conservation. From the correlation analysis data, it is possible to view all pairwise correlations, coevolved residues sets, interact with correlation networks, view frequency tables, generate subalignments of sequences containing residues found in the analysis, and exporting the network for visualization on external networking analysis software.
Data can be visualized in an interactive taxonomic sunburst plot, showing the taxonomic predominance of different clades for a subalignment, which may be composed of a given coevolved set. This allows correlating specific subclasses or functions to an existing taxonomic clade.
Finally, PFstats automatically annotates sequence positions by querying UniprotKb for each protein in the alignment and finding positional annotations at conserved and correlated residues.
PFstats works with multiple simultaneous subalignments, and all generated data can be exported in various formats. Analysis sessions can be saved as XML files and be resumed later.
3.2. ATCase/OTCase case study
Community 1 is anticorrelated with every other community, and is composed of the following residues: A277, D232, C274, G238, H322, K325, M237, N167, N168, R247, S236, R320, E318, T231, W234, and Q255 (E. Coli OTCase numbering—P04391). Most of these residues were already described to be involved in the second substrate binding or in motifs that recognize the ornithine binding (Ha et al., 1997; Shi et al., 1998, 2015). As can be seen in Figure 1, the average normalized adherence is very high to OTCases in contrast to be null to ATCases, suggesting that it is a specificity determinant community for OTCase activity. The opposite can be observed in community 2 (G292, L181, P264, M297, Q226, R224, R296, and R172—Enterococcus faecalis ATCase numbering—Q9L4T). The average number of residues in this community is almost maximal for ATCases, whereas null for each other functional subclass. In addition, most of its residues are related in the aspartate binding (Shi et al., 2015).
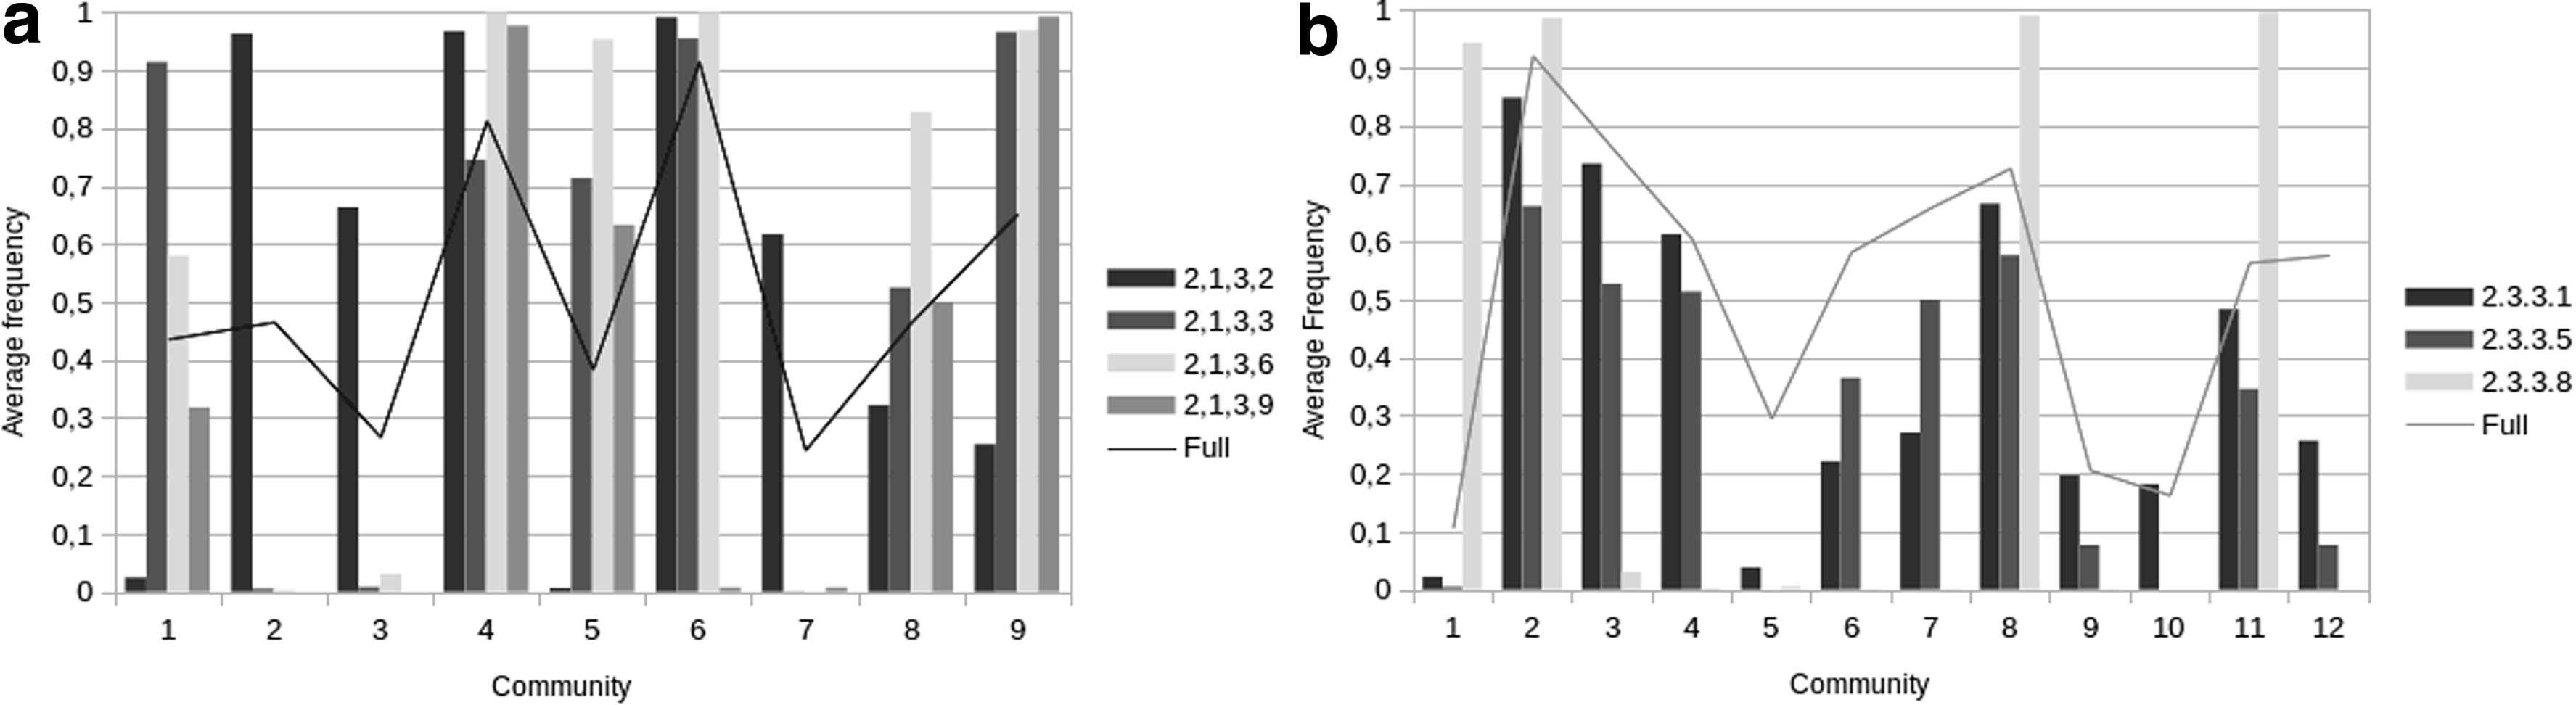
Average frequency of residues from each community in subsets of manual curated sequences: ATCase/OTCase in
Community 3 (G246, H170, I164, L223, N268, and S171—Enterococcus faecalis ATCase numbering—Q9L4T8) and community 7 (G268 and V292 in Mycobacterium tuberculosis ATCase—P9WIT7) are particular cases, as their presence is highly uncorrelated with OTCases sequences, but also has a null adherence with other enzyme types. These communities could not be related with function, but taxonomic specificity, as their subalignments are restricted to bacteria. It is also possible that some sequences in the community 3 subalignment are incorrectly annotated, since it is anticorrelated with OTCases and most of its residues are located in the proline-rich loop. This loop seems to be a signature of knotted transcarbamylases (AOTCase, SOTCase, and YTCase), as its occurrence is very important for knot formation (Shi et al., 2015).
Community 5 (F266 and V278—Enterococcus faecalis PTCase numbering—Q837U7) frequency is almost null for ATCases and almost maximal for PTCases, although still higher than the full alignment for OTCases and AOTCases. As has been previously argued (Naumoff et al., 2004), given the high similarity between these proteins, there are many cases of misannotation involving PTCases and OTCases. An indication of this event is the fact that despite a relative high conservation for OTCases, this community has also a strong anticorrelation with the aspartate binding group (community 1).
3.3. Citrate synthase family case study
Figure 2b shows that ACL enzymes only have significant adherence with communities 1, 2, 8, and 11, probably because it does not present CS activity, while active subfamilies adhere to those communities. Community 1 is the specificity determinant for ACL enzymes and is composed of the following residues: F889, P902, K918, L929, I931, F935, D940, A943, P956, M963, I973, K978, V987, Y1006, T1014, T1015, I1022, L1023, G1027, I1029, G1071, and D1075 (Human ACL numbering—P53396). In CS and 2-MCS, the F935 is usually replaced by a catalytic histidine.
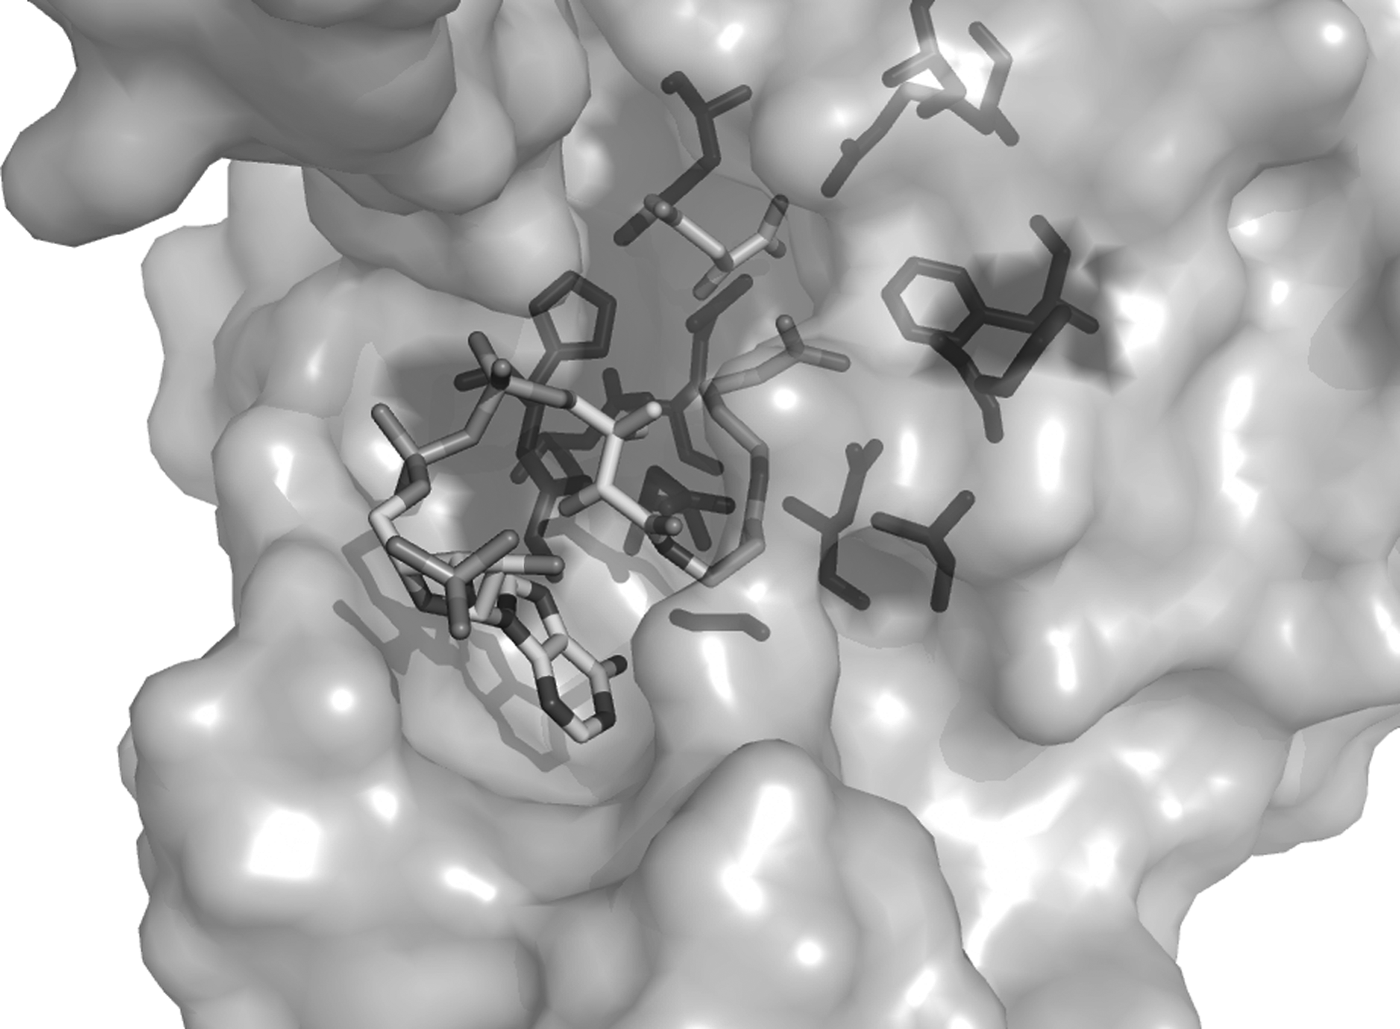
Structure of chicken CS bound to oxaloacetate and carboxymethyl coenzyme A (PDB: 5CTS). Residues from community 2 are shown in dark grey and are located around the catalytic cleft, interacting with the ligand.
Community 2 (H230, S235, G262, G266, A268, G303, G305, H306, D313, R315, N361, D363, F384, R388, and G391—Escherichia coli CS numbering—P0ABH7) grouped the high-conserved residues, found among all subclasses. All these residues are located in the active site, interacting with its substrates, as can be seen in the chicken CS structure (PDB: 5CTS) as bound to OAA and carboxymethyl CoA (Fig. 2). It is, therefore, likely that this community groups the residues that are collectively needed to maintain the overall activity of both enzyme types.
Other interesting communities are 5 (T85, D389, Y391, F392, and W435—Slime Mold peroxisomal CS numbering—Q8MQU6) and 10 (W195 and D201—Human CS numbering—Q75390). Community 5 has an almost null adherence with annotated CS, 2-MCS, and ACL proteins. In addition, most of the sequences having these five residues are unreviewed, but predicted to have CS activity, suggesting that it is related to a specific CS subclass. Community 10 is a clade determinant for eukaryote CSs.
4. Discussion
By detecting conservation and correlation patterns in protein families, mapping such information in different sequences and structures, and also detecting known position annotations in Uniprot, PFstats can be used by protein scientists for a variety of useful tasks. Characterization of novel proteins, for example, can be accomplished by incorporating information from homologues, if there exit already characterized proteins, or by pinpointing what are the most probable sites of functional or structural relevance in a protein family. Such an approach can be used, for example, to efficiently design site-directed mutagenesis experiments (Busso et al., 2015; Rios-Anjos et al., 2017). It can also significantly simplify the task of reviewing structural–functional aspects of entire protein families (da Fonseca et al., 2017), and, in some cases, reveal previously unnoticed patterns in well-studied protein families (Lima Afonso et al., 2013).
In the case studies shown here, PFstats could readily identify relevant positions in two protein families, ATCase/OTCase and the citrate synthase family. Usually, it should be expected that conserved residues pinpoint positions that are generally required for structure and function throughout a protein family, whereas sets of coevolved positions may reveal the positions that determine class-specific characteristics. The existence of highly correlated residue sets in protein families that only appear in previously uncharacterized proteins, therefore, suggests that a protein family may include members with novel characteristics.
The software is free and open source, being distributed in the terms of the GPLV3 license, and is available in both GUI and terminal versions (see first Reference).
Footnotes
Acknowledgments
This work has been financially supported by FAPEMIG, CAPES (grant 051-2013), and CNPq (grant 457851/2014-7). We are also extremely grateful to José Ribamar Ferreira-Jr. and Janaína Paulela at the University of São Paulo and Dhiego Andrade at UFMG for testing most of the routines implemented in this software.
Author Disclosure Statement
No competing financial interests exist.
References
Supplementary Material
Please find the following supplemental material available below.
For Open Access articles published under a Creative Commons License, all supplemental material carries the same license as the article it is associated with.
For non-Open Access articles published, all supplemental material carries a non-exclusive license, and permission requests for re-use of supplemental material or any part of supplemental material shall be sent directly to the copyright owner as specified in the copyright notice associated with the article.