
Abstract
Abstract
1. Introduction
R
Although several software have been developed to detect RNA editing events based on RNA-seq data, such as REDItools (Picardi and Pesole, 2013), RED (Sun et al., 2016), VIRGO (Distefano et al., 2013), rddChecker (http://ccb.jhu.edu/software/rddChecker/), RCARE (Lee et al., 2015), and GIREMI (Zhang and Xiao, 2015), there is still a great challenge to distinguish true RNA editing events from genome variation, sequencing errors, and other factors (Bass et al., 2012). Moreover, all of these tools are developed based on human transcriptome data and most of them have usage limitation. RED is complicated in installation and has relatively low sensitivity compared with REDItools. VIRGO is a web-based tool that only maps A->G mismatches between genomic and expression sequence. rddChecker only supports hg19 and mm9 genomes and needs both RNA-seq and DNA-sequencing data. RCARE is not able to identify novel RNA-editing sites. GIREMI is used to identify human A->I RNA editing sites. REDItools is the only effective software that can be used to identify RNA editing sites in organelles, but it lacks the detailed annotation for RNA editing sites and the comparative analysis of RNA editing sites among multiple samples. Compared with nuclear genome, the difference of mutant type, repair system, and copy number in organelle genome will affect the identification of true RNA editing events. Currently, there is no specific software for identification of RNA editing sites in organelles.
To improve RNA editing study in organelles using the next-generation sequencing data, we developed the package REDO for RNA editing detection in organelles based on raw standard variant calling results from popular variant callers GATK (McKenna et al., 2010; DePristo et al., 2011) and SAMtools (Li et al., 2009; Li, 2011). REDO can identify potential RNA editing sites by applying stringent rule-dependent filters and statistical filters. REDO also provides detailed annotations, statistics, and figures for RNA editing sites. Besides, REDO can detect RNA editing events in multiple samples simultaneously and identify significantly differential proportion of RNA editing events in different samples. The genome variation can be easily removed by a subprogram in our package. Moreover, REDO can be run easily on any operating system with Perl and R environment installed. REDO is freely available at Source forge (see first Reference).
2. Methods
In principle, the bases that differ between genomic DNA sequence and RNA-seq reads from transcripts are candidates of RNA editing events. However, to achieve accurate mapping of reads, it is critical to pay attention to removal of potential false positives that result from various artifacts or errors. For RNA-seq mapping, several outstanding software have been developed, for example, GSNAP (Wu and Nacu, 2010) and BWA (Li and Durbin, 2009). The concept of RNA editing detection is identical to the genome variant calling in GATK and SAMtools. Thus, we used the preliminary output from variant calling software to identify RNA editing sites.
REDO only uses the variant call format (VCF) files (records for all sites), the genome sequence file (FASTA format, for annotation), and the gene annotation file (for annotation, feature table file, www.ncbi.nlm.nih.gov/projects/Sequin/table.html) as input. Then the raw variants are filtered by rule-dependent filters and statistical filters to reduce the false positives as following steps.
(1) Quality control filter: the low quality sites are filtered according to the reads quality (DP = 0 in GATK [reads with MQ = 255 or with bad mates are filtered] and DP4 = 0 in SAMtools [number of high-quality ref-forward, ref-reverse, alt-forward, and alt-reverse bases]).
(2) Depth filter: three criterions are used in this filter, including total reads depth (<4), alt reads depth (<3), and the total reads depth variation between alt site and adjacent nonvariant sites in specific window (total reads depth <0.2 × average reads depth of adjacent sites).
(3) Alt proportion filter: two criteria are used in this filter, including alt proportion (<0.1) and the modified alt proportion (alt proportion minus error proportion obtained from adjacent nonvariant sites in specific window; [alt_proportion-error_proportion] <0.1).
(4) Multiple alt filter: only the variant with one alt allele is retained for RNA editing detection.
(5) Distance filter: the variant sites in short distance (<3 bp) are filtered due to the possible positional interference for RNA editing.
(6) Spliced junction filter: variants within short spliced anchor (<2) are removed.
(7) Indel filter: the indel variants are removed in default (indels can be kept if assigning “-i yes” option).
(8) Likelihood ratio (LLR) test filter: a LLR test is used for RNA editing sites identification (Chepelev, 2012; Sun et al., 2016). LLR test is a probabilistic test incorporating error probability of bases (error probability is obtained using adjacent nonvariant sites in specific window) for detecting RNA editing sites (LLR <10).
(9) Fisher exact test filter: we assessed the significance for a given RNA editing site (alt reads, ref reads) by comparing its expected levels (0, alt reads + ref reads) using the Fisher exact test and the p value is used for filter (p value >0.01).
(10) The complicated filter model: based on the statistics results for experiment validated RNA editing sites and the attributes of codon table, a complicated filter model was built according to five characteristics of RNA editing sites, which are RNA editing types (C->T, A->G, T->C, etc), alt proportion, amino acids change, codon phase, and hydrophobic/hydrophilic change.
Based on the complicated filter model, the candidate RNA editing sites were divided into five tiers. The first tier was RNA editing type C->T with at least 50% reads supported, then all candidates were kept. The second tier was RNA editing type C->T without amino acid change. Only the candidates located in any base of codon encoding hydrophobic amino acid were kept. The third tier was RNA editing type C->T with amino acid change in amino acid level. If the candidates located in second or first base of codon, all of them were kept. If the candidates located in third base of codon, they were kept if amino acid changed from hydrophilic amino acid to hydrophobic amino acid. The fourth tier was other RNA editing types (A->G, T->C, etc) without amino acid change. Only the candidates located in second base of codon or in codon encoding hydrophobic amino acid were kept. The fifth tier was other RNA editing types with amino acid change. If the candidates located in second base of codon, all of them were kept. If the candidates located in first base of codon encoding hydrophobic amino acid, these candidates were kept. If the candidates located in third base of codon, they were kept if amino acid changed from hydrophilic amino acid to hydrophobic amino acid.
REDO can provide detailed annotations, including gene name, genome position, nucleotide and amino acid position in gene, codon phase, ref and editing alleles, ref and editing codons, ref and editing amino acids, editing proportion, total reads depth, reads depth of ref and editing allele, LLR, p value of fisher exact test, GC (guanine and cytosine) content of gene and surrounding sequence of RNA editing site (20 bp), and gene function. Some useful information is also provided by REDO, such as the summary for RNA editing types (C->T, T->C, etc.), hydrophobic/hydrophilic changes, codon phases of editing loci, and silent/nonsilent changes. To illustrate these attributes of RNA editing sites, 16 figures are produced using R program.
Inspecting the significantly differential proportion of RNA editing events in multiple samples is a popular interest of researchers. REDO can detect RNA editing events in multiple samples simultaneously and identify RNA editing loci with significantly differential editing proportion in different samples (the pairwise comparison and the cluster analysis of RNA editing sites in multiple samples). A subprogram fish.pl is provided to find common or unique sites in two samples or remove the genome variants in REDO result by comparing with genome variant file. This program can deal with the most commonly used file formats *.fa, *.psl, and *.csv. It takes the “baits” (unique keys composed of one or several columns that are universal in both files) from the “bait” file and searches the “baits” in the “fish” file. By default, it prints the items in “fish” file that also exist in “bait” file.
3. Results
Huang et al. (2013) identified 75 C->T RNA editing sites in chloroplast (cp) of coconut (Cocos nucifera L.) by RT-PCR experiments, and several public RNA-seq data of coconut were deposited in NCBI SRA database. Thus, we used coconut cp (KX028884/KF285453) and related RNA-seq data for cp RNA editing test (Supplementary Table S1). Meanwhile, Philippe Giege et al. reported 455 C->T RNA editing sites by cDNA clones sequencing in Arabidopsis (Arabidopsis thaliana) mt (Giegé and Brennicke, 1999) and a lot of Arabidopsis RNA-seq data is available. Therefore, we used Arabidopsis mt (NC_001284) and related RNA-seq data (SRR2079784) for mt RNA editing test (Supplementary Table S1).
The cp RNA-seq data were mapped by GSNAP (version: 2014-12-19) whereas mt RNA-seq data were mapped by BWA (Version: 0.7.10-r789) and GSNAP. All variants were identified by SAMtools (Version: 1.2) and BCFtools (Version: 1.2) (Table 1). Since the size of the organelle genomes and VCF files was relatively small, REDO required very low memory consumption and runs <2 minutes for eight samples in coconut cp and <1 minute for one sample in Arabidopsis mt. Considering the time for SAMtools and BCFtools, REDO needed 9 minutes and 54 seconds for cp1and 4 minutes and 28 seconds for mt, whereas REDItools spent 33 minutes and 50 seconds for cp1 and 42 minutes and 22 seconds for mt.
cp, chloroplast; mt, mitochondria.
Identification, annotation, and statistics of RNA editing sites were performed by Perl script, while figures were drawn using R program. All test data were run on a Linux system. Comparing the performance between two methods, REDO has higher precision rate (80.72% vs. 75.00% in cp1 and 88.32% vs. 83.37% in mt) and slightly higher specificity (99.95% vs. 99.93% in cp1 and 99.84% vs. 99.76% in mt), whereas REDItools has higher sensitivity (92.00% vs. 89.33% in cp1 and 82.01% vs. 81.31% in mt) (Table 2). Comparing the true RNA editing sites with the common RNA editing sites identified by two methods in cp and mt, the precision rate, specificity, and sensitivity are similar to the result obtained by REDO alone. The accuracy of REDO is underestimated due to the sample difference between experiment validated data and RNA-seq data (tissue specific of RNA editing). By comparing with the prediction of PREP software (Mower, 2009), REDO has higher precision rate (80.72% vs. 59.81%), sensitivity (89.33% vs. 85.33%), and specificity (99.95% vs. 99.87%) in testing data set of coconut chloroplast (SRR1063404).
REDItools was run with “-c 4” option (total reads coverage ≥4) and the result was filtered by p value ≤0.01. RED was run using “-a 0, -s 0” option (minimum alt distance = 0 and minimum junction anchor size = 0) for mt data and default for cp data with applying the complicated filter model. The true negative number was obtained using total inspected gene length minus total identified RNA editing sites.
All possible RNA editing types.
There are 455 C->T RNA editing sites in Arabidopsis by cDNA clones sequencing, whereas 428 C->T RNA editing sites are located in the CDS region. We only used these 428 C->T RNA editing sites for mt RNA editing sites test.
Precision = True/total, True is defined as experimental validated RNA-editing sites; Sensitivity = True+/(True+ + False−); Specificity = True−/(True− + False+).
CT, C->T type.
In general, REDItools only reports the genome position for each RNA editing site, whereas REDO shows gene name, genome position, gene position, amino acid position, codon phase, base change, codon change, amino acid change, and other information for RNA editing sites (Fig. 1). In addition, the result of REDO can be used for publication, whereas REDItools result needs additional process. REDO can also detect RNA editing events and identify the significant differential editing level in multiple samples simultaneously. Cluster analysis and heatmap plotting are also provided based on the RNA editing proportion (Fig. 2). A matrix for editing allele proportion of RNA editing sites in all samples was produced. The heatmap was plotted based on this matrix using heatmap function in R. In heatmap function, the distance matrix of different samples was calculated using “dist” function with the default Euclidean method, and the hierarchical clustering was computed using “hclust” function with the complete method.
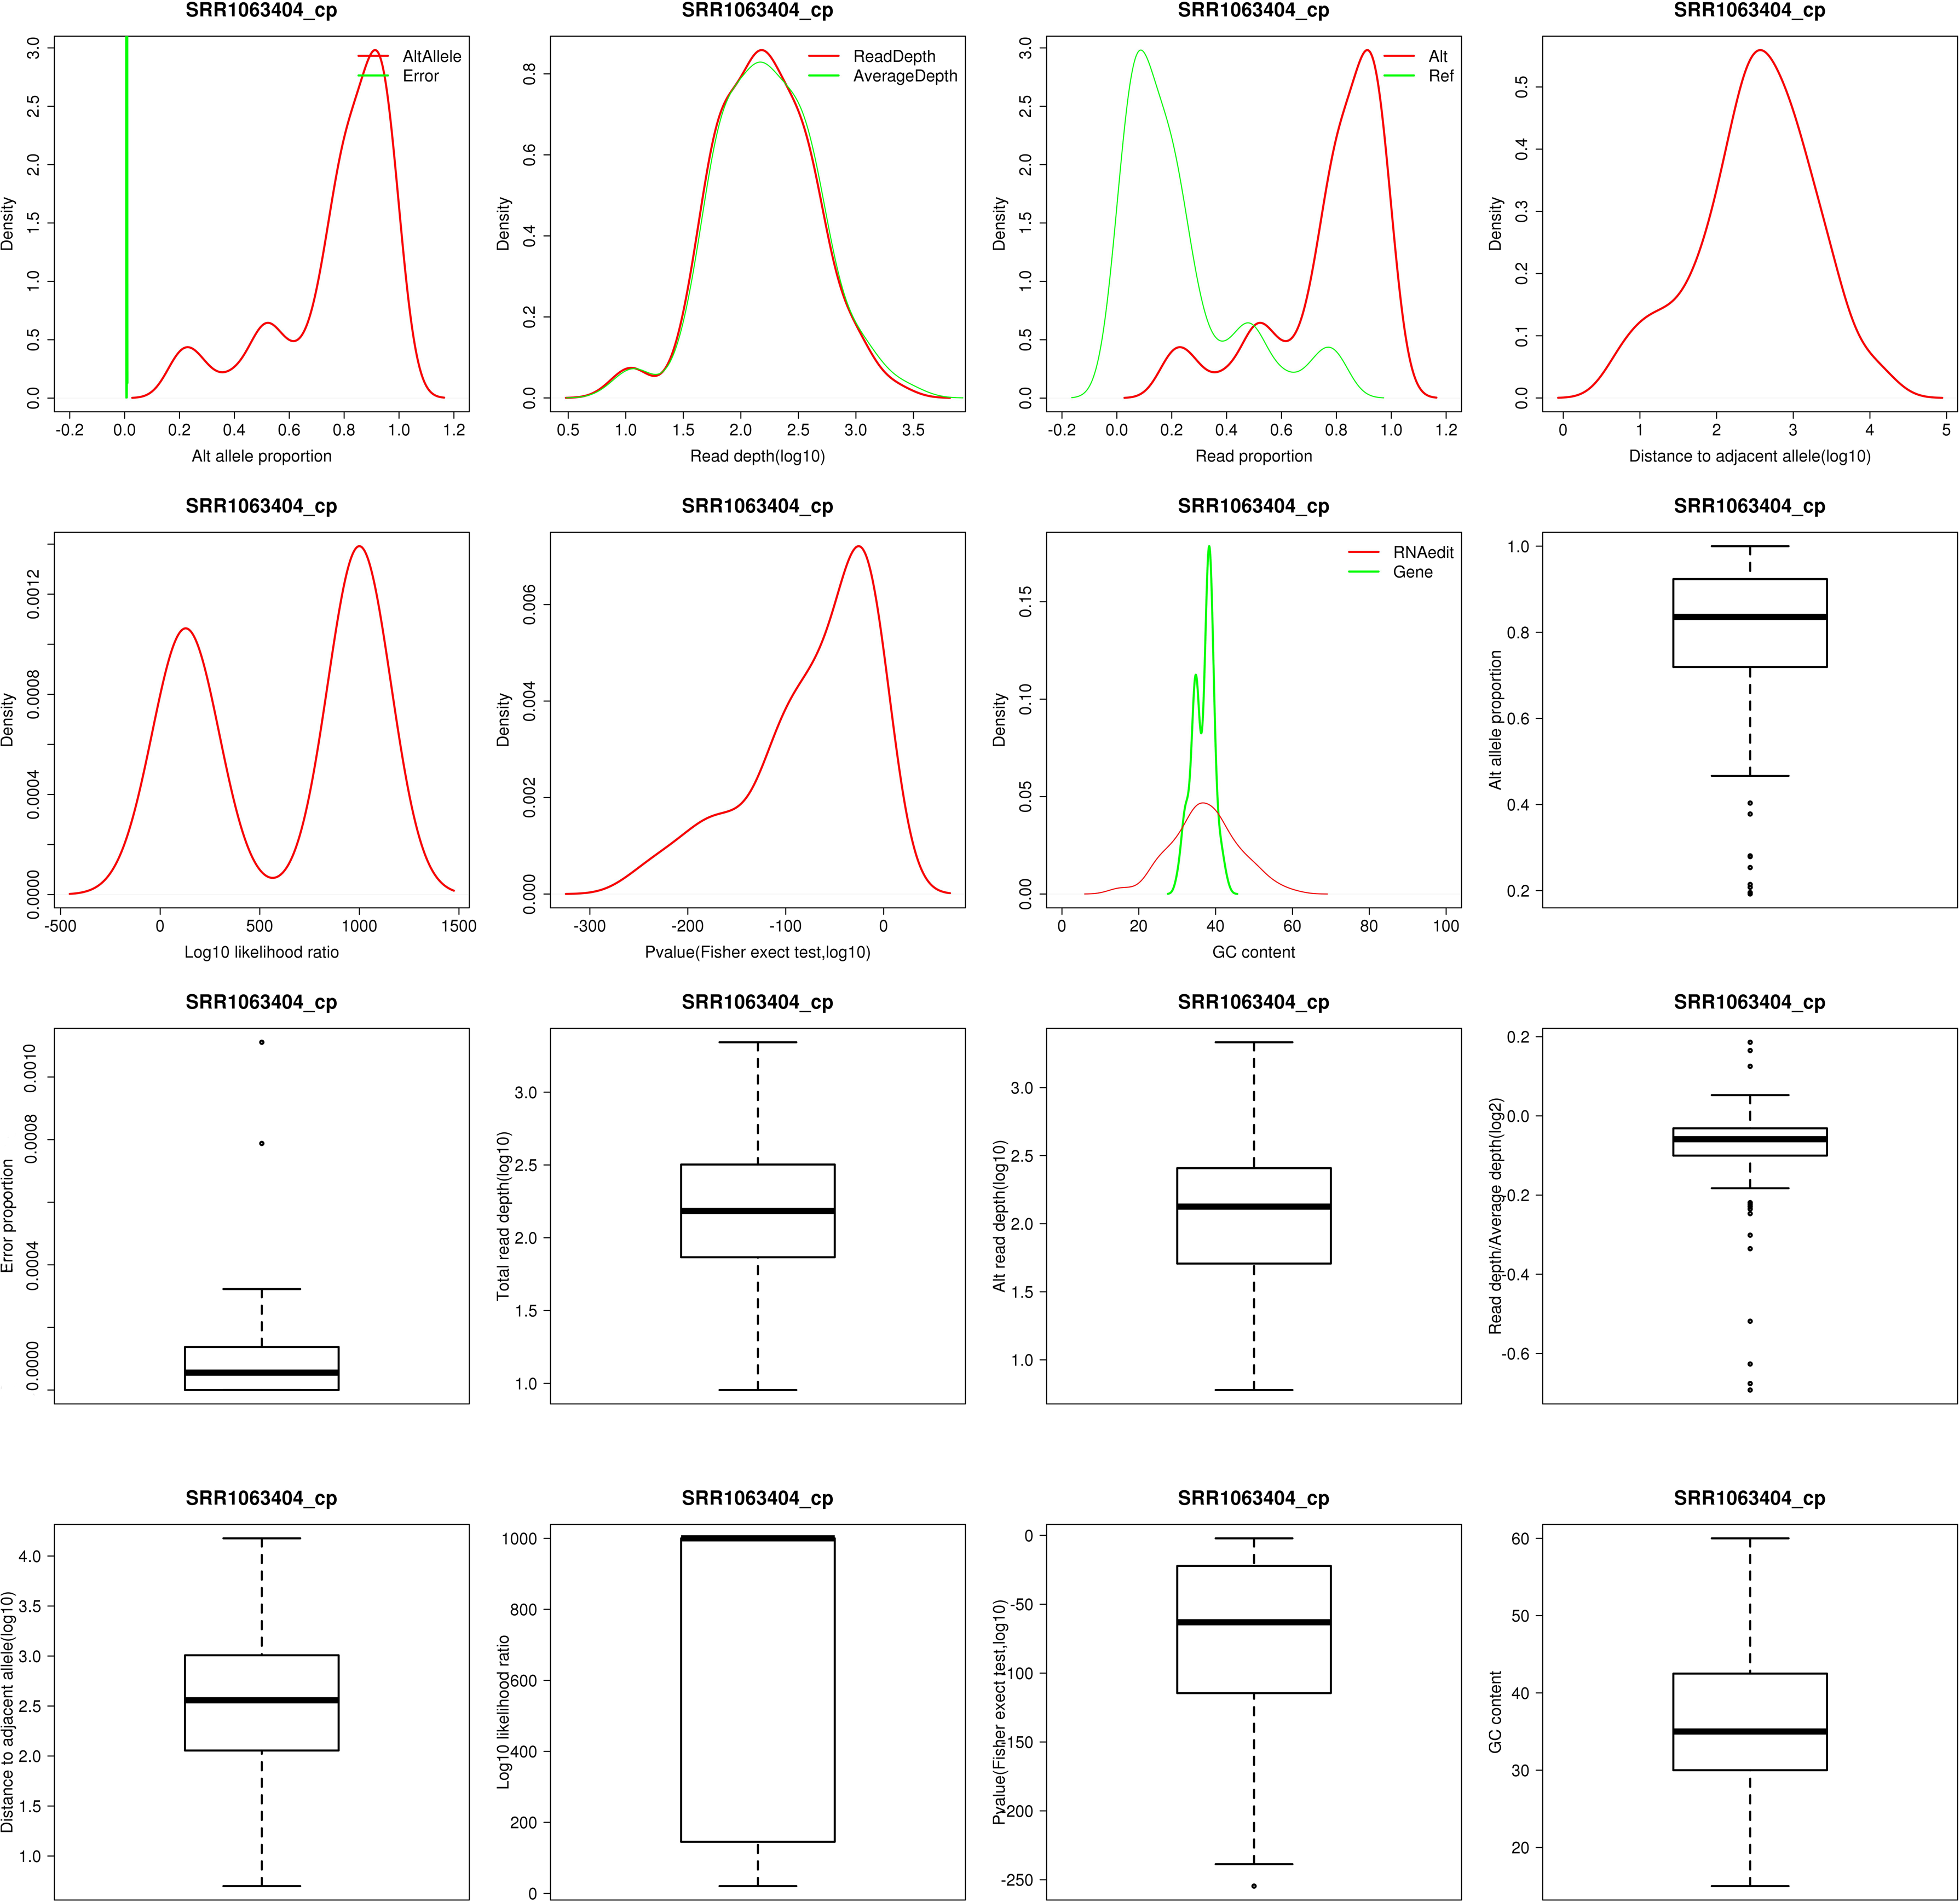
The attributes of RNA editing sites in coconut cp1 (SRR1063404). The density of alternative allele proportion and sequencing error proportion, the density of total read depth and average read depth, the density of read proportion for alternative allele and reference allele, the density of distance to adjacent candidate editing site, the density of log10 LLR, the density of p value, the density of GC content, the boxplot of alternative allele proportion, the boxplot of sequencing error proportion, the boxplot of total read depth, the boxplot of total read depth/average read depth, the boxplot of distance to adjacent candidate editing site, the boxplot of log10 LLR, the boxplot of p value and the boxplot of GC content are shown for RNA editing sites. cp, chloroplast; GC, GC content; LLR, likelihood ratio.
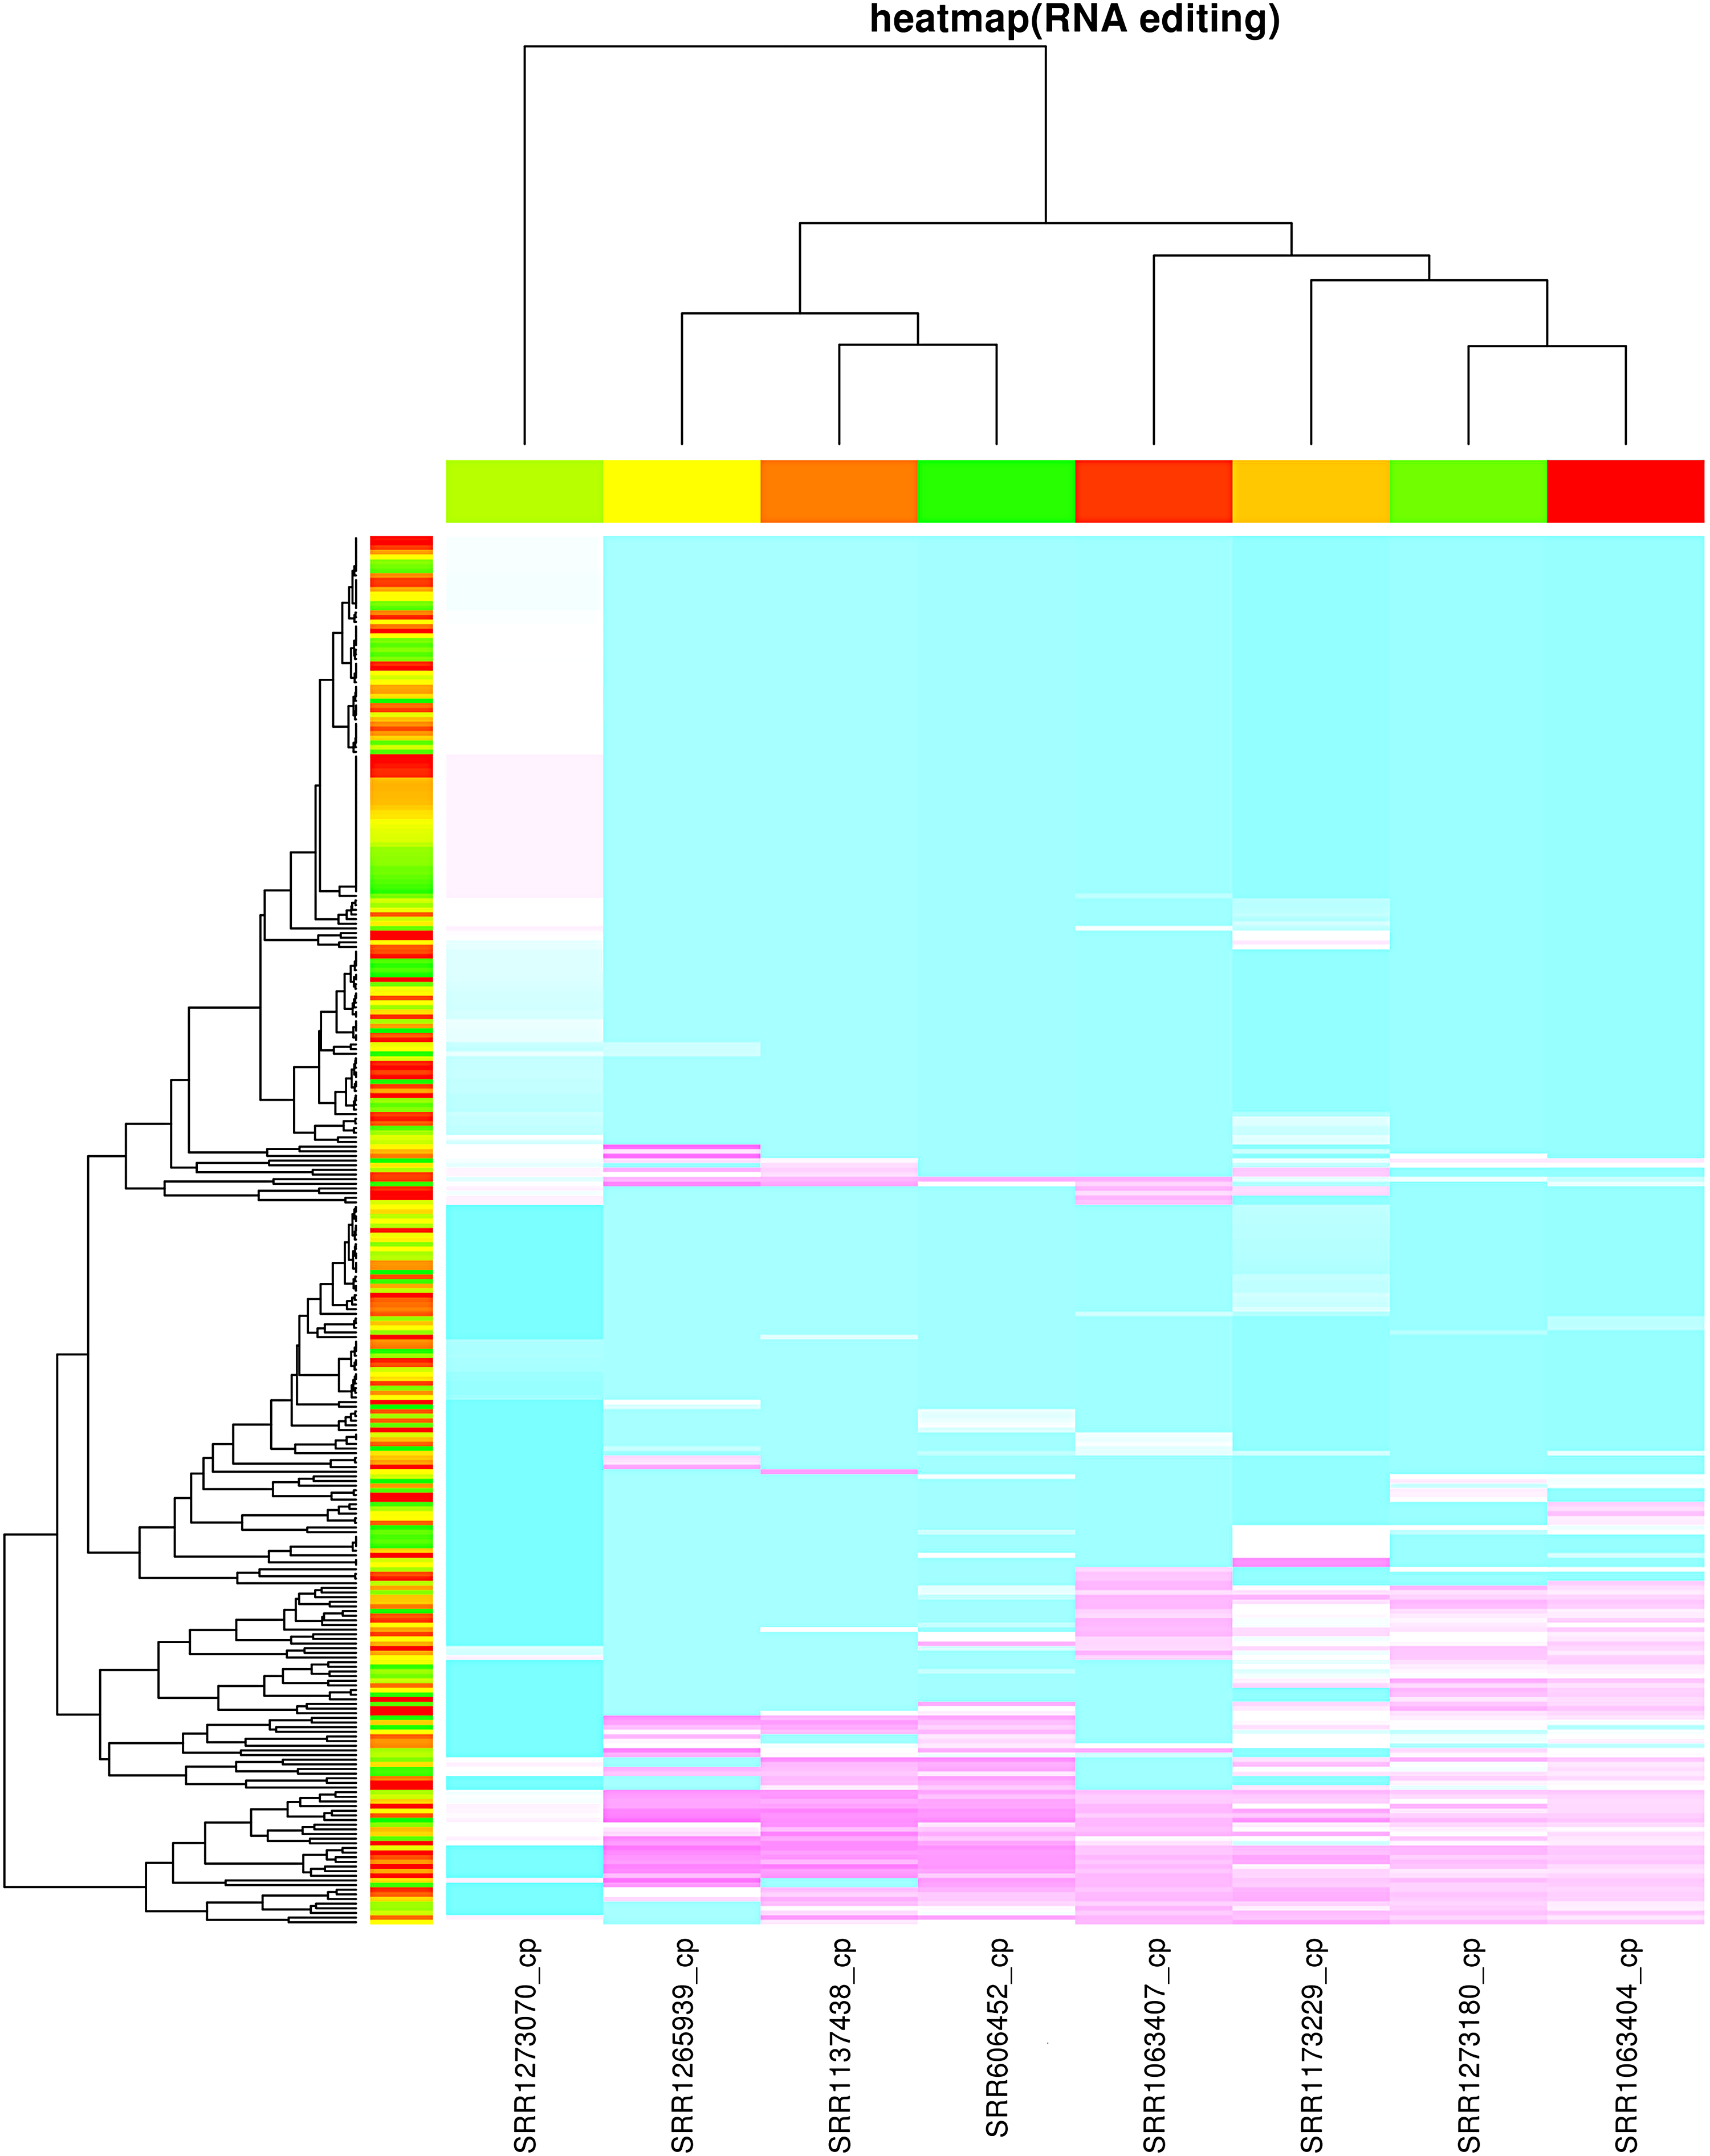
The cluster of RNA editing sites in coconut cp based on eight RNA-seq data according to the RNA editing proportions.
4. Conclusion
In summary, by using REDO, users could identify RNA editing sites based on RNA-seq data simpler and faster. First, it provides major processes for RNA editing analysis, including RNA editing detection, annotation, statistics analysis, identification of differential proportion of RNA editing sites with higher precision rate, and more specificity. Second, it enables RNA editing analysis with multiple samples as well as cluster analysis. Third, REDO could generate publication-ready figures and other illustrations. Moreover, the subprogram fish.pl can be used to process the REDO result tables easily and quickly.
Footnotes
Acknowledgments
This study is supported by grants from the Strategic Priority Research Program of the Chinese Academy of Sciences (Grant No. XDA08020102), National Natural Science Foundation of China (Grant Nos. 31501042, 31271385, and 31200957), and King Abdulaziz City for Science and Technology (KACST) grant 1035-35 from KACST, Kingdom of Saudi Arabia. Technical supports were provided by the CAS Key Laboratory of Genome Science and Information, Beijing Institute of Genomics, Chinese Academy of Sciences, People's Republic of China. We also thank all anonymous reviewers and Dr. Shenghan Gao, Dr. Sen Wong, and Dr. Zilong He for critical comments and helpful suggestions.
Author Disclosure Statement
No competing financial interests exist.
References
Supplementary Material
Please find the following supplemental material available below.
For Open Access articles published under a Creative Commons License, all supplemental material carries the same license as the article it is associated with.
For non-Open Access articles published, all supplemental material carries a non-exclusive license, and permission requests for re-use of supplemental material or any part of supplemental material shall be sent directly to the copyright owner as specified in the copyright notice associated with the article.