
Abstract
Abstract
Profile hidden Markov models (pHMMs) have been used to search for transposable elements (TEs) in genomes. For the learning of pHMMs aimed to search for TEs of the retrotransposon class, the conventional protocol is to use the whole internal nucleotide portions of these elements as representative sequences. To further explore the potential of pHMMs in such a search, we propose five alternative ways to obtain the sets of representative sequences of TEs other than the conventional protocol. In this study, we are interested in Bel-PAO, Copia, Gypsy, and DIRS superfamilies from the retrotransposon class. We compared the pHMMs of all six protocols. The test results show that, for each TE superfamily, the pHMMs of at least two of the proposed protocols performed better than the conventional one and that the number of correct predictions provided by the latter can be improved by considering together the results of one or more of the alternative protocols.
1. Introduction
T
Some reviews (Bergman and Quesneville, 2007; Lerat, 2010) describe methods aimed to identify TEs in genomes. A promising approach is profile hidden Markov models (pHMMs) (Eddy, 1998; Krogh, 1998), probabilistic models that have been used to search for particular classes of sequences in genomes; this is the case of TEs: given a TE superfamily, the corresponding pHMM is used to search for members of such a superfamily into a genome, including distant homologue copies. However, it is important to observe that, as described in those reviews, no single method seems to be able to identify all TEs of a genome.
A pHMM can be learned using an alignment of NT sequences, representative of a specific TE superfamily. There are several sources from which representative sequences of TEs can be obtained. A well-known and used source is Repbase (Jurka et al., 2005), which provides a variety of information related to TEs, such as the NT sequences corresponding to the whole internal portions of retrotransposons, the locations of their coding sequences (CDS), and the TE classification of those sequences.
For the learning of pHMMs aimed to search for retrotransposons, the conventional protocol is to use the whole internal NT portions of such elements as representative sequences. This is the more direct and easier way to obtain such sequences, with no need for additional sequence processing.
In this study, we propose five different protocols to obtain the sets of representative sequences of retrotransposons to be used to learn pHMMs. One of them is aimed at the whole TEs (the conventional protocol also has this aim). For the others, the focus is the CDS of TEs, trying to identify regions in a genome that would maintain some level of conservation with respect to the coding regions related to a TE superfamily. The specific use of coding regions to improve TE detection was already addressed by Buisine et al. (2008). In their proposal, new representative sequences are built to be used in similarity searches: parts of the coding region of a representative sequence are replaced by fragments of TEs identified in a genome. In our approaches, we do not build new sequences; we simply use the coding regions of the original representative sequences of TEs, with no modifications, to learn pHMMs.
The set of sequences obtained for each protocol was used to learn the corresponding pHMM. Then, we compared the five resulting pHMMs with the one of the conventional protocol, testing them in two different ways. First, we tested the pHMMs considering only sequences from Repbase, for both training and testing; after that, we evaluated the protocols on the Drosophila melanogaster genome.
Our aim here is at comparing the protocols and not at comparing the HMM method with other ones. We are interested in exploring more the potential of pHMMs to be used to search for retrotransposons, learning them considering only the initial database of representative sequences, without additional external sources of annotation.
2. Methods
This section describes the main aspects of the six protocols used to obtain the sets of representative sequences of retrotransposons to train the pHMMs (in this study, we used version 18.01 of Repbase). We also describe the experimental setup and how we evaluated it.
2.1. The protocols
We call “protocol” the way of selecting sequences to train pHMMs. Usually in the literature of pHMMs and retrotransposons, the whole internal portions of the available sequences of such elements are used for training. This is what we called the Complete protocol. The Complete protocol and the other five possibilities of protocols are described below. It is important to remark that at least one pHMM for each superfamily is trained in each protocol.
1. Complete protocol: The first protocol is the conventional one: sequences of the whole (complete) internal NT portions of retrotransposons are used to train the pHMM of each superfamily (we obtained the sequences from Repbase). We call this the Complete protocol.
2. Complete-cluster protocol: In the Complete-cluster protocol, the sequences obtained for each superfamily in the Complete protocol are clustered according to the level of similarity and each resulting cluster is aligned to learn the pHMM (here, each superfamily can present more than one pHMM).
3. CDS protocol: The CDS protocol considers only the NT regions corresponding to the CDS of retrotransposons. In our tests, these NT sequences for each TE superfamily were obtained directly from Repbase; they were aligned and used to train the related pHMM.
4. CDS-cluster protocol: In this protocol, each set of NT sequences obtained in the CDS protocol is clustered based on the similarity. Each resulting cluster is aligned to train a pHMM (each superfamily can present more than one pHMM).
5. CDS-domain protocol: CDS-domain protocol considers CDS that present at least one region that can be recognized as related to conserved domains of TEs, particularly, aspartic proteinase, reverse transcriptase, RNase H, and integrase/tyrosine recombinase (Wicker et al., 2007; Lerat, 2010). For each superfamily, the subset of CDS of interest was obtained by submitting the CDS to CDD (Conserved Domains Database; www.ncbi.nlm.nih.gov/Structure/cdd) online search tool (only hits with e-value of 1e-05 and below were included in the subsets). One pHMM was learned for each superfamily using the corresponding CDS subset. It must be observed that, for these CDS subsets, we took the whole CDS and not only the regions related to the conserved domains.
6. Domain-cluster protocol: In the Domain-cluster protocol, the sequences obtained for the CDS-domain protocol are clustered (each superfamily can present more than one pHMM).
Figure 1 shows a schematic diagram of the six protocols. Each resulting set of sequences was aligned, using the MAFFT program (Katoh and Standley, 2013), before learning the pHMM; for some protocols, the sets of sequences were clustered—the CD-Hit package (Li and Godzik, 2006) was used for this. The HMMER (Eddy, 2009) program, version 3.1b1, was used to both build the HMMs (command hmmbuild) and run them (command nhmmer) on NT sequences. These programs provided all the necessary conditions and results to show our intended purpose: to compare the studied protocols.
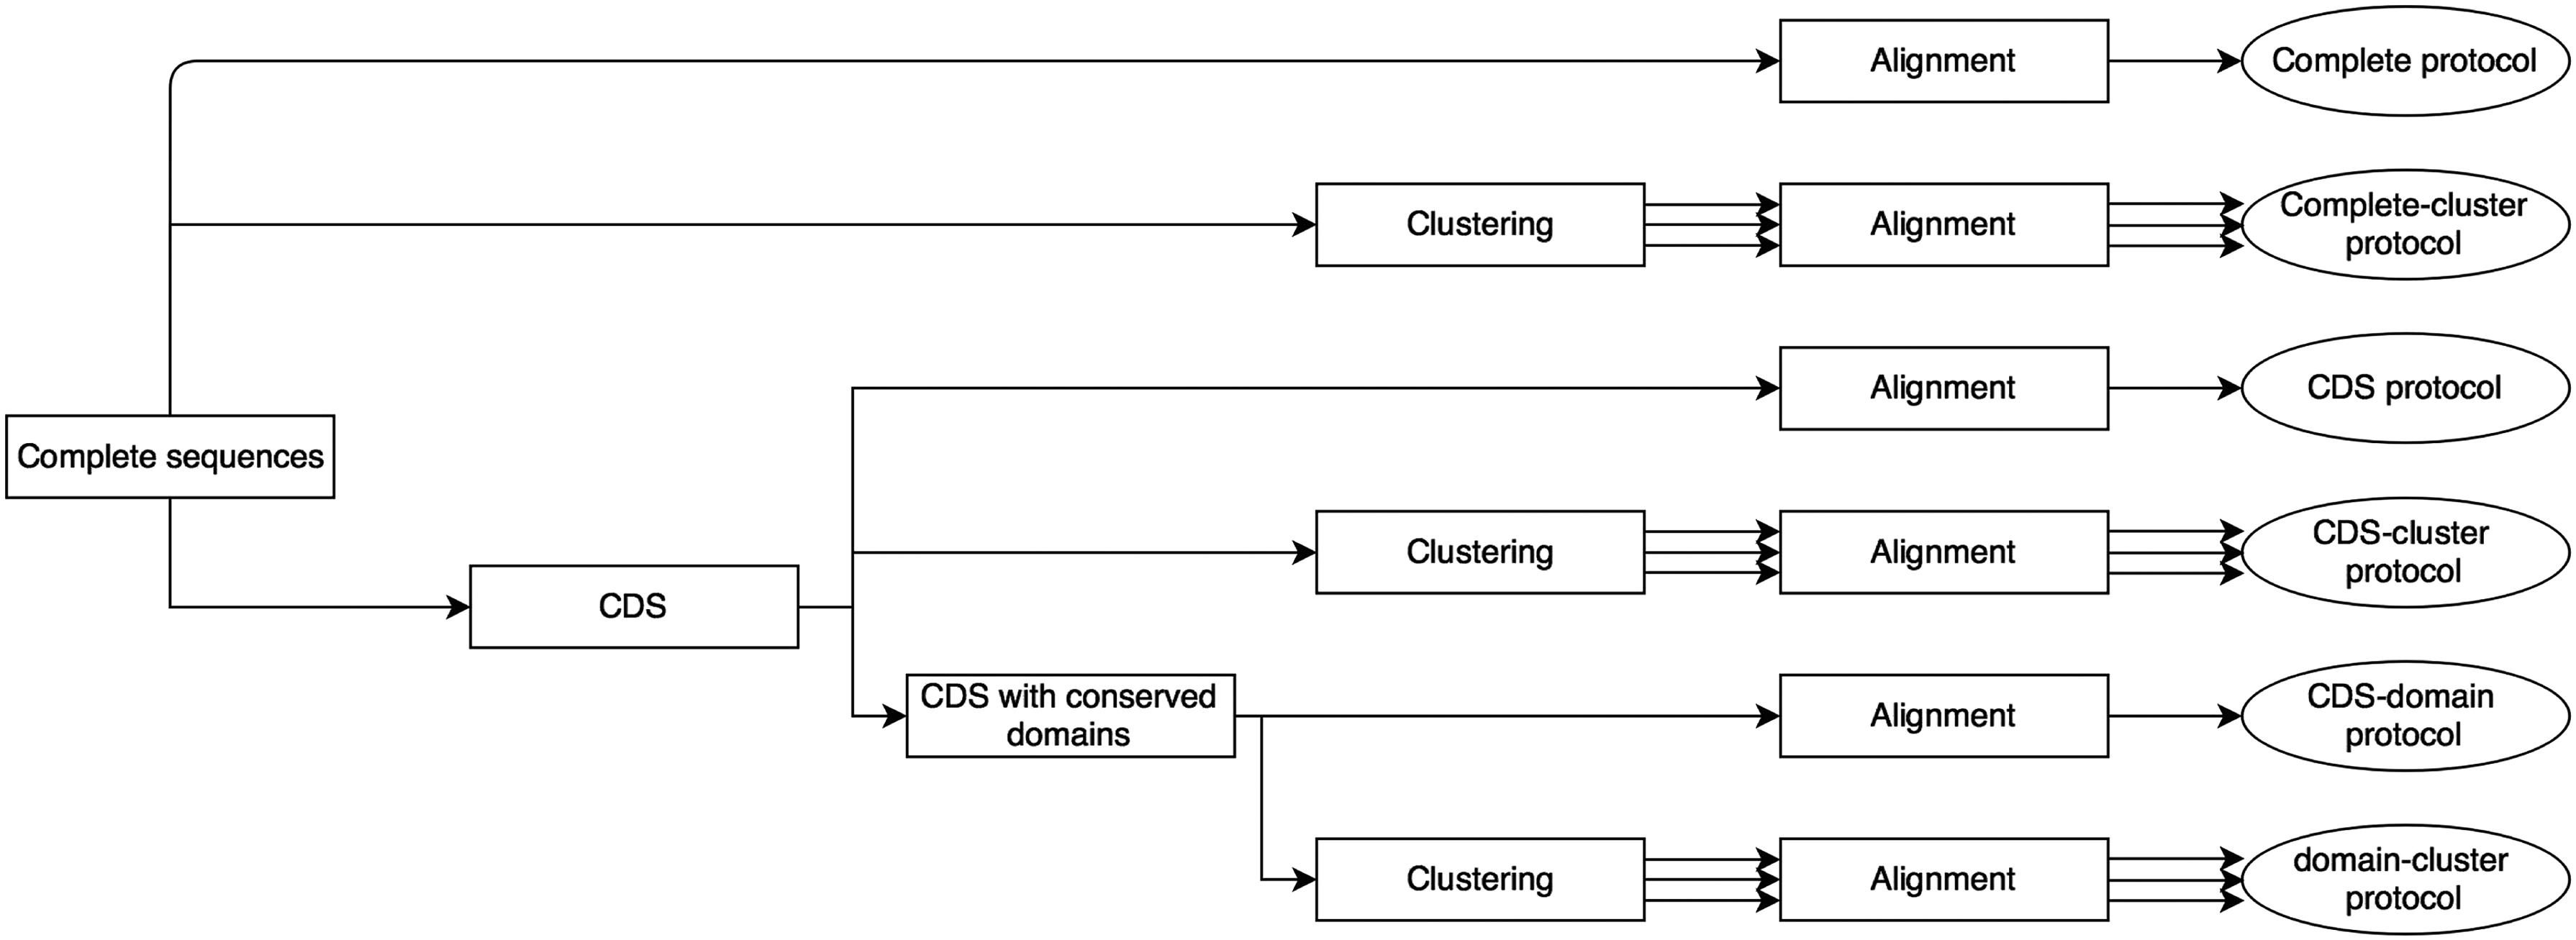
Schematic diagram of the six protocols. CDS, coding sequences.
2.2. Protocol evaluation
We ran two types of experiments to evaluate the protocols. In the first one, we used only sequences from Repbase separated in two sets: one to learn the pHMMs and the other as the test set—we performed the k-fold cross-validation method, with k = 10 (the number of representative sequences of TEs of each superfamily used for each protocol is shown in Supplementary Table S1). Each training set in each run has to be aligned to train the corresponding pHMM. For the protocols that use the clustering process, each training set has to be clustered before the alignment—in average, four clusters were generated for each training set.
In the second type of experiment, we learned new pHMMs corresponding to all protocols (for each superfamily) and tested them on the D. melanogaster genome—the genome and annotation were downloaded from FlyBase (http://flybase.org/), version 6.08. To train the new pHMMs, we used sequences of retrotransposons from Repbase, excluding the ones related to D. melanogaster. For each superfamily were built six models—one for each protocol; for the protocols that use clustering, each (general) model consisted of one pHMM for each generated cluster.
In both tests, we used the metrics Precision (P—positive predictive value), Recall (R—true positive rate—sensitivity), and F-measure (F—harmonic mean of precision and recall). Precision and Recall use the number of false negative (FN), true positive (TP), and false positive (FP) predictions. The equations for Precision, Recall, and F-measure are respectively 1, 2, and 3.
To verify the best trade-off between Precision and Recall for each superfamily and protocol, we used several thresholds to filter the predictions according to their e-values retrieved by HMMER—we varied the threshold from 1e-05 to 1e-34 (for levels below 1e-34, we observed a degradation in the results for many of the protocols). In Repbase tests, the averages of the results of the k-fold cross-validation were used in this evaluation.
3. Results
3.1. Tests using Repbase
As described in the Introduction section, the aim of the tests considering only sequences from Repbase (for both training and testing the pHMMs) was to compare the results produced by the pHMMs of the five proposed protocols with the results of the Complete one. Figure 2 shows the performances of the pHMMs for all superfamilies. In such a figure, the Filtering axis represents the threshold used to filter the predictions. For example, a filtering of 15 means a threshold of 1e-15: only predictions with e-values equal or lower than this threshold were considered to calculate the corresponding F-measure.
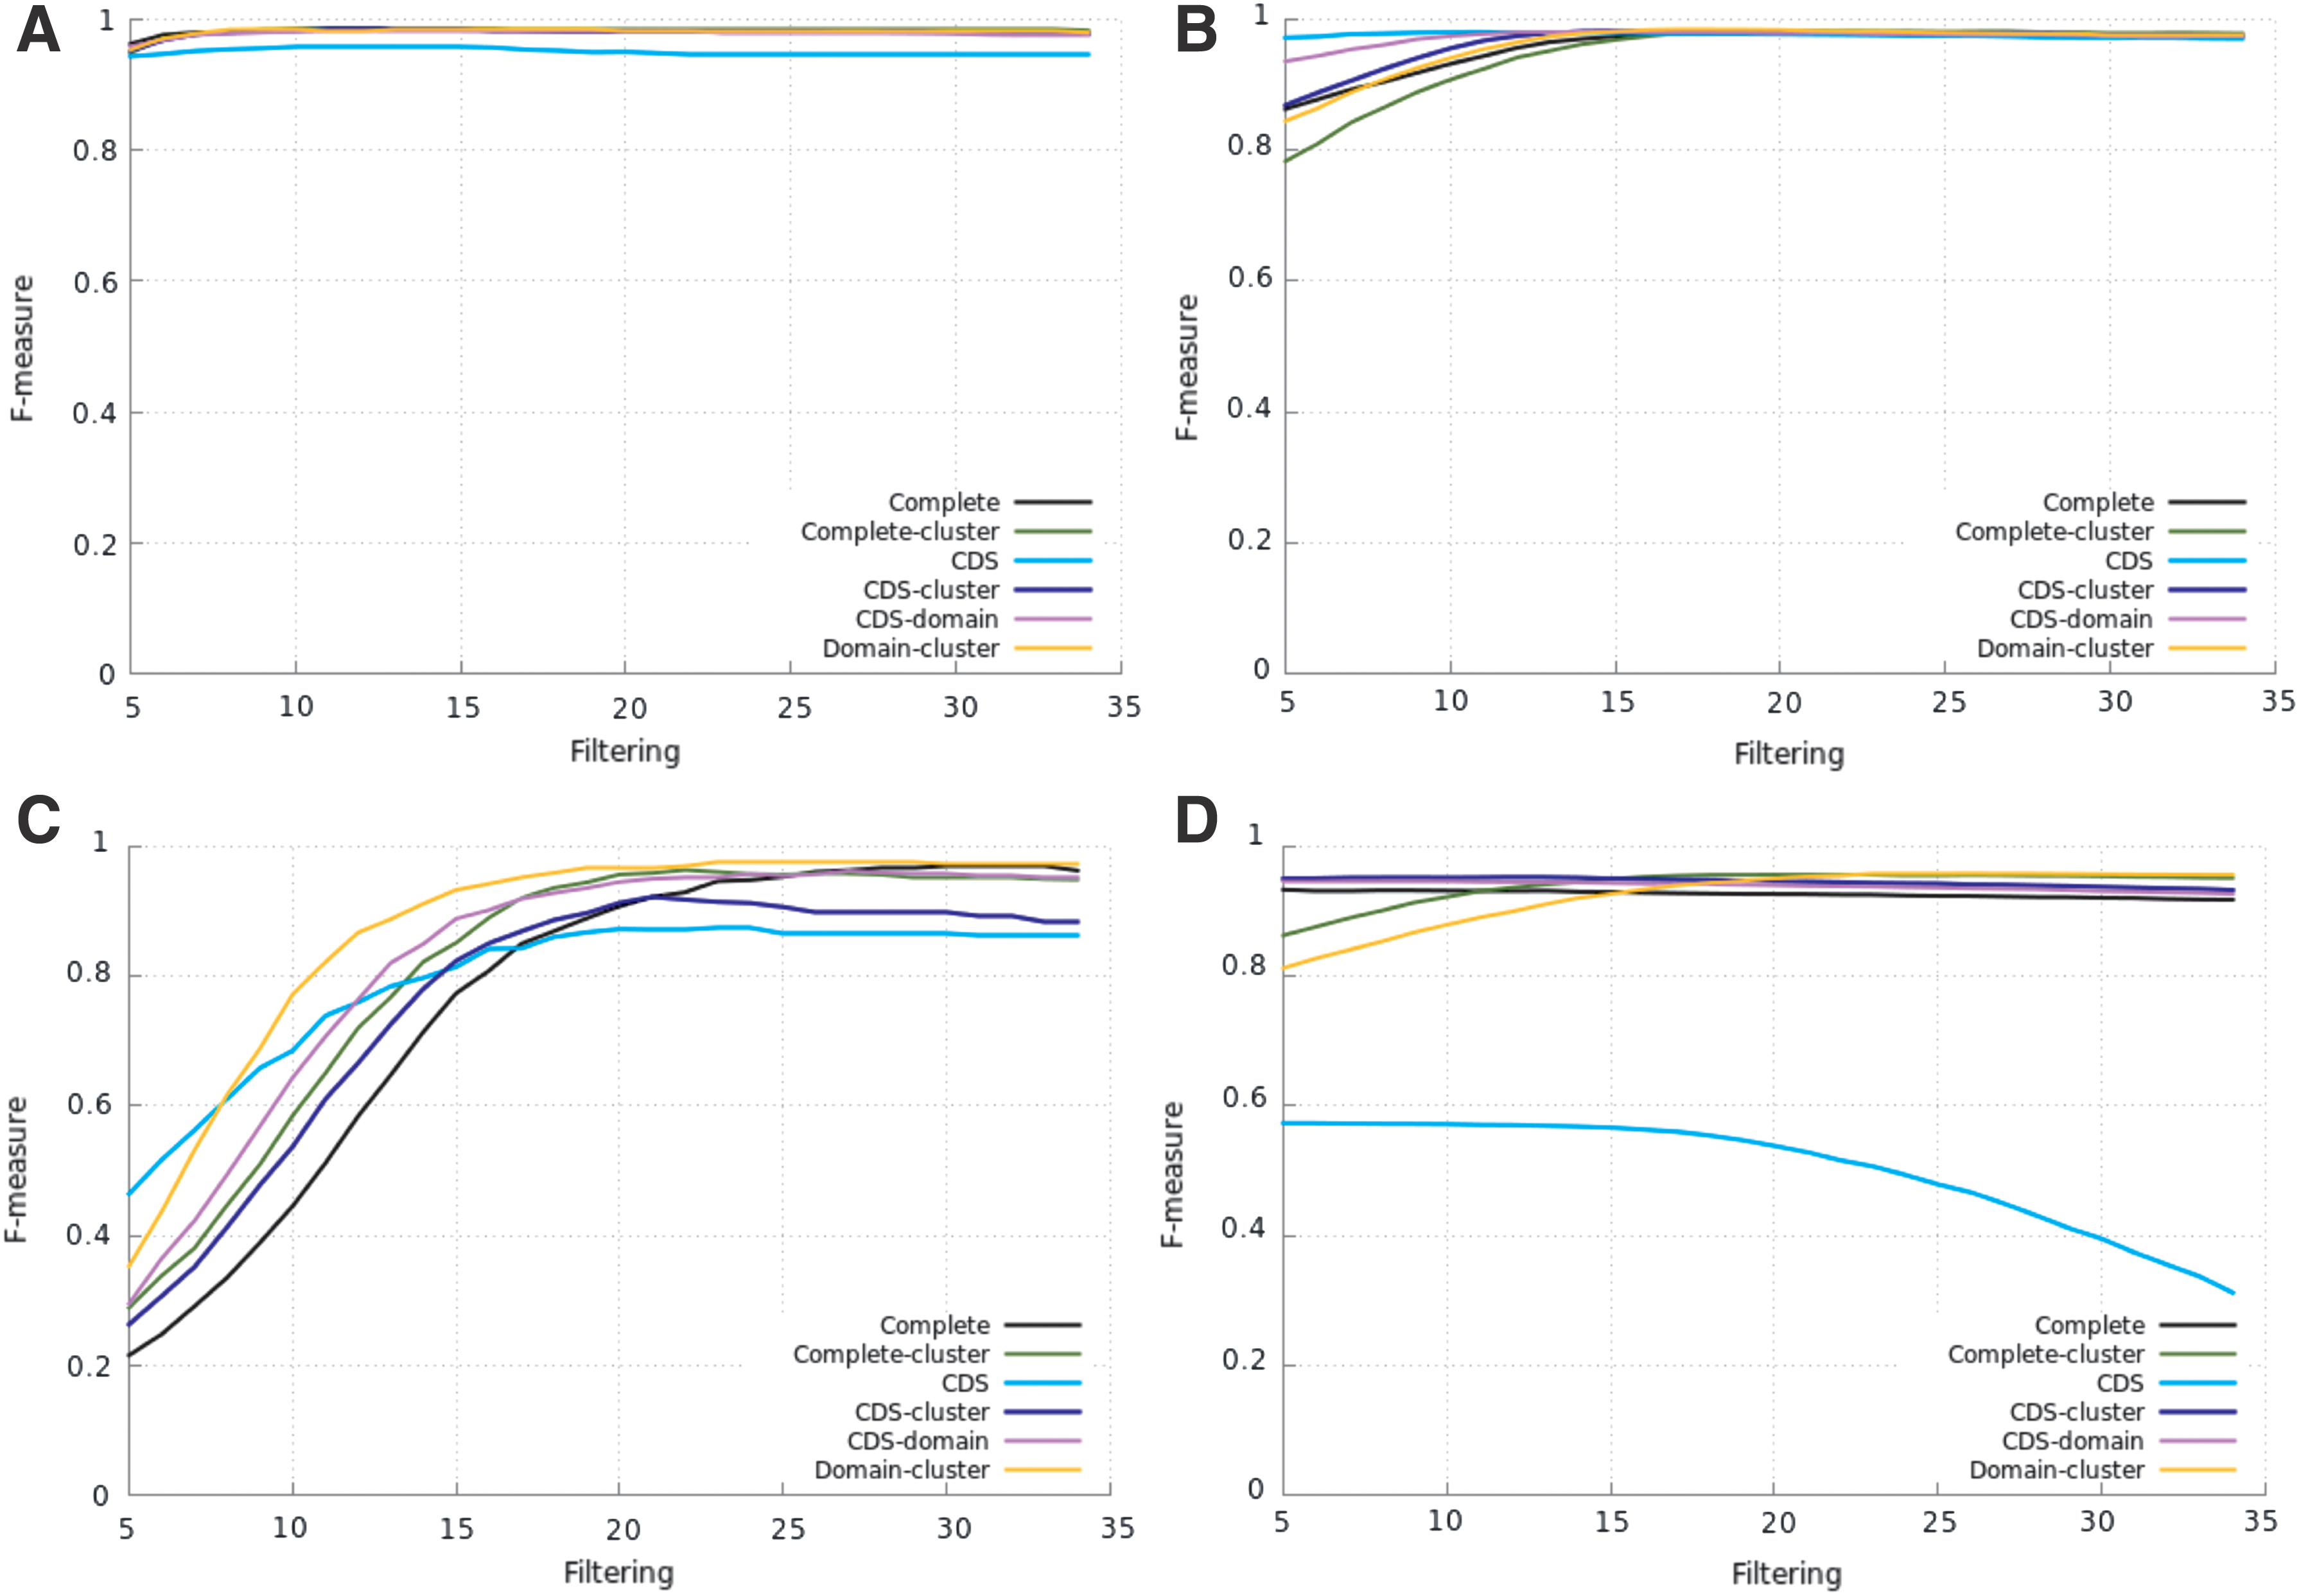
Filtering versus F-measure on Repbase sequences. Bel-PAO superfamily
For Bel-PAO superfamily (Fig. 2a), all resulting F-measures are very high (>0.94) and present small variations within the protocols for all threshold values. The protocols Complete-cluster (for threshold of 1e-09 and below) and Domain-cluster (for most of the threshold values) were slightly better than Complete. The Complete-cluster protocol produced the highest F-measures.
For Copia superfamily (Fig. 2b), for thresholds of 1e-10 and lower, the pHMMs of all protocols presented very similar performances, with high F-measures. The CDS-cluster protocol presented always slightly better performance than Complete; Domain-cluster (except for the highest thresholds, from 1e-05 to 1e-07) and Complete-cluster (except from 1e-05 to 1e-16) were better than Complete. The Complete protocol only performed (slightly) better than CDS (for threshold lower than 1e-16) and CDS-domain (for threshold of 1e-19 and below). The highest F-measure was produced by Domain-cluster.
Figure 2c shows the results for DIRS superfamily. For thresholds from 1e-05 to 1e-16, all protocols performed better than Complete. However, from 1e-05 to 1e-10, the values of F-measure are low or even very low (the reason for this is the high number of FP in this threshold range—details in the Supplementary Material, Observation 2 and Supplementary Table S2); therefore, these values of threshold should not be used on these protocols for DIRS superfamily. Domain-cluster always performed better than Complete, presenting the highest F-measures: >0.970 for thresholds below 1e-22 (as shown in Supplementary Table S2, using threshold of 1e-20, the Domain-cluster missed only 4 annotated sequences, with only 8 FP). In the range below 1e-26, the Complete protocol presented very high F-measures (>0.960) as well.
Based on Figure 2d, the CDS protocol should not be used for the Gypsy superfamily. The other five protocols presented high and very close F-measure values for thresholds lower than 1e-10. The CDS-cluster and CDS-domain protocols presented the same performance of Complete. For thresholds of 1e-16 and lower, Complete-cluster and Domain-cluster performed better than Complete and produced the highest F-measures.
Supplementary Tables S3–S6 show some numbers for the FN and FP related to the results presented in Figure 2.
3.2. Tests with the D. melanogaster genome
For the evaluation of the pHMMs of all protocols on a real genome, we used the D. melanogaster one. We chose the D. melanogaster genome because it is considered to be a very well TE-annotated one. The genome and TE annotation were downloaded from FlyBase because a large list of TEs from this organism is available from this database. The results of these tests are shown in Figure 3 for Bel-PAO, Copia, and Gypsy superfamilies (there is no annotation for DIRS in FlyBase for D. melanogaster). The curves were obtained by varying the threshold from 1e-05 to 1e-34 (as in Repbase tests).
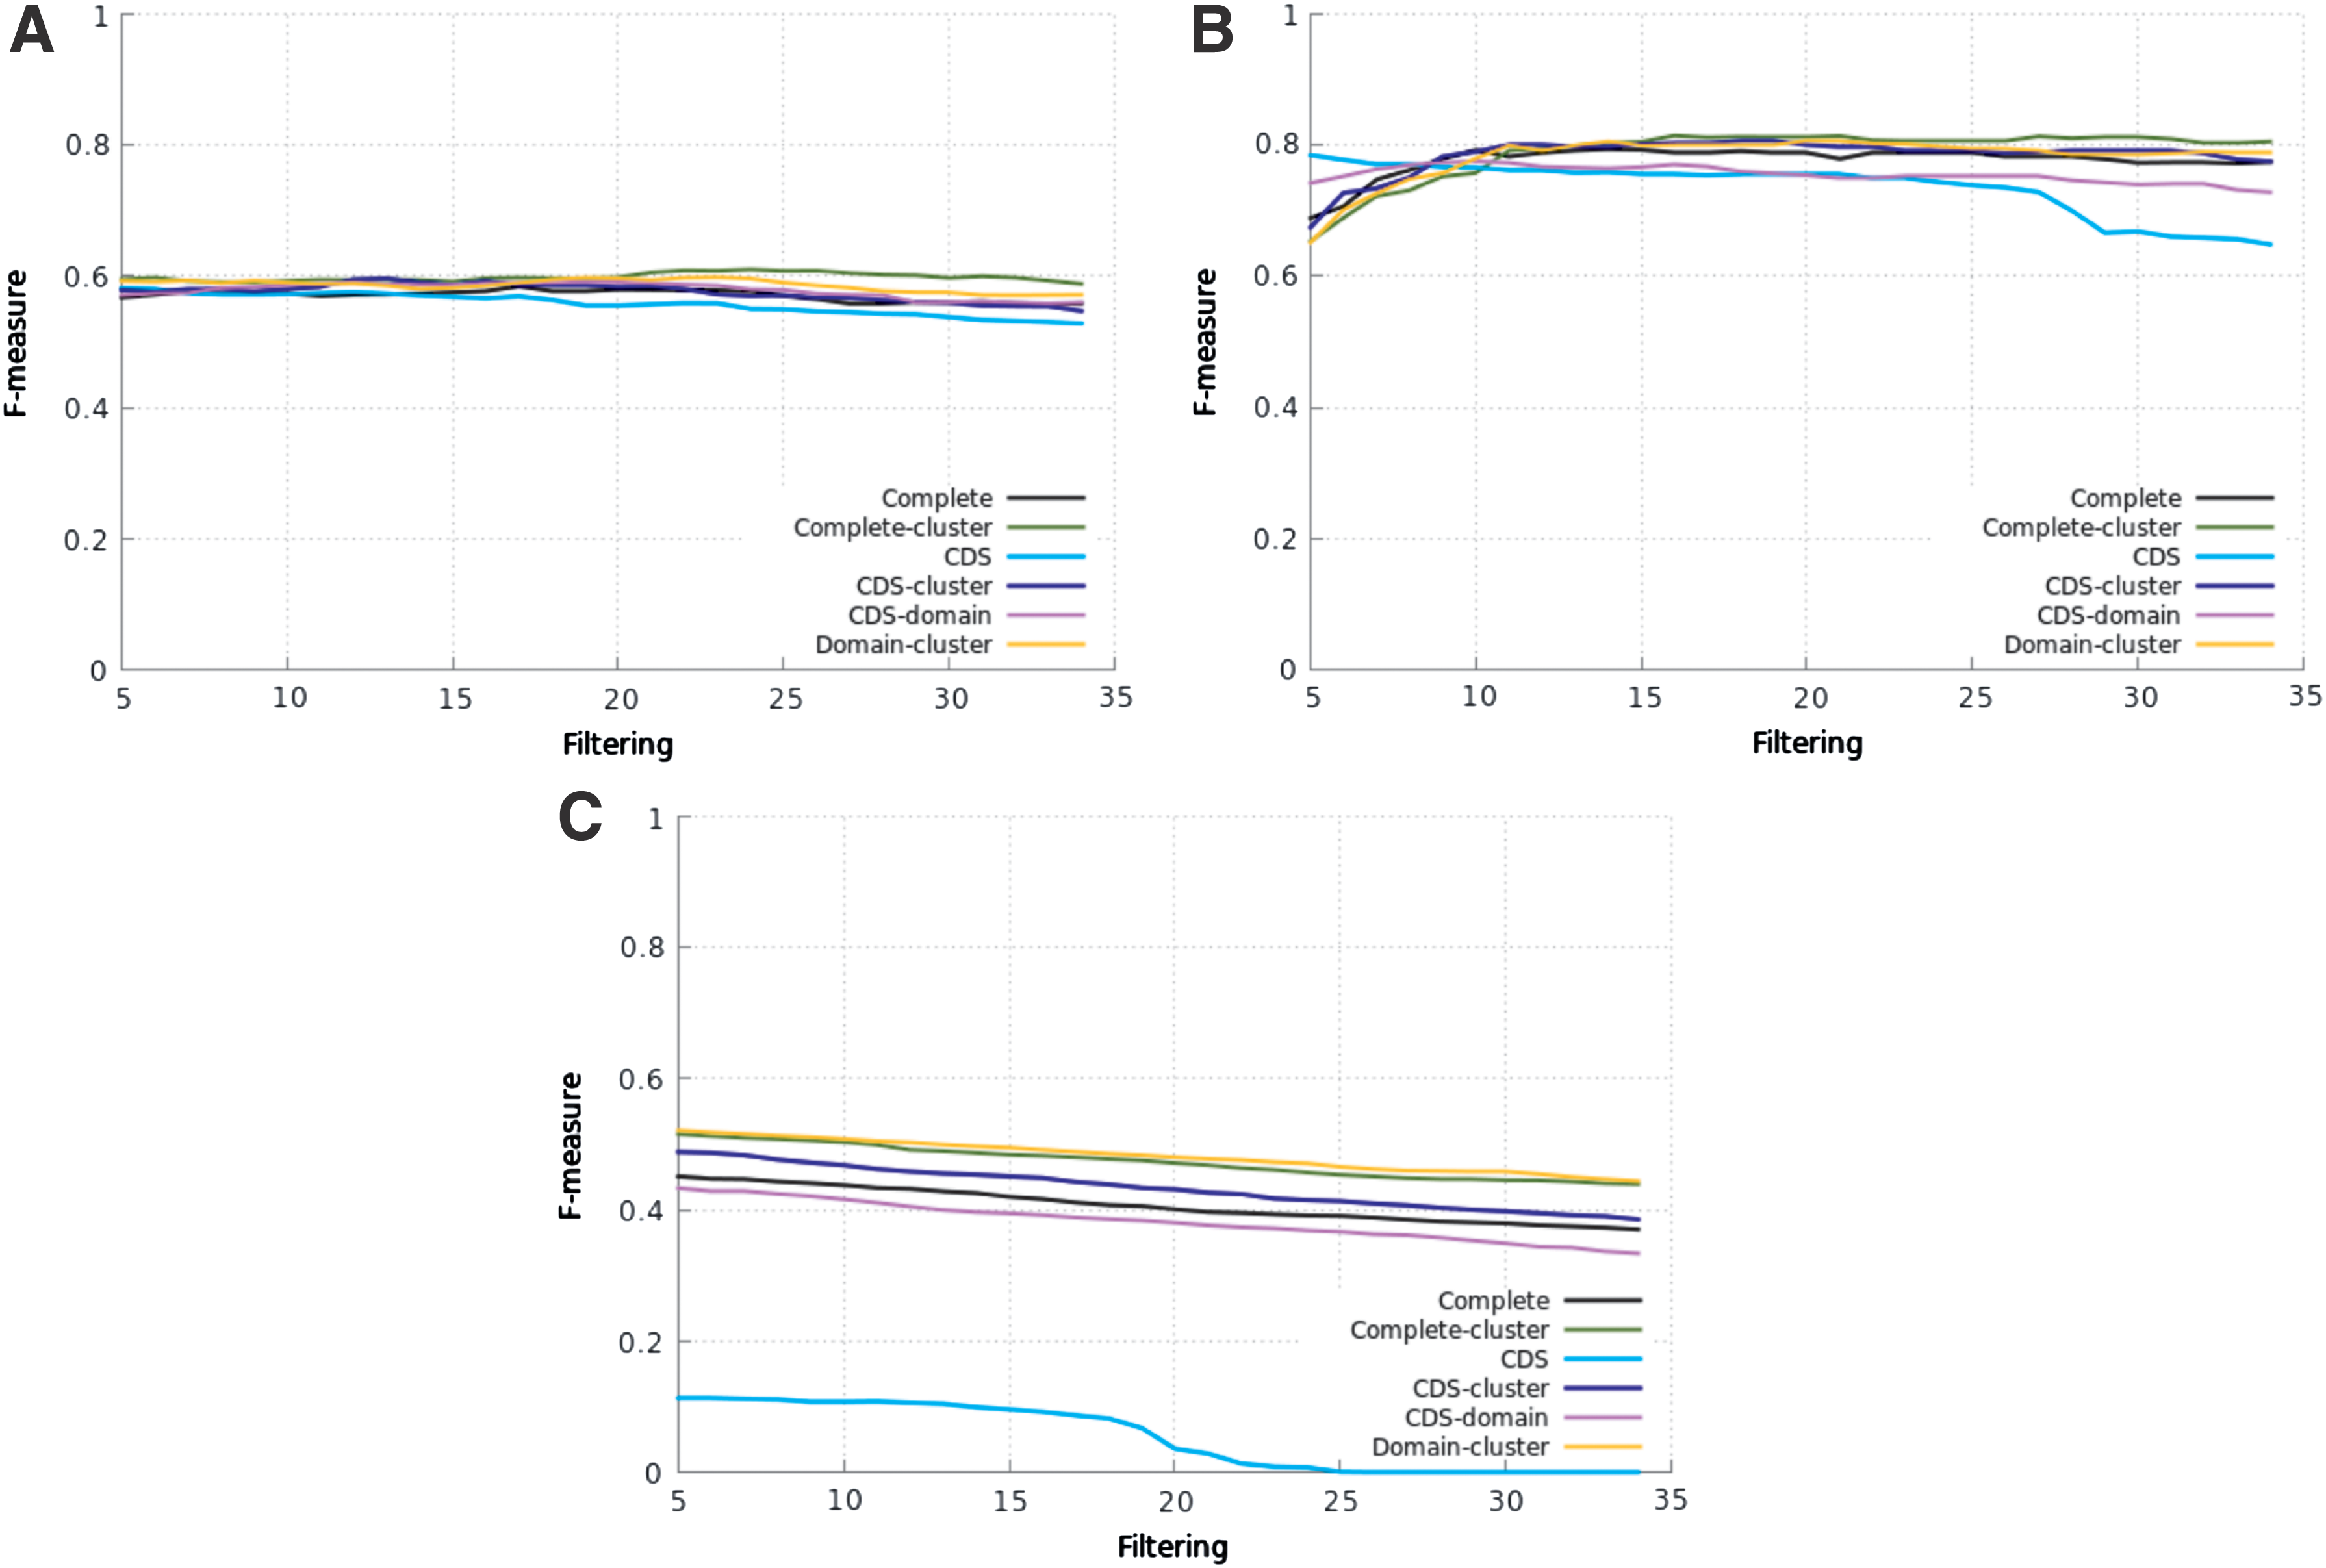
Filtering versus F-measure on D. melanogaster genome. Bel-PAO superfamily
Figure 3a, for Bel-PAO superfamily, shows that all pHMMs presented similar performances with small variations in the F-measure values for each protocol for all values of threshold. Complete-cluster, CDS-domain, and Domain-cluster (for most of the threshold values) were slightly better than Complete. The highest F-measures were obtained by Complete-cluster, as on Repbase test.
The results for the Copia superfamily (Fig. 3b) show that, for threshold of 1e-08 and below, the pHMMs of all protocols presented very similar performances (except the CDS protocol from 1e-27). The CDS-cluster (except for threshold from 1e-05 to 1e-08), Domain-cluster, and Complete-cluster protocols (for the latter ones, except from 1e-05 to 1e-10) performed slightly better than Complete. The Complete protocol only was (slightly) better than CDS and CDS-domain (for threshold lower than 1e-09). The Domain-cluster protocol produced the highest F-measure.
Confirming the results on Repbase tests, also for the D. melanogaster genome, the CDS protocol should not be used for the Gypsy superfamily (Fig. 3c). The other five protocols produced very close F-measure values for all thresholds. CDS-cluster and CDS-domain presented similar performances of the Complete protocol. Again, the highest F-measures were obtained by Complete-cluster and Domain-cluster, which were always better than Complete.
4. Discussion
The results obtained in both types of test show that, for each TE superfamily, at least two of the proposed protocols performed better (even though slightly better, in some cases) than the Complete one. Particularly in the case of Gypsy superfamily, four protocols produced better F-measures than Complete during Repbase tests for threshold below 1e-15 and three protocols were always better than Complete in D. melanogaster tests, for all levels of threshold.
Comparing Figure 3 with Figure 2, we can see that the line chart, related to a given superfamily, resulting from the tests with a real genome presents a shape (very) similar to the corresponding one of the Repbase tests. The difference between them is basically in the F-measure values that were lower ones in D. melanogaster tests. One reason for this is that not all TEs of the D. melanogaster genome were described in FlyBase, which increased the number of FP of all proposed protocols (details about these lower F-measures are presented in Observation 4, Supplementary Table S7, of the Supplementary Material). Misannotation also occurs in other sources of TE annotation that could be used to assess or compare methods aimed to identify and classify TE copies—Hoen et al. (2015) proposed the creation of benchmarks to help and facilitate those tasks. This problem can affect the correct evaluation of any method, as it happened in this study. However, regardless of possible fails, the TE annotation from FlyBase was good enough to show our intended purpose: to assess and compare the performances of all protocols in a real situation. Most importantly, these results suggest that the pHMMs of these protocols could perform in a real situation similarly as they performed on Repbase tests. Due to this, the observations for Bel-PAO, Copia, and Gypsy superfamilies described in both experiments are basically the same.
The test results also show that, in general, Complete-cluster, Domain-cluster, and Complete were the best protocols. Figure 4 presents the true positive and false positive rates for these protocols with and without filtering (the numbers of TP and FP are shown after the rate values).

True positive and false positive rates in Repbase tests, with no filtering and with some (the threshold values used for Bel-PAO, Copia, and DIRS are 1e-10, 1e-20, and 1e-20, respectively; in the case of Gypsy, for Complete, Complete-cluster, and Domain-cluster are 1e-05, 1e-20, and 1e-25, respectively). The number of annotated sequences for Bel-PAO, Copia, DIRS, and Gypsy is 800, 2,287, 183, and 3,867, respectively.
No superfamily had all its annotated sequences predicted correctly but DIRS. For DIRS, when no filtering is considered, the Complete-cluster and Domain-cluster protocols predicted all annotated sequences and Complete missed only two sequences. The problem was the very high number of FP. However, when some filtering is used in the results of DIRS, the number of FP decreases considerably with a slight decrease in the number of TP—in the example in Figure 4, the threshold of 1e-20 causes a decrease of at the most only seven in the number of TP but produces a sharp reduction in the number of FP for all protocols. A similar situation is observed for the other superfamilies.
It is also interesting to note that, in the case of Bel-PAO superfamily, for threshold of 1e-20 (Supplementary Table S3), the increase of missed sequences is no more than five for each protocol. For Copia, the usage of a threshold of 1e-20 makes the high recall values of all protocols decrease only slightly. In the case of Gypsy, with no filtering, Complete-cluster and Domain-cluster predicted correctly 214 and 231 sequences, respectively, more than Complete. On the other hand, the number of FP for Complete is already very low: 31 (another protocol, the CDS-domain, with no filtering, predicted 80 TP more than Complete, with only 36 FP; Supplementary Table S6). However, yet for Gypsy, if thresholds of 1e-20 and 1e-25 for Complete-cluster and Domain-cluster are used, the number of FP is significantly reduced, with a relatively small decrease in the number of TP—even with this (high) filtering, the two protocols predicted correctly more sequences than Complete without filtering (150 TP and 158 TP, respectively).
These remarks mean that the usage of some threshold, even though of a high value, for the three protocols in all superfamilies would reduce the number of FP and produce only a small decrease in the amount of TP compared with no filtering. At the same time, the use of a threshold, especially of low values, would give more reliability about the findings.
We applied the same threshold values considered above in the tests with D. melanogaster genome. Comparing the HMMs' predictions with the sequences annotated in FlyBase as “transposable elements,” we verified that, also for a real genome, the use of filtering can produce a significant reduction in the number of FP with only a small decrease in the number of TP. Figure 5 shows the true positive rate and the number of FP when no filtering and some are considered (the numbers of TP are shown after the rate value; with respect to the high number of FP after filtering the predictions, Observation 5, Supplementary Table S8, in the Supplementary Material presents details and other comparisons).
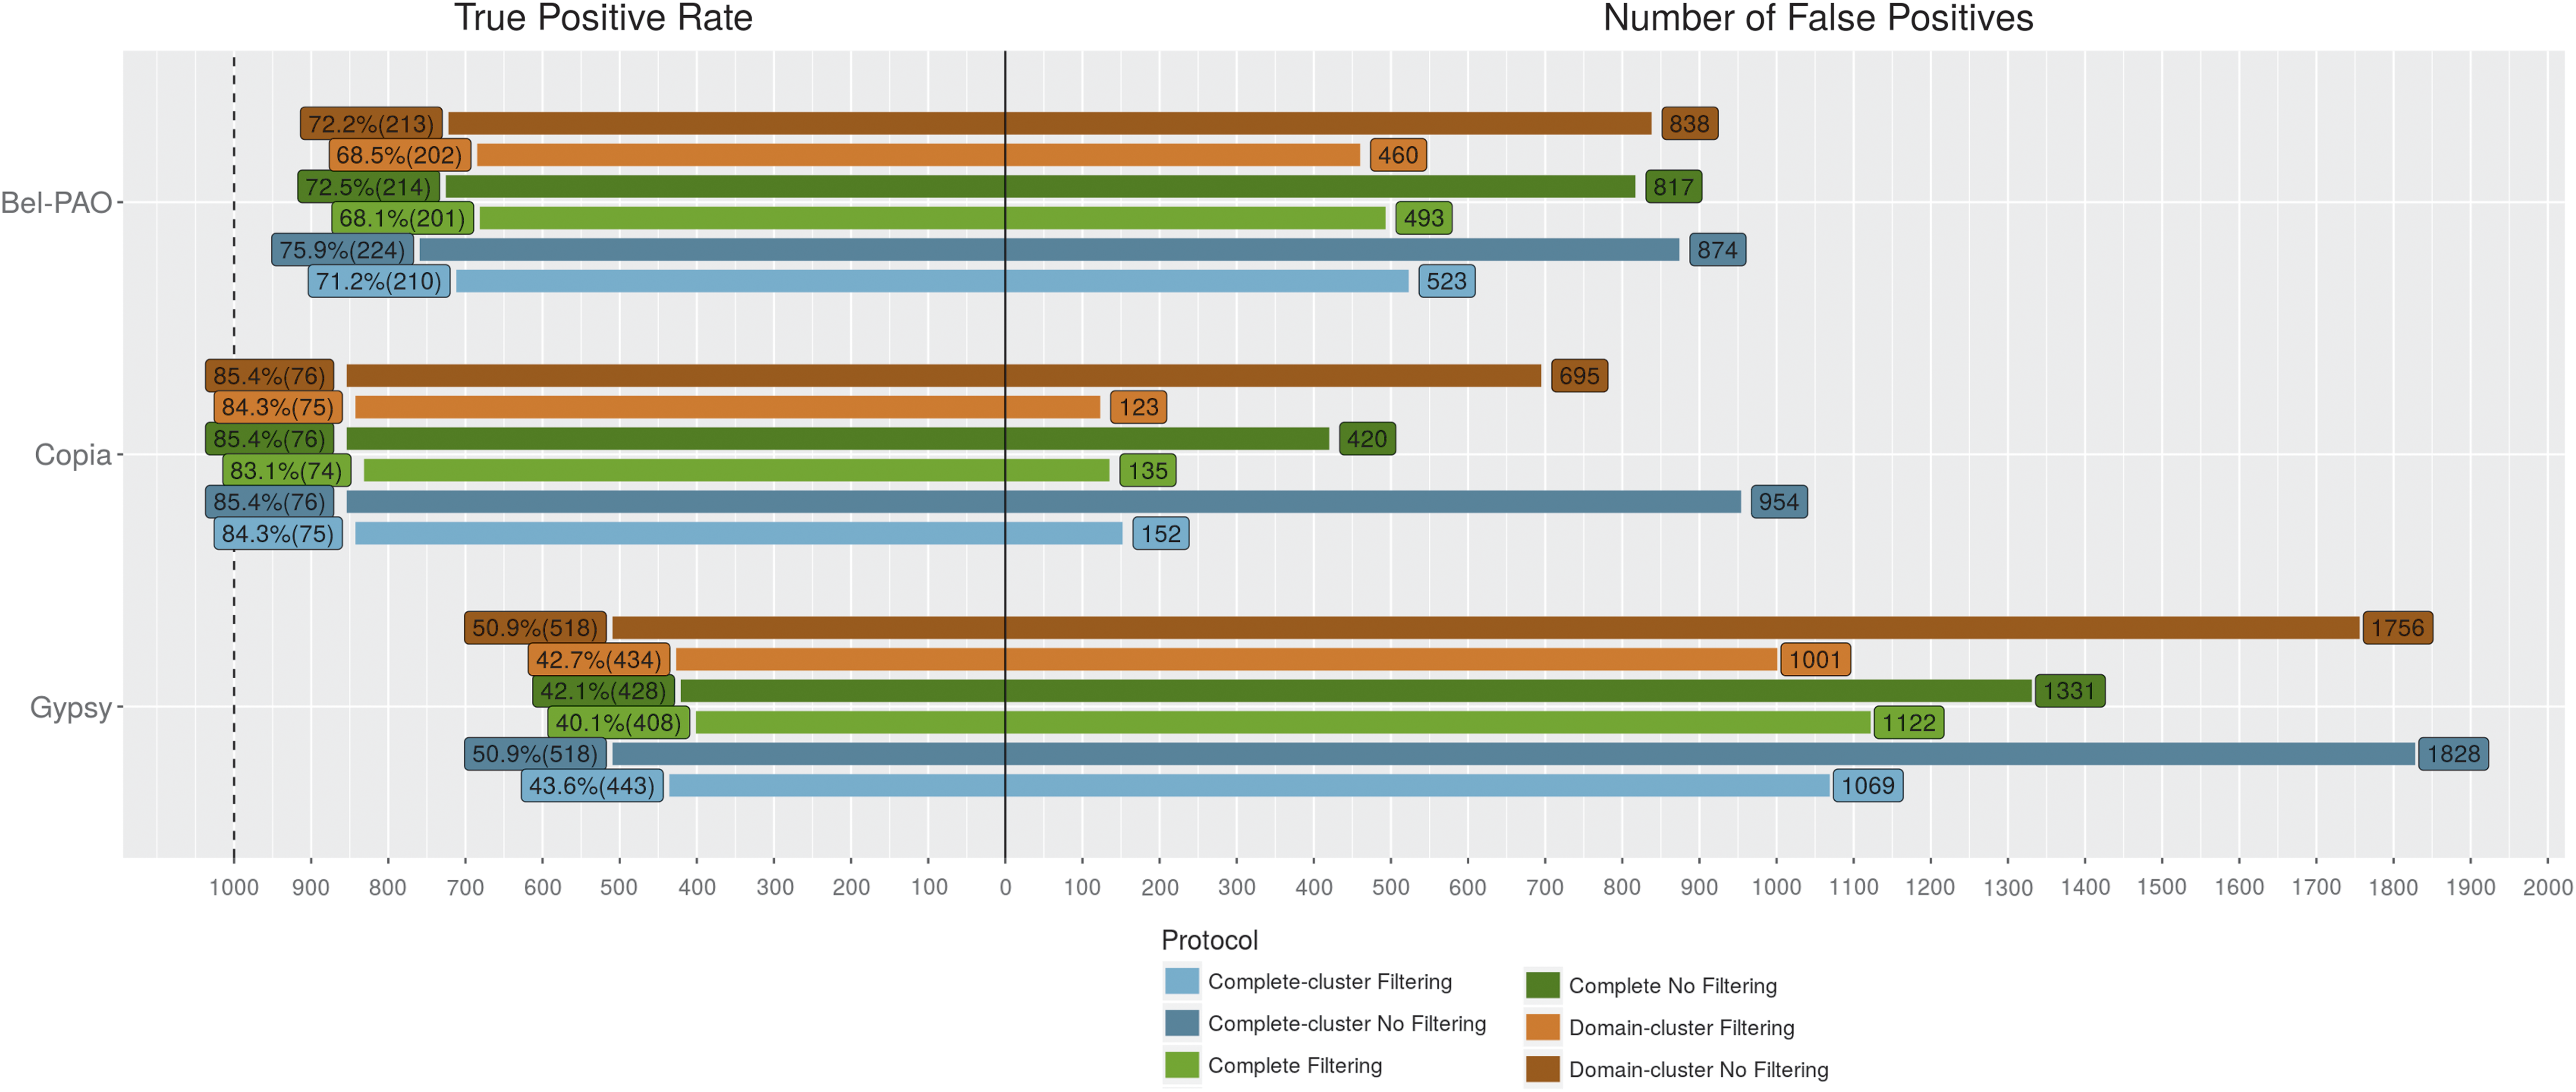
True positive rate and number of FP in D. melanogaster tests, with no filtering and with some (the threshold values used for Bel-PAO and Copia are 1e-10 and 1e-20; in the case of Gypsy, for Complete, Complete-cluster, and Domain-cluster are 1e-05, 1e-20, and 1e-25, respectively). The number of annotated sequences for Bel-PAO, Copia, and Gypsy is 295, 89, and 1017, respectively. FP, false positive.
In the tests with Repbase, the Complete protocol missed some annotated sequences predicted by at least one of the other protocols (Complete also identified some sequences not predicted by the others)—examples of these cases are shown in Supplementary Table S9 (in some cases, the sequences were predicted with long lengths and/or very low e-values, lower than 1e-100). This table also shows that, for Bel-PAO and DIRS superfamilies, the numbers of sequences missed by Complete but predicted by another protocol are negligible (3 and 2, respectively). However, these numbers are significant for Copia and, especially, for Gypsy: 32 and 241 sequences, respectively. These numbers show a relevant fact: the number of correct predictions obtained with the usage of the conventional protocol could be improved by considering together the predictions of one or more of the other protocols. To verify this, we also compared the pHMMs' predictions with the annotation of Repbase considering (1) all protocols together (including the Complete one) and (2) only the three best protocols (Complete, Complete-cluster, and Domain-cluster), for several threshold values. These results are shown in Supplementary Tables S3–S6 of the Observation 3 in the Supplementary Material, allowing to compare them with results produced by the Complete protocol alone.
To verify this situation considering a real genome, we repeated these new types of comparison for the pHMMs' predictions of the tests with D. melanogaster, obtaining the same conclusion as above (examples of variations in the numbers of FN and FP are shown in Supplementary Tables S10 and S11 of the Observation 7 of the Supplementary Material).
For the selection of the predictions of a pHMM, the usage of a threshold of high value (or even no filtering) would provide the greatest number of selected sequences, including possibly distant homologue copies of TEs. However, this procedure may increase considerably the number of false positive predictions (FP). Using lower threshold values would reduce the number of FP but increase the number of missed sequences. The best trade-off of particular interest could be obtained by observing the figures and tables presented in this study aiming to specify the best filtering according to the superfamily and protocol.
It is worth mentioning that in this work we used Repbase database; however, other sources of TE sequences could be used to learn the pHMMs of these protocols.
5. Conclusion
In this study, we present five alternative ways, other than the conventional one, to obtain the sets of representative sequences of retrotransposon TEs to be used to learn pHMMs aimed to search for these elements. From these six protocols, the Complete and Complete-cluster ones would be able to predict all types of retrotransposons, complete or not, including elements with no CDS [such as LARD (Kalendar et al., 2004) and TRIM (Witte et al., 2001)]; the other four protocols would be more specifically aimed to identify TEs that would maintain coding regions.
Although the Complete protocol is the more direct and easier one to be used, we showed that, for each TE superfamily, at least two of the alternative protocols can perform better than the conventional one, in special, Complete-cluster and Domain-cluster protocols—the additional work for the Complete-cluster protocol, for example, consists basically in running a program to cluster the initial set of TE representative sequences and generate the corresponding pHMMs, one for each formed cluster—but this would be done only once, in the creation of the pHMMs. Our results also show that the Complete protocol may miss part of the TE sequences of a genome, which might be predicted by other protocols, especially for the Gypsy superfamily. For this reason, we suggest a combination of the results of the Complete protocol with the results of one or more of the other protocols to improve the number of correct predictions.
For the ones interested in using some of these protocols, we provide the pHMMs of them and also Perl scripts to treat all their results (Observation 8 in the Supplementary Material).
Footnotes
Acknowledgments
The authors thank Claudia M.A. Carareto for advice on transposable elements and Olga G. Fischer for her comments and suggestions. This study was supported by the São Paulo Research Foundation-FAPESP (Grant Nos. 2012/24774-2 to C.N.F., 2012/22205-0 to V.A.C., and 2011/00428-5 to V.H.B.)
Author Disclosure Statement
No competing financial interests exist.
References
Supplementary Material
Please find the following supplemental material available below.
For Open Access articles published under a Creative Commons License, all supplemental material carries the same license as the article it is associated with.
For non-Open Access articles published, all supplemental material carries a non-exclusive license, and permission requests for re-use of supplemental material or any part of supplemental material shall be sent directly to the copyright owner as specified in the copyright notice associated with the article.