
Abstract
Abstract
The identification of transcription factor binding sites (TFBSs) is a problem for which computational methods offer great hope. Thus far, the expectation maximization (EM) technique has been successfully utilized in finding TFBSs in DNA sequences, but inappropriate initialization of EM has yielded poor performance or running time scalability under a given data set. In this study, we used a sequential integration approach that defined the final solution as the set of solutions acquired from solving objectives in a cascade manner to integrate the fuzzy C-means and the EM approaches to DNA motif discovery. The new method is explained in detail and tested on the chromatin immunoprecipitation sequencing (ChIP-seq) data sets for different transcription factors (TFs) with various motif patterns. The proposed algorithm also suggests an efficient process for analyzing motif similarity to known motifs as well as finding a target motif. A comparison of results with those of the well-known motif-finding tool, MEME-ChIP, shows the advantages of our proposed framework over this existing tool. Experimental results show that we were able to find the true motifs for all TFs, and that the motifs found by our proposed algorithm were more similar to JASPAR-known motifs for the STAT1, GATA1, and JUN TFs than those found by MEME-ChIP.
1. Introduction
T
The problem of de novo identification of TFBSs has been widely studied, and motif discovery algorithms have been categorized as either search based or probabilistic. Search-based algorithms infer motifs as consensus sequences, while algorithms based on probability infer motifs through position frequency matrices (PFMs), which specify the frequency of nucleotides for each position in the binding site. While the search-based methods are appropriate for finding short motifs, PFMs provide more information on the TF's binding specificity (Das and Dai, 2007). Bailey and Elkan (1994) presented a probabilistic motif discovery program (MEME) that uses the expectation maximization (EM) technique to infer PFMs. It uses a probabilistic model of the input data set and selects parameter values for the model that maximize the likelihood value. Since its initial introduction in 1994, it has gone through several versions.
The MEME-ChIP tool (Machanick and Bailey, 2011), which is built to analyze ChIP-seq peak regions, attempts to utilize MEME and DREME as two motif discovery algorithms and compare the results with a database of known TF motifs using the TOMTOM (Gupta et al., 2007) algorithm. MEME scales poorly with large data sets, and DREME is able to detect only very short motifs as a search-based algorithm. EXTREME (Quang and Xie, 2014) is also one of the latest versions that uses an online EM algorithm to improve MEME's performance in dealing with large data sets. EXTREME can discover motifs in a practical amount of time without discarding any sequences that could be a benefit for infrequent motif discovery. Recently, Ibrikci and Karabulut (2010) proposed fuzzy C-means (FCM) for motif discovery and tested their algorithm against DNA sequences extracted from the genome of Saccharomyces cerevisiae and Escherichia coli.
Today, with the development of new techniques and algorithms, new approaches to making algorithms, such as integrating existing algorithms, have become more popular. The global objective and sequential approach are the two frameworks exploiting existing integration approaches. In the global objective approach, a single global objective is defined using a combination of multiple objectives, and then the solution is defined as an equilibrium point of the single objective (Gennert and Yuille, 1988). However, sometimes merging the different objectives into a global objective and computing the actual weights are hard to achieve, problematic, or computationally expensive. In the sequential approach (Xi and Fenton, 1993), the final solution is defined as the set of solutions acquired from solving the objectives in a cascade manner. In this way, each module is permitted to influence other modules and take advantage of the benefits of each module, which means a multiple-objectives problem is transformed into a stage-wise single-objective problem.
The rationale behind the fuzzy clustering lies in the reality that an object or data point could be assigned to different classes by degree of membership (Asyali and Alci, 2004). On the contrary, it has been demonstrated that initializing the parameters of EM with different values has a significant effect on performance (Chen, 2006). In this article, the sequential integration of fuzzy clustering and EM techniques (SIFEM) has been proposed as a de novo motif discovery algorithm. SIFEM identifies novel sequence patterns (motifs) in the ChIP-seq regions that may represent direct or indirect TFBSs. We utilize a thorough quantitative methodology to examine the potential values and limitations of the proposed method. In motif enrichment analysis, we consider both standard and central enrichments of discovered motifs for finding the direct DNA-binding affinity of the ChIP-ed TF, and in motif identification we compare the ab initio motifs to known TF binding motifs as well. As a result, our algorithm is tested with five different ChIP-seq experiment data sets and had some improvements over the previous existing work. The source codes along with some ChIP-seq data used in this study can be found in the Supplementary Material.
2. Methodology
FCM and EM are the most popular clustering algorithms for solving several problems in computational biology (Do and Batzoglou, 2008; Jin and Wang, 2009). Both methods include iterative steps repeated until a satisfactory objective is reached. In FCM, a membership value for each input is first calculated, and then, the center of each cluster with the given vectors is updated by using the membership values as weighting factors in the next step. Likewise, the EM technique iteratively improves the parameters in the E-step and M-step. A sequential integration method is proposed here to take advantage of the benefits of both methods, casting motif identification as a stage-wise single-objective problem. Let Y = (Y1, Y2,…,YN) denote the data set of ChIP-seq peaks, where N is the number of sequences in the data set. The proposed method divides the data set into n (overlapping) subsequences of length W, then converts each subsequence to a W × 4 binary array.
We refer to this new data set X = (X1, X2,…,Xn) as the input vectors, and c = {1,…,C′} represents the cluster centers. The membership of each input Xn to each cluster C′ in (t + 1)th iteration is given in Equation (1), and can be considered the posterior probability by adding the following constraint on the total membership values of an individual input vector (Asyali and Alci, 2004):
where dij corresponds to the distance between the input and the cluster center, and q denotes the fuzziness value. In this problem, dissimilarity between the DNA subsequences and position probability matrices (PPMs) is given as follows:
and
where ωj,s,k is probability of nucleotide k at position s of cluster j in the PPM. Once the membership matrix has been constructed, the PPMs can be updated according to Equation (3). Ibrikci and Karabulut (2010) updated each cluster center with a selected group of subsequences by selecting some elements from the membership matrix using a certain threshold rather than with all the subsequences, resulting in better predictive performance. Thus, the function Sel(xi) is utilized in updating the cluster centers:
where B stands for the number of top subsequences to be considered and top(Z,B) shows a subset of the first B samples of Z. In this algorithm, ξ and γ are iteratively improved until the change (Euclidean distance) in ξij falls below a threshold (δ = 10−6) or reaches the maximum number of iterations (t1 = 100).
In the next step, the expected number of times nucleotide k appears at position s in cluster j is calculated, and then, the position probability matrix elements are updated as follows:
where βk are pseudocounts to prevent any nucleotide frequency fj,s,k from becoming 0. After calculating the PPMs, the membership values with θj = (fj,1,fj,2,…,fj,W) are updated.
where λj parameterizes the probability that any subsequence with the length of W is generated by the PPM of jth cluster.
SIFEM iteratively minimizes the following energy function, E, which sequentially integrates the objective functions for both FCM and EM. The above parameters are iteratively improved until
where t ε T = {1,2,…,t1} and t ε T′ = {t1, t1 + 1,…, t2} for the first and second summation. Moreover, ‖T ∩ T′‖ = 1 and ‖.‖ denotes the cardinality. The first and second terms are minimizing the total dissimilarity and log likelihood as the objective functions for FCM and EM, respectively. Table 1 shows the complete scheme of the algorithm.
PPM, position probability matrix.
In conclusion, the procedure and parameters for SIFEM can be summarized in the following steps. First, the number of clusters (C′ = 10), membership values (ξ), and pattern length (W, with the values shown in Table 2) are initialized. Then, for each subsequence Xi (i = 1,…, n), the algorithm calculates the membership values (ξij, j = 1,…, C′) with the specified fuzziness value (q = 2) and allows the inputs to be a member of any class with a certain possibility or “degree of membership,” a value between 0 and 1. In the next step, PPMs (γj) are updated with a selected group of subsequences based on a certain threshold. Performance improvements were seen by choosing a value of 350 for parameter K that was close to the number of TFBS instances residing within the data sets used in this study. Finally, the PPM elements for each cluster, fj,s,k, and the probability of each cluster, (λj), are updated, and the above process repeated until the termination criteria are met.
3. Results
3.1. Experimental setup
We used five TF ChIP-seq experiments from the ENCODE project (Consortium, 2012) to benchmark the performance of our model. The ChIP-Seq data included analyses of STAT1, GATA1, JUN, NFYA, and REST performed on the K562 cell line, and peaks were already called and organized into BED files. The details of the data sets used for this study are given in Table 2. The motifs are detected as simple or complex patterns that include short or long motifs with highly or slightly conserved cores (Das and Dai, 2007). Therefore, the selection of motif patterns from a variety of TF families of different lengths within data sets of different sizes allows us to measure the performance of the proposed algorithm. We processed the data using the 101 bp sequences centered at the point source called for each ChIP-seq peak and using shuffled sequences with matching dinucleotide composition as the background set. This is the same data preprocessing procedure used in most motif discovery work (Quang and Xie, 2014; Alipanahi et al., 2015).
3.2. Comparison methodologies
As MEME-ChIP is one of the most popular packages used to analyze ChIP-seq “peak regions” for evaluation in recent motif discovery studies (Weirauch et al., 2013), we exploited it for the evaluation and comparison of our results. It has been a valuable tool still in use for the ongoing challenge of identifying regulatory elements and runs two complementary motif discovery algorithms on the input data: MEME and DREME. In this article, both quantitative and visual measures are utilized for result evaluation and comparison. p Values are used as quantitative measures to show PPM enrichment and similarity. Moreover, sequence logo and Two Sample Logo are also two visual measures analyzed in this section for evaluation of results.
In SIFEM, we trim positions for each discovered motif that show low levels of probability in the start and end of the PPM before calculating its p value. The p values are calculated using the AME package from the MEME-suite (Bailey et al., 2009). This motif enrichment significance measure is the number of motifs with the same width and number of occurrences that could have generated an equal or higher log likelihood ratio if the data set had been generated according to the background model. The usual way is to assume the binding affinity of the most highly “enriched” motif as the direct DNA-binding affinity of the ChIP-ed TF (Bailey and Elkan, 1994; Quang and Xie, 2014); this can be problematic in some cases, including instances of poor ChIP-seq data quality due to poor antibody performance or sample preparation issues, as well as highly enriched cofactor binding sites. ChIP-seq data sets are known to contain binding sites for unrelated TFs (Teytelman et al., 2013). Our main criterion for choosing a ChIP-based model was that its motif detectors should respond to binding sites for the TF of interest, and not respond to binding sites for unrelated or cofactor TFs. To deal with this challenge, we also used the central motif enrichment analysis package, CentriMo (Bailey and Machanick, 2012), to consider all discovered motifs and find candidates for the direct ChIP-ed TF binding motif.
Figure 1 shows the comparison results between both measures for motif enrichment. When we applied AME (McLeay and Bailey, 2010) to the (100 bp) STAT1 and REST ChIP-seq regions, the consensus sequence of the motifs found by SIFEM, HASTTTCRKTTYCYB and GCTGTCCAWGGTGCTGAA, respectively, rank second in terms of enrichment among the discovered motifs (Fig. 1a, e). However, GCTGTCCAWGGTGCTGAA has a worse central enrichment p value (4.2e-291) than the other motifs discovered by SIFEM in the REST ChIP-seq regions; it has a unimodal curve with a narrower region of maximum central enrichment (w = 36 bp). Moreover, it achieves a higher maximum site probability in the center of the ChIP-seq regions. In Figure 1d, the width of the region of maximum enrichment (w = 202) is quite large, suggesting that the resolution of the ChIP-seq peaks is not as good as in typical ChIP-seq experiments. In addition, the relative number of ChIP-seq regions containing the discovered motif is also rather small (1045/7647 = 13.6%), possibly due to an imperfect motif, indirect binding of NFYA to DNA, low ChIP antibody specificity, or other experimental issues.
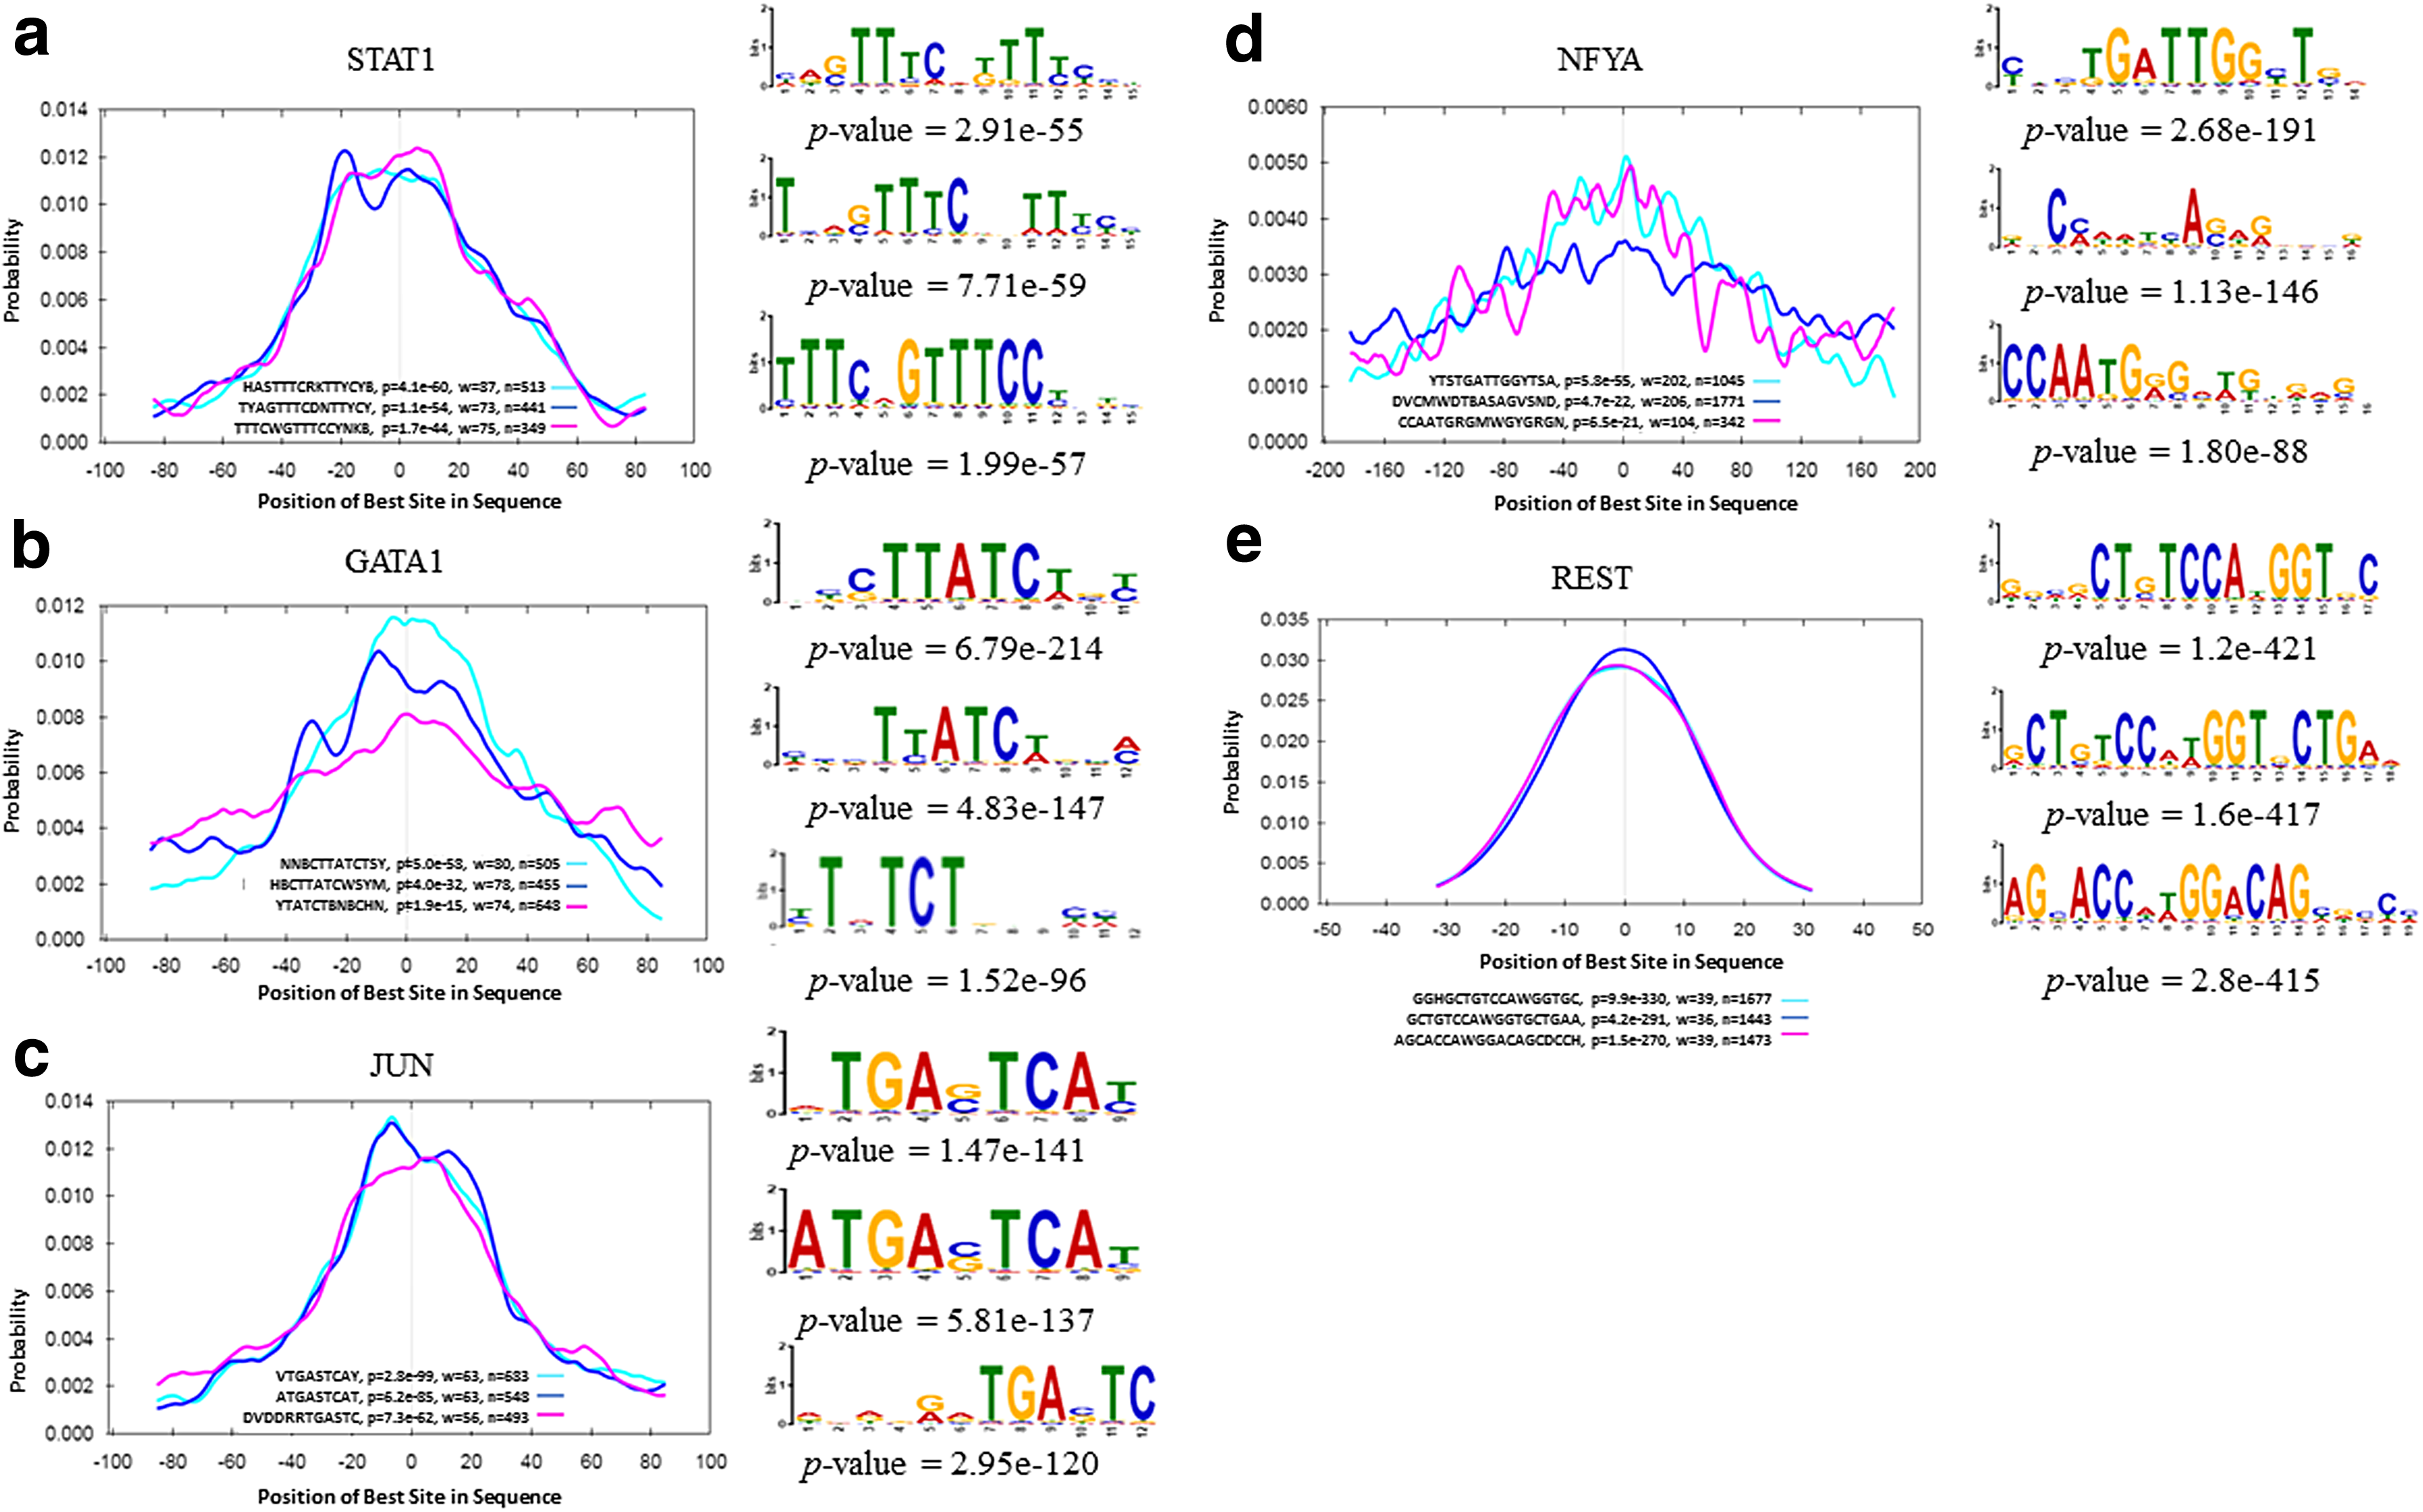
Comparison of central enrichment and TFBS enrichment results for ChIP-seq of five TFs. On the left is the distribution of the best predicted sites for the three most centrally enriched motifs discovered by SIFEM. Each curve shows the density (averaged over bins of 20-bp width) of the best strong site for the named motif at each position in the ChIP-seq peak regions. The legend shows the consensus, its central enrichment p value, the width of the most enriched central region (w), and the number of peaks that contain a motif site. On the right are the sequence logos and enrichment p values for the binding sites. ChIP-seq, chromatin immunoprecipitation sequencing; TF, transcription factor; TFBS, transcription factor binding site.
SIFEM identified several discriminative motifs for each TF, which provide new insights regarding cofactors of STAT1 and JUN. As shown in Figure 2, the found consensus sequences TTTCWGTTTCCYNKB and ATGASTCAT closely match the PPM for IRF1 and NFE2, respectively. This can be also seen in a study by Lehtonen et al. (1997) that characterized the expression of STAT and IFN regulatory factor (IRF) family TFs in primary human blood mononuclear cells, and in a study by Zhang et al. (2006) that concluded hyperactivation of IRF-1 and elevated STAT1 dimer formation may be two general switches that contribute to a much more robust antiviral symphony against virus replication when type I and type II IFNs are coadministered.
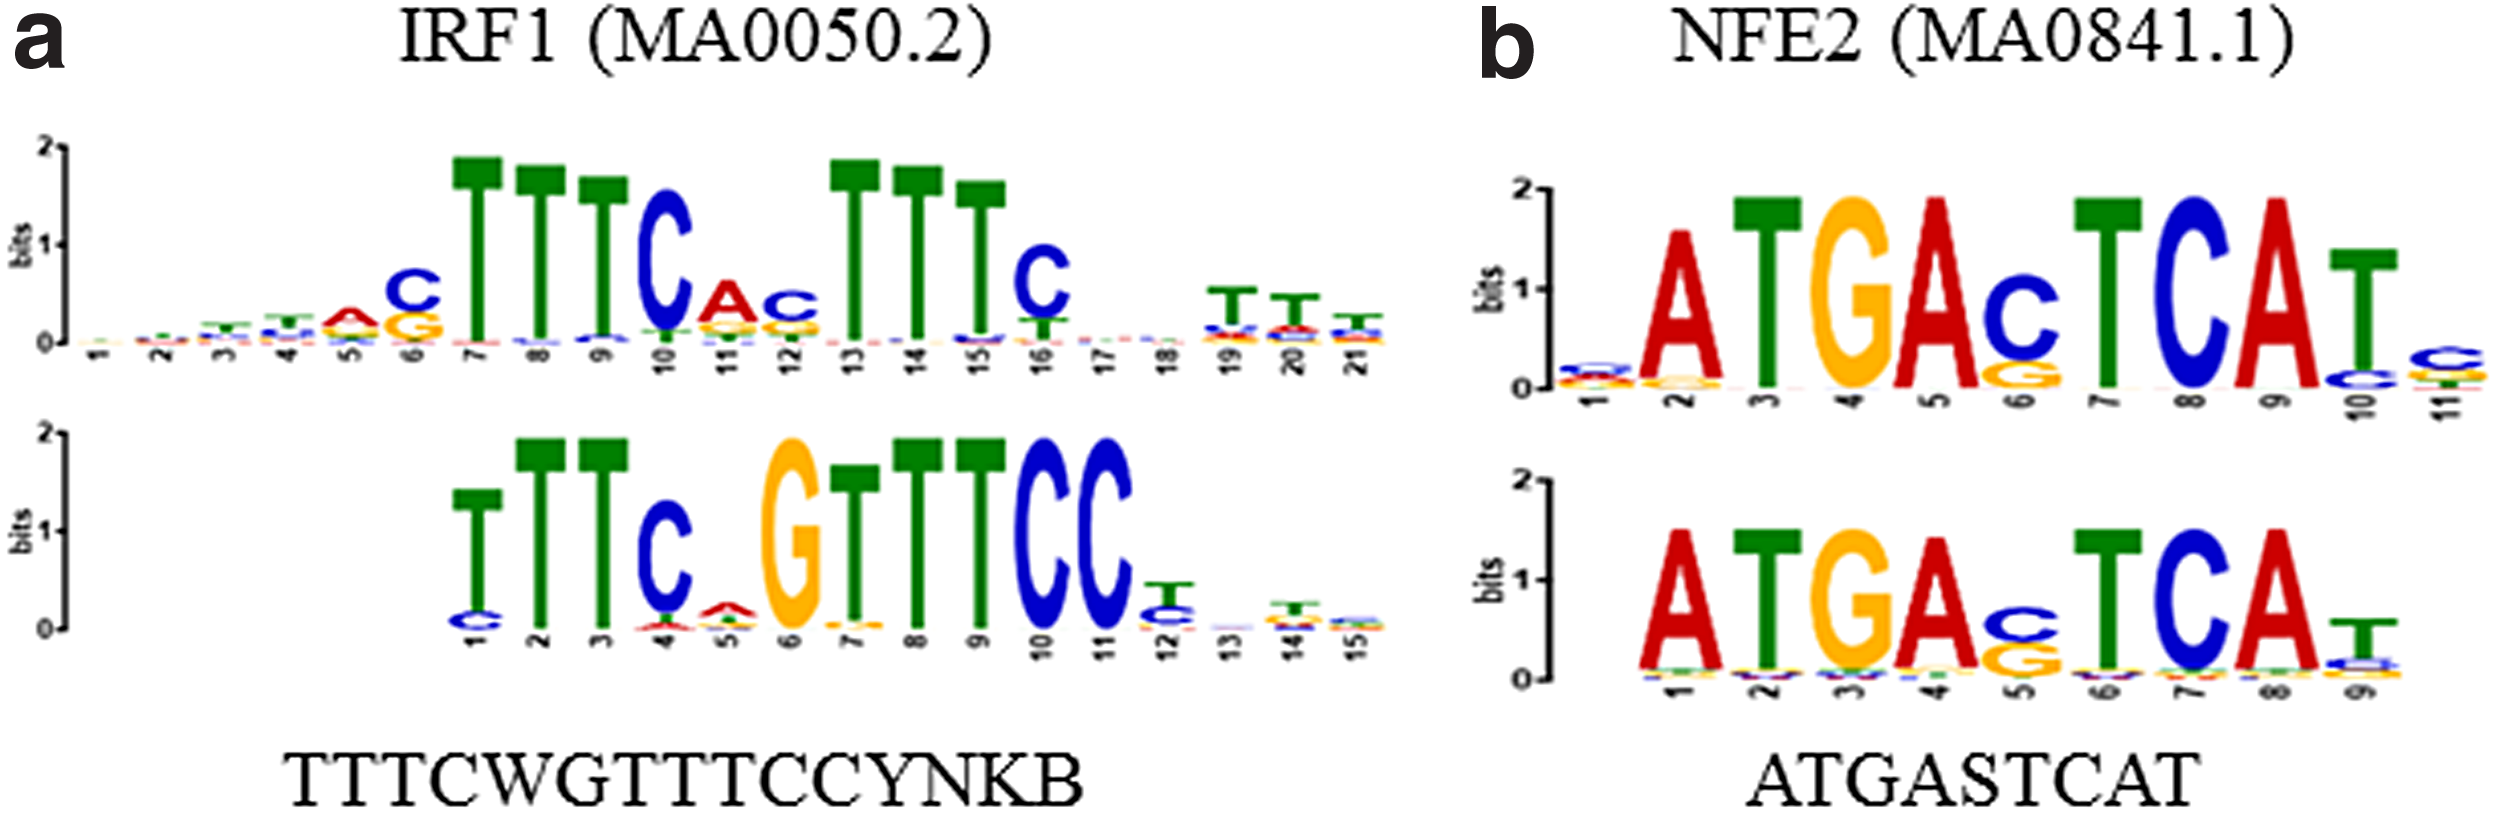
Unrelated or cofactor TF motifs identified by SIFEM. Bottom: motifs found by SIFEM. Top: matched motifs in JASPAR.
The motifs in the JASPAR database were used as a reference to benchmark the model performance. The similarity of the discovered motifs in the ChIP-Seq data sets to known motifs was assessed using the TOMTOM package from the MEME suite (Bailey et al., 2009). Table 3 presents E values, measures of similarity between the discovered and known motifs, where lower E values representing more similar results were found for STAT1, GATA1, and JUN in the proposed model. Moreover, simultaneously finding more TFBSs and also more similar motifs to the reference for JUN and STAT1 shows the superiority of our model in discovering more TFBSs than MEME-ChIP did. In addition to the quantitative evaluation of the proposed method, the sequence logos used for visualization were generated. In the sequence logos, the relatively large letters are the core components of the sought pattern, whereas positions with no distinguished letter indicate that there is ambiguity and any nucleotide can take this specific position. Figure 3 shows the alignments of each direct ChIP-ed TF binding motif to known motifs chosen based on central motif enrichment using TOMTOM. The sequence logos in Figure 3 also prove the proficiency of SIFEM in finding the target motif patterns, since the logos produced by this method closely resemble those of the known motif patterns.
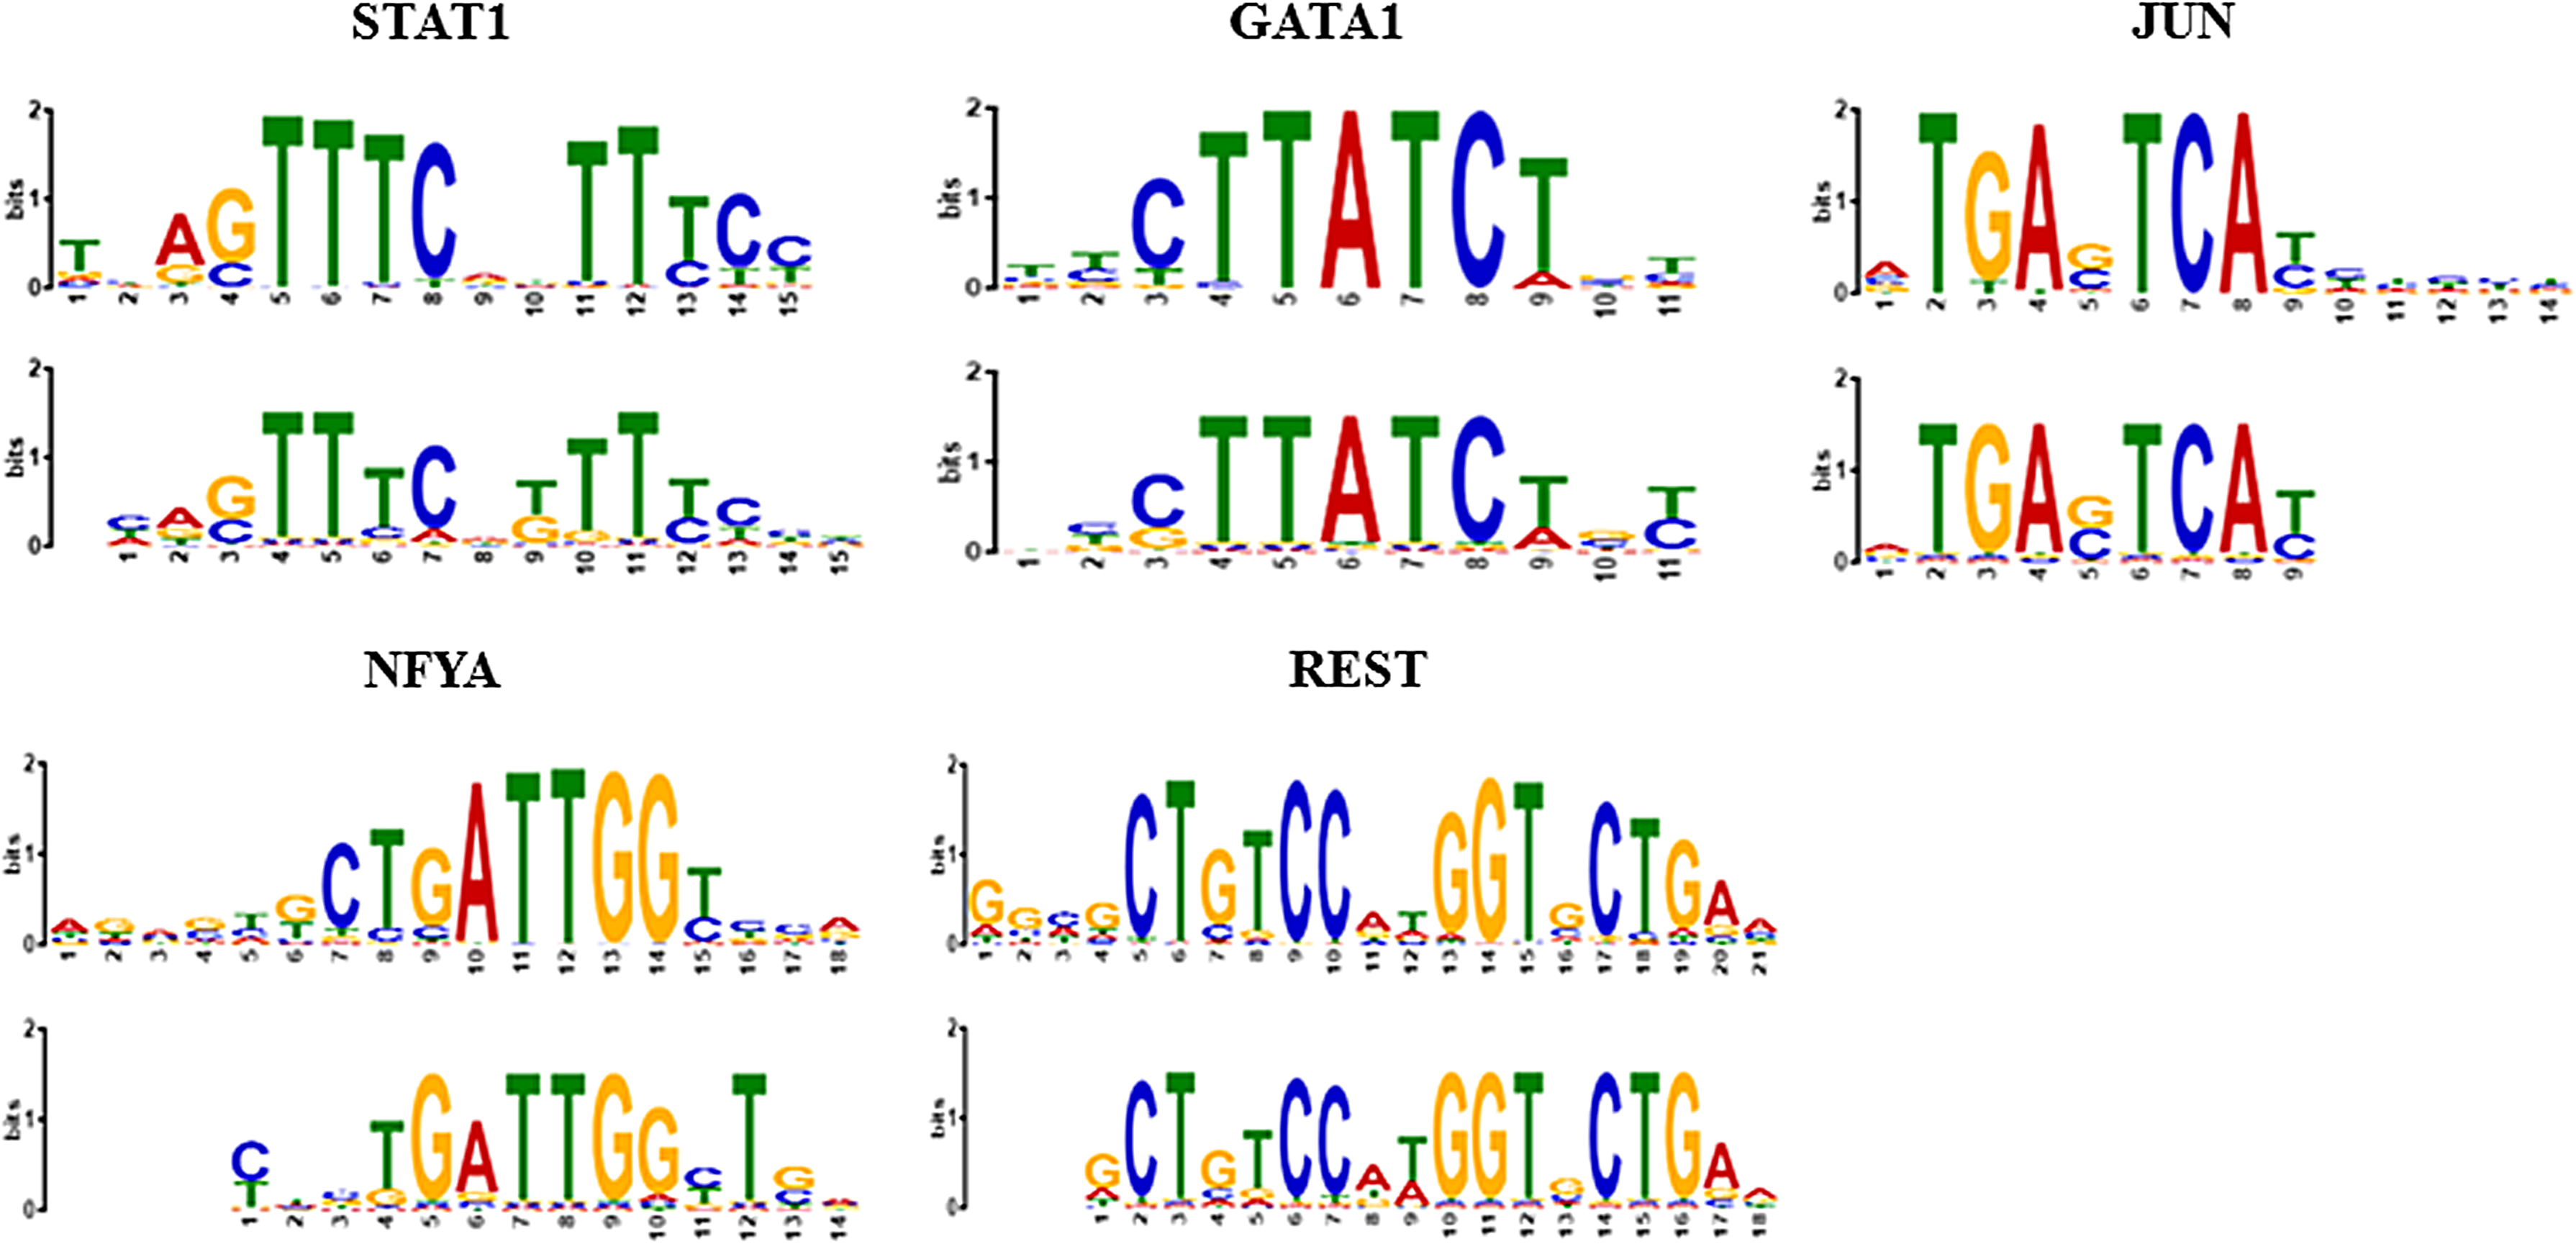
Comparison of motifs proposed by SIFEM (bottom) versus JASPAR (top) for five different TFs. Motifs are shown as information content in bits.
Moreover, the motifs discovered by SIFEM for STAT1 and REST have highly significant matches to known motifs in JASPAR. Two Sample Logo (Vacic et al., 2006) is another interesting visualization tool that can concisely show the salient differences between two aligned motifs. In this study, the Two Sample Logo was constructed to present the sequence characteristics of the discovered TFBSs in SIFEM versus MEME-ChIP. As can be seen in Figure 3, there is no significant difference in the highly enriched positions and most differences are in the noninformative positions. In STAT1, we observed that the enriched residues were G and T (position 9 in Fig. 3a), while A and C were depleted. The third position of the GATA1 TFBSs enriches G and C, while T is depleted in this position. Other detailed features are presented in Figure 4.
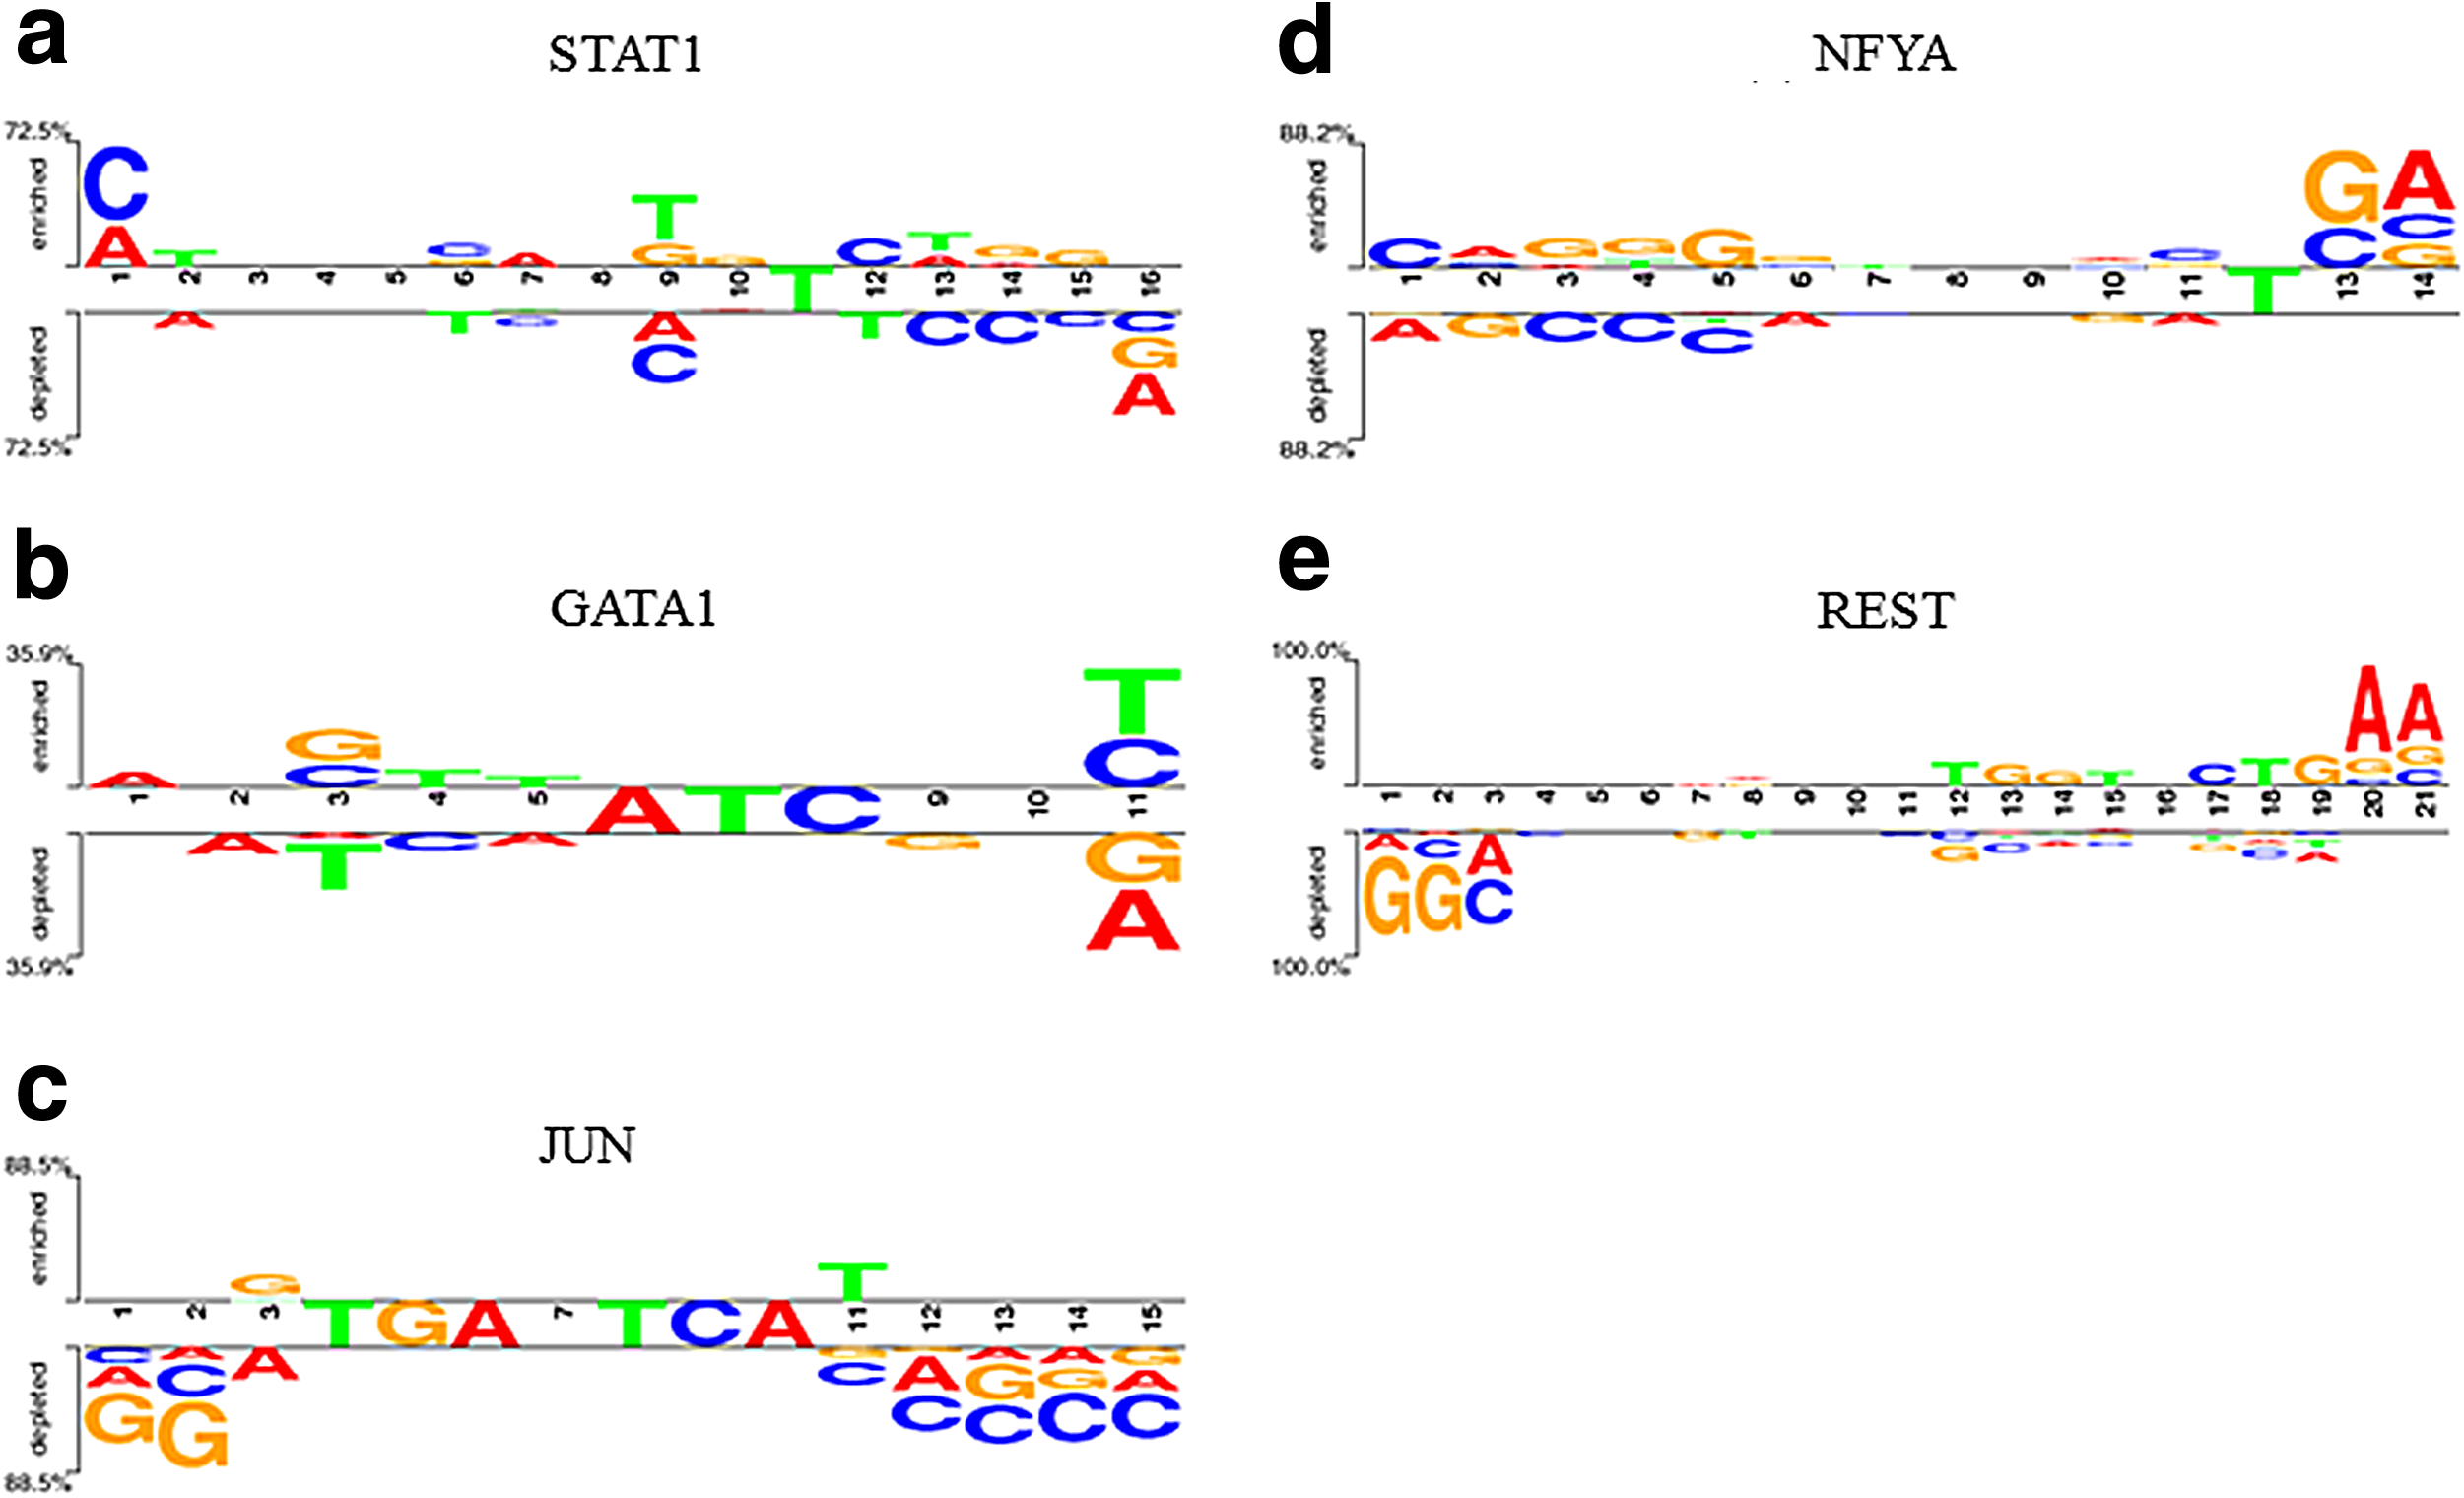
Two Sample Logo for motifs proposed by SIFEM and MEME-ChIP for five different TFs. The upper and lower sections display sets of symbols that are enriched or depleted, respectively, in the proposed motif, and the middle section displays consensus symbols.
The overlap and bold values indicate the number of overlapping positions between the discovered motif and reference alignment and the best E value for a single TF, respectively.
4. Discussion
In this article, we have proposed SIFEM a new clustering method for finding motifs that infers the motif as a PPM and relies on the overrepresentation of motif instances within the DNA sequence. Unlike current motif discovery algorithms (Alipanahi et al., 2015; Zeng et al., 2016), SIFEM does not require classified input sequences known in advance to contain the motif being sought. Instead, the proposed algorithm, like most de novo motif discovery algorithms, estimates the number of motif appearances from the data. This capability is quite robust, as the results showed that even when only 13.6% of the NFYA ChIP-seq peak regions contain a motif, the motif is still characterized well (Fig. 1d). We also overcame the problem of finding several existing motifs in the ChIP-seq data set in a single pass. Our idea can be considered a sequential integration of FCM and EM methods and demonstrated improvement over the performance of the existing relative method, the MEME-ChIP, for finding motifs in ChIP-seq experiments.
Regarding the comparison results, and as can also be seen in previous studies (Ibrikci and Karabulut, 2010; Zeng et al., 2016), a method may not always produce perfect predictions, possibly due to low information content of the target pattern or a very low number of TFBSs with respect to the sequence in which they reside. However, while the similarity measure for SIFEM was not able to outperform MEME-ChIP results for NFYA and REST TFs, the proposed algorithm found the true motifs for all TFs. On the contrary, SIFEM was able to determine the direct DNA-binding motif of ChIP-ed TFs using the central enrichment method. In conclusion, we have proposed a motif discovery algorithm that can characterize ChIP-seq data with different kinds of pattern characteristics in an efficient manner.
The proposed algorithm is implemented in MATLAB. Each pass through the data set with the FCM and EM algorithm has a time complexity of O(nWC2) and O(nW), respectively. Therefore, the overall time complexity is proportional to the number of clusters, the width of the motif, and the size of the data set.
Footnotes
Acknowledgments
This research was supported by the Basic Science Research Program through the National Research Foundation of Korea (NRF) funded by the Ministry of Education (No. NRF-2015R1D1A1A01058075) and a grant of the Korea Health Technology R&D Project through the Korea Health Industry Development Institute (KHIDI), funded by the Ministry of Health & Welfare, Republic of Korea (No. HI14C1277). The funders had no role in study design, data collection and analysis, decision to publish, or preparation of the article.
Author Disclosure Statement
The authors declare that no competing financial interests exist.
References
Supplementary Material
Please find the following supplemental material available below.
For Open Access articles published under a Creative Commons License, all supplemental material carries the same license as the article it is associated with.
For non-Open Access articles published, all supplemental material carries a non-exclusive license, and permission requests for re-use of supplemental material or any part of supplemental material shall be sent directly to the copyright owner as specified in the copyright notice associated with the article.