
Abstract
Abstract
1. Introduction
R
When differential gene expression (DGE) analysis is performed, there are some biases that must be taken into account. So it is necessary to carry out a normalization step, which is intended to eliminate or reduce these effects (Bullard et al., 2010; Soneson and Delorenzi, 2013). Each method subjected to DGE analysis employs a particular type of normalization. The normalization method used in this study is reads per million (RPM). In this procedure, the reads in a sample are divided by a scale factor, and measured as the sum of the reads of the sample divided by 1 million.
The method implemented in the edgeR package (Robinson et al., 2010) is known as Trimmed Mean of M-values. This method uses scale factors that are calculated after removing the genes with large differences from expression and high average read counts (Robinson and Oshlack, 2010). The normalization method implemented in the DESeq package is based on a scaling factor for a given sample, which is calculated as the median of the ratios associated with read counts for each gene over its geometric mean across all samples (Anders and Huber). In the default normalization method implemented in the baySeq package (Hardcastle and Kelly, 2010) proposed by Bullard et al. (2010), the distribution of read counts is scaled by a factor that adjusts count distributions using third quantile. The normalization factors associated with PoissonSeq normalization (Li et al., 2011) are calculated using a goodness-of-fit estimate (Rapaport et al., 2013). The normalization method implemented in the limma package (Smyth, 2004) transforms the read counts into the appropriate log form for linear modeling using a LOWESS regression (Law et al., 2014). After the last step, DGE analysis can be carried out.
Although DGE analysis is widely used, the field is not completely consolidated, and new methods and pipelines are continuously being presented (Garber et al., 2011; Seyednasrollah et al., 2013; Soneson and Delorenzi, 2013; Finotello and Di Camillo, 2014; Dou et al., 2015). In this study, we examine the use of a geometric approach based on Suvrel ideas in DGE profiling. The Suvrel method is a variational procedure that determines metric tensors to define distance-based similarity in pattern classification inspired by relevance learning. The variational method is applied to a cost function that penalizes large intraclass distances and favors small interclass distances. The method assigns different levels of relevance to features associated with experiments and brought advantages in classification procedure and data representation associated with microarray and Proton NMR data (Boareto et al., 2015) and enzyme classification (Boareto et al., 2012). Based on these ideas, in this study, we introduce a method for determining the relevance of each genomic feature (e.g., gene, exon, or transcript) based on interclass and intraclass distances.
The article is organized as follows: Section 2 discusses the datasets and presents the approach used in this study. In Section 3, the respective performance of DEpackages (edgeR, DESeq, PoissonSeq, baySeq, and limma) and the geometric approach is compared. To achieve a comprehensive comparison, the analysis was segmented into two parts: in the first, summarized read counts from technical replicate samples associated with Sequencing Quality Control Consortium (SEQC), which represent an idealized scenario of minimal variation (Rapaport et al., 2013), were used, and, in the second part, biological replicate samples associated with the Montgomery et al. (2010) and the Pickrell et al. (2010) studies were used.
2. Methods
2.1. Datasets
The first part of the analysis was produced using two datasets. The first dataset is characterized by a count matrix provided by Rapaport et al. (2013) and contains summarized read counts from two sources that are part of the SEQC study distributed in two experimental conditions: A and B. The samples in Group A contain Stratagene Universal Human Reference RNA (UHRR) with 2% by volume of External RNA Controls Consortium (ERCC) mix 1, and Group B contains Ambions Human Brain Reference RNA (HBRR) with 2% by volume of ERCC mix 2. The ERCC mix consists of spike-in synthetic oligonucleotides mixed at four mixing ratios: 1/2, 2/3, 1, and 4. For future reference, these data are named the SEQC count matrix. The performance comparison between the DEpackages and the geometric approach is performed using ERCC mixing ratios and TaqMan data, the latter containing real-time quantitative reverse transcription polymerase chain (qRT-PCR) measurements associated with a set of roughly 1000 genes from replicated samples of human whole-body reference RNA and HBRR.
The second dataset is more recent and is associated to study presented by Celine Everaert et al. The authors performed a benchmarking study using RNA-seq reads from two replicates associated to UHRR and two replicates related to HBRR reference samples (MAQCA and MAQCB, respectively), and 18,080 protein-coding gene measures using PrimePCR assays from SEQC study (Everaert et al., 2017). The counting matrix was produced using samples aligned and quantified by the Tophat and HTseq tools (GSM2202397, GSM2202398, GSM2202399, and GSM2202400). One of the results associated with the study of Celine Everaert et al. is that the choice of the alignment and quantification strategy has little impact on the measure of gene expression intensities. For future reference, these data are named Celine Everaert dataset.
The second part of the study was conducted using a combination of summarized read counts based on the Montgomery et al. (2010) and Pickrell et al. (2010) studies obtained from the tweeDEseqCountData R package (Esnaola et al., 2013). The count matrix associated with the Montgomery study summarizes lymphoblastoid cell lines from 60 unrelated Caucasian individuals of European descent. The Pickrell count matrix summarizes lymphoblastoid cell lines from 69 unrelated Nigerian individuals. For future reference, these data will be named as the Pickrell-Montgomery (PM) count matrix. The R scripts produced in this study were based on the scripts provided by Rapaport et al. (2013) and will be available online (Tambonis, 2017) and in the Additional Files section. More information about the files used is available in Rapaport et al. (2013).
2.2. Differential gene expression profiling using the geometric approach
In this study we analyze DGE profiling using a geometric approach based on Suvrel ideas presented by Boareto et al. (2015). The Suvrel method is a variational procedure that determines metric tensors
where
The summarized read counts from an experiment i are represented by the vector
The distance of a gene calculated as in Equation (2) is similar to the calculation of fold change. In this study, we define individual feature cost
which penalizes genes that increase intraclass distances, while favoring those that decrease interclass distances. The label C denotes experiments into the same experimental condition and F denotes different experimental conditions;
Alternatively, the distance between two experiments i and j can be considered the quadratic distance
The analysis using Equation (4) is presented in the Supplementary Material, and the results are qualitatively equivalent to those obtained using Equation (2).
3. Results
3.1. Differential expression analysis
3.1.1. Technical replicates
The comparison between the DEpackages discussed in Section 1 and the geometric approach using technical replicates associated with the SEQC count matrix discussed in Section 2.1 was conducted through receiver operating characteristic (ROC) analysis. In the first step, ROC analysis was performed using the ERCC data resulting from the definition of a mixing ratio of 1:1 (log ratio = 0) as the true negative set and a mixing ratio of 1:2, 2:3, and 4:1 as the positive set. The Area Under the Curve (AUC) values indicate a comparable performance among the DEpackages as reported by Rapaport et al. (2013) and a slight performance advantage in the geometric approach (Fig. 1A). However, the methods perform better when a specific interval of specificity (1–0.9 and 1–0.8) is analyzed (Fig. 1B, C). In DEG profiling, researchers are interested in an optimized list of genes expressed differently. Thus, the method has the interesting characteristic of returning good performance for most relevant genes.
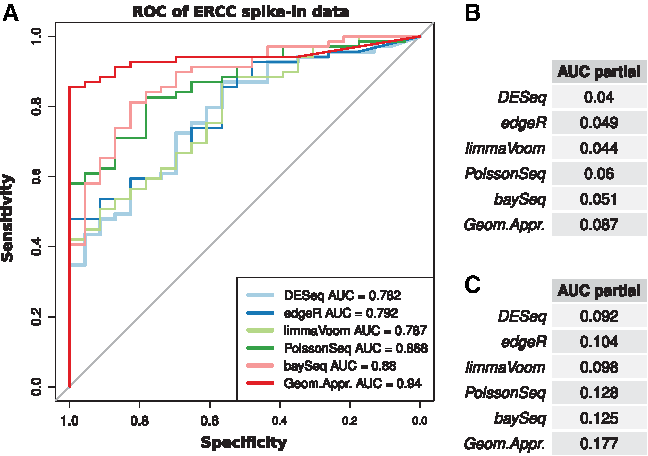
ROC analysis of ERCC spike-in data.
The second ROC analysis was performed using TaqMan data from the definition of the true negative set using
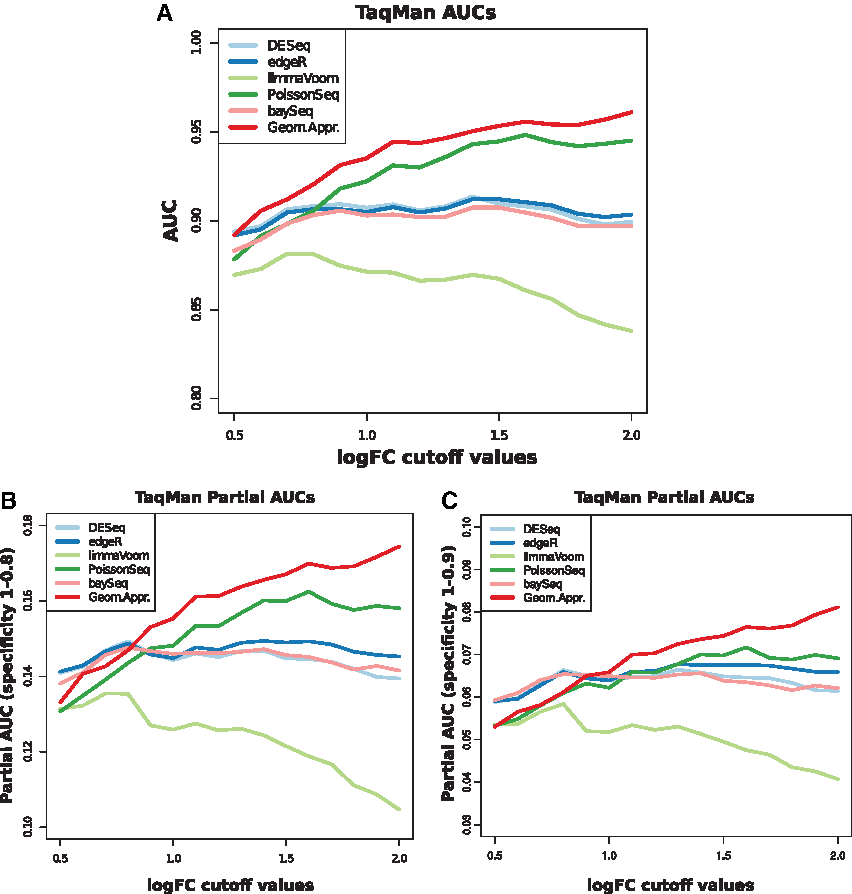
ROC analysis of TaqMan data.
The third ROC analysis was performed using Celine Everaert dataset. RT-qPCR expression data for 180,80 protein-coding genes were used for the definition of the true negative set using
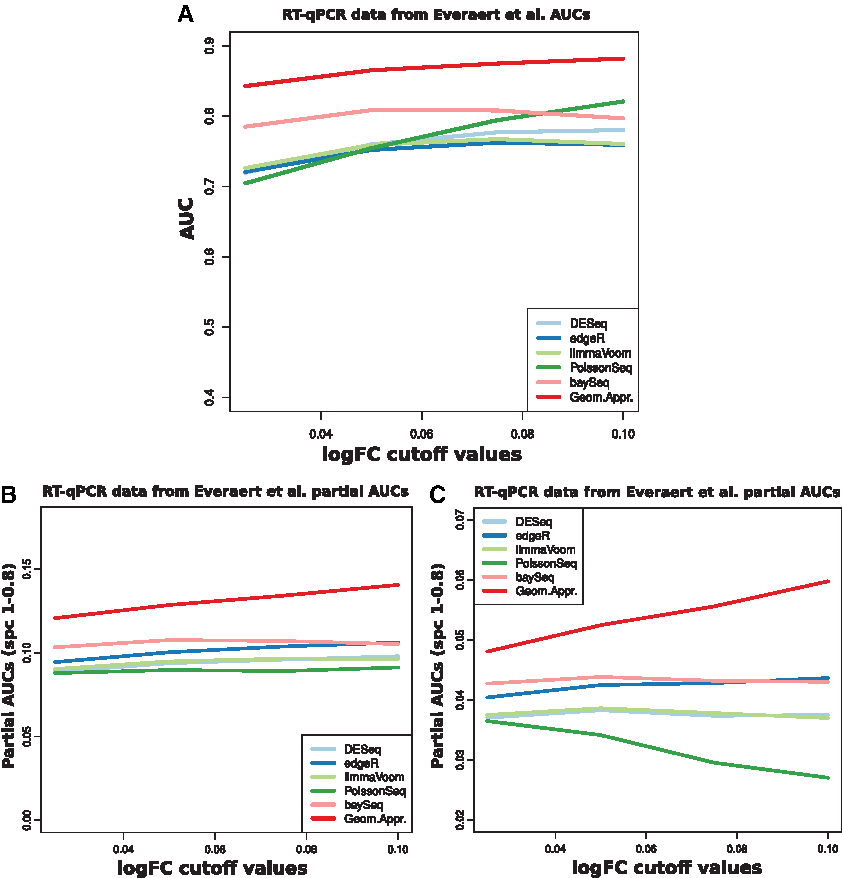
ROC analysis using Celine Everaert dataset (Everaert et al., 2017).
3.1.2. Biological replicates
To assess the robustness of a given method, we used the natural similarity measure proposed by Ein-Dor et al. (2006), which consists of the fraction of genes shared by two lists of DEG obtained from different samples using that method. We compare 100 lists chosen randomly in a serial of intervals of the most DEG and we found that the geometric approach has comparable performance among methods (Fig. 4, 100 most DEG). More selection of genes is presented in the Supplementary Material.
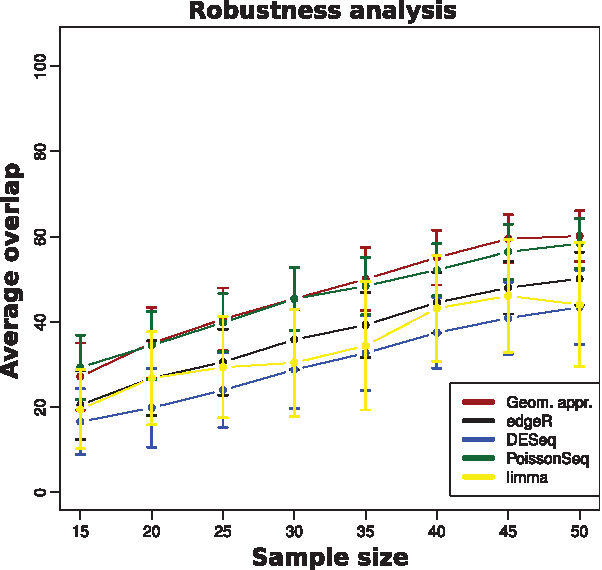
Robustness analysis. Average of the fraction of genes shared by two lists of DEG (overlap) as a function of sample size using the PM count matrix. Each list of DEG is composed of the 100 lowest p-value genes chosen according to the different methods edgeR, DESeq, limma, and PoissonSeq, and 100 most relevant genes from the geometric approach. The analysis of other intervals associated with the most DEG is presented in the Supplementary Data. The average value of the overlap between the lists is calculated over 100 lists chosen randomly. The baySeq package was removed from analysis due to the high computational cost. DEG, differentially expressed genes.
4. Discussion and Conclusion
The objective of this study was to compare the performance of the geometric approach and DEpackages intended for DGE profiling of RNA-seq data. To do this, we divided the analyses into technical and biological sample replicates. In both cases, we conclude that the geometric approach has comparable performance to the other methods. In particular, we found that the method has an advantage in the ranking of the most DEG (specificity of 1 to 0.8). The DEpackages analyzed in this study aimed at DGE profiling, and they make assumptions on the distribution associated with read counts in statistical tests. The two most commonly used distributions are the Poisson and Negative Binomial (Robinson and Smyth, 2008; Anders and Huber, 2010; Hardcastle and Kelly, 2010; Auer and Doerge, 2011; Di et al., 2011; Soneson and Delorenzi, 2013). On the other hand, the geometric approach is a simple method that does not require any assumption concerning data distribution, which enhances its robustness. In this case, in particular, the method does not make any assumption about distribution associated with RNA-seq data set. In addition to comparable performance, we also found that the method has advantages in data representation in RNA-seq data, as shown in Figure 5.
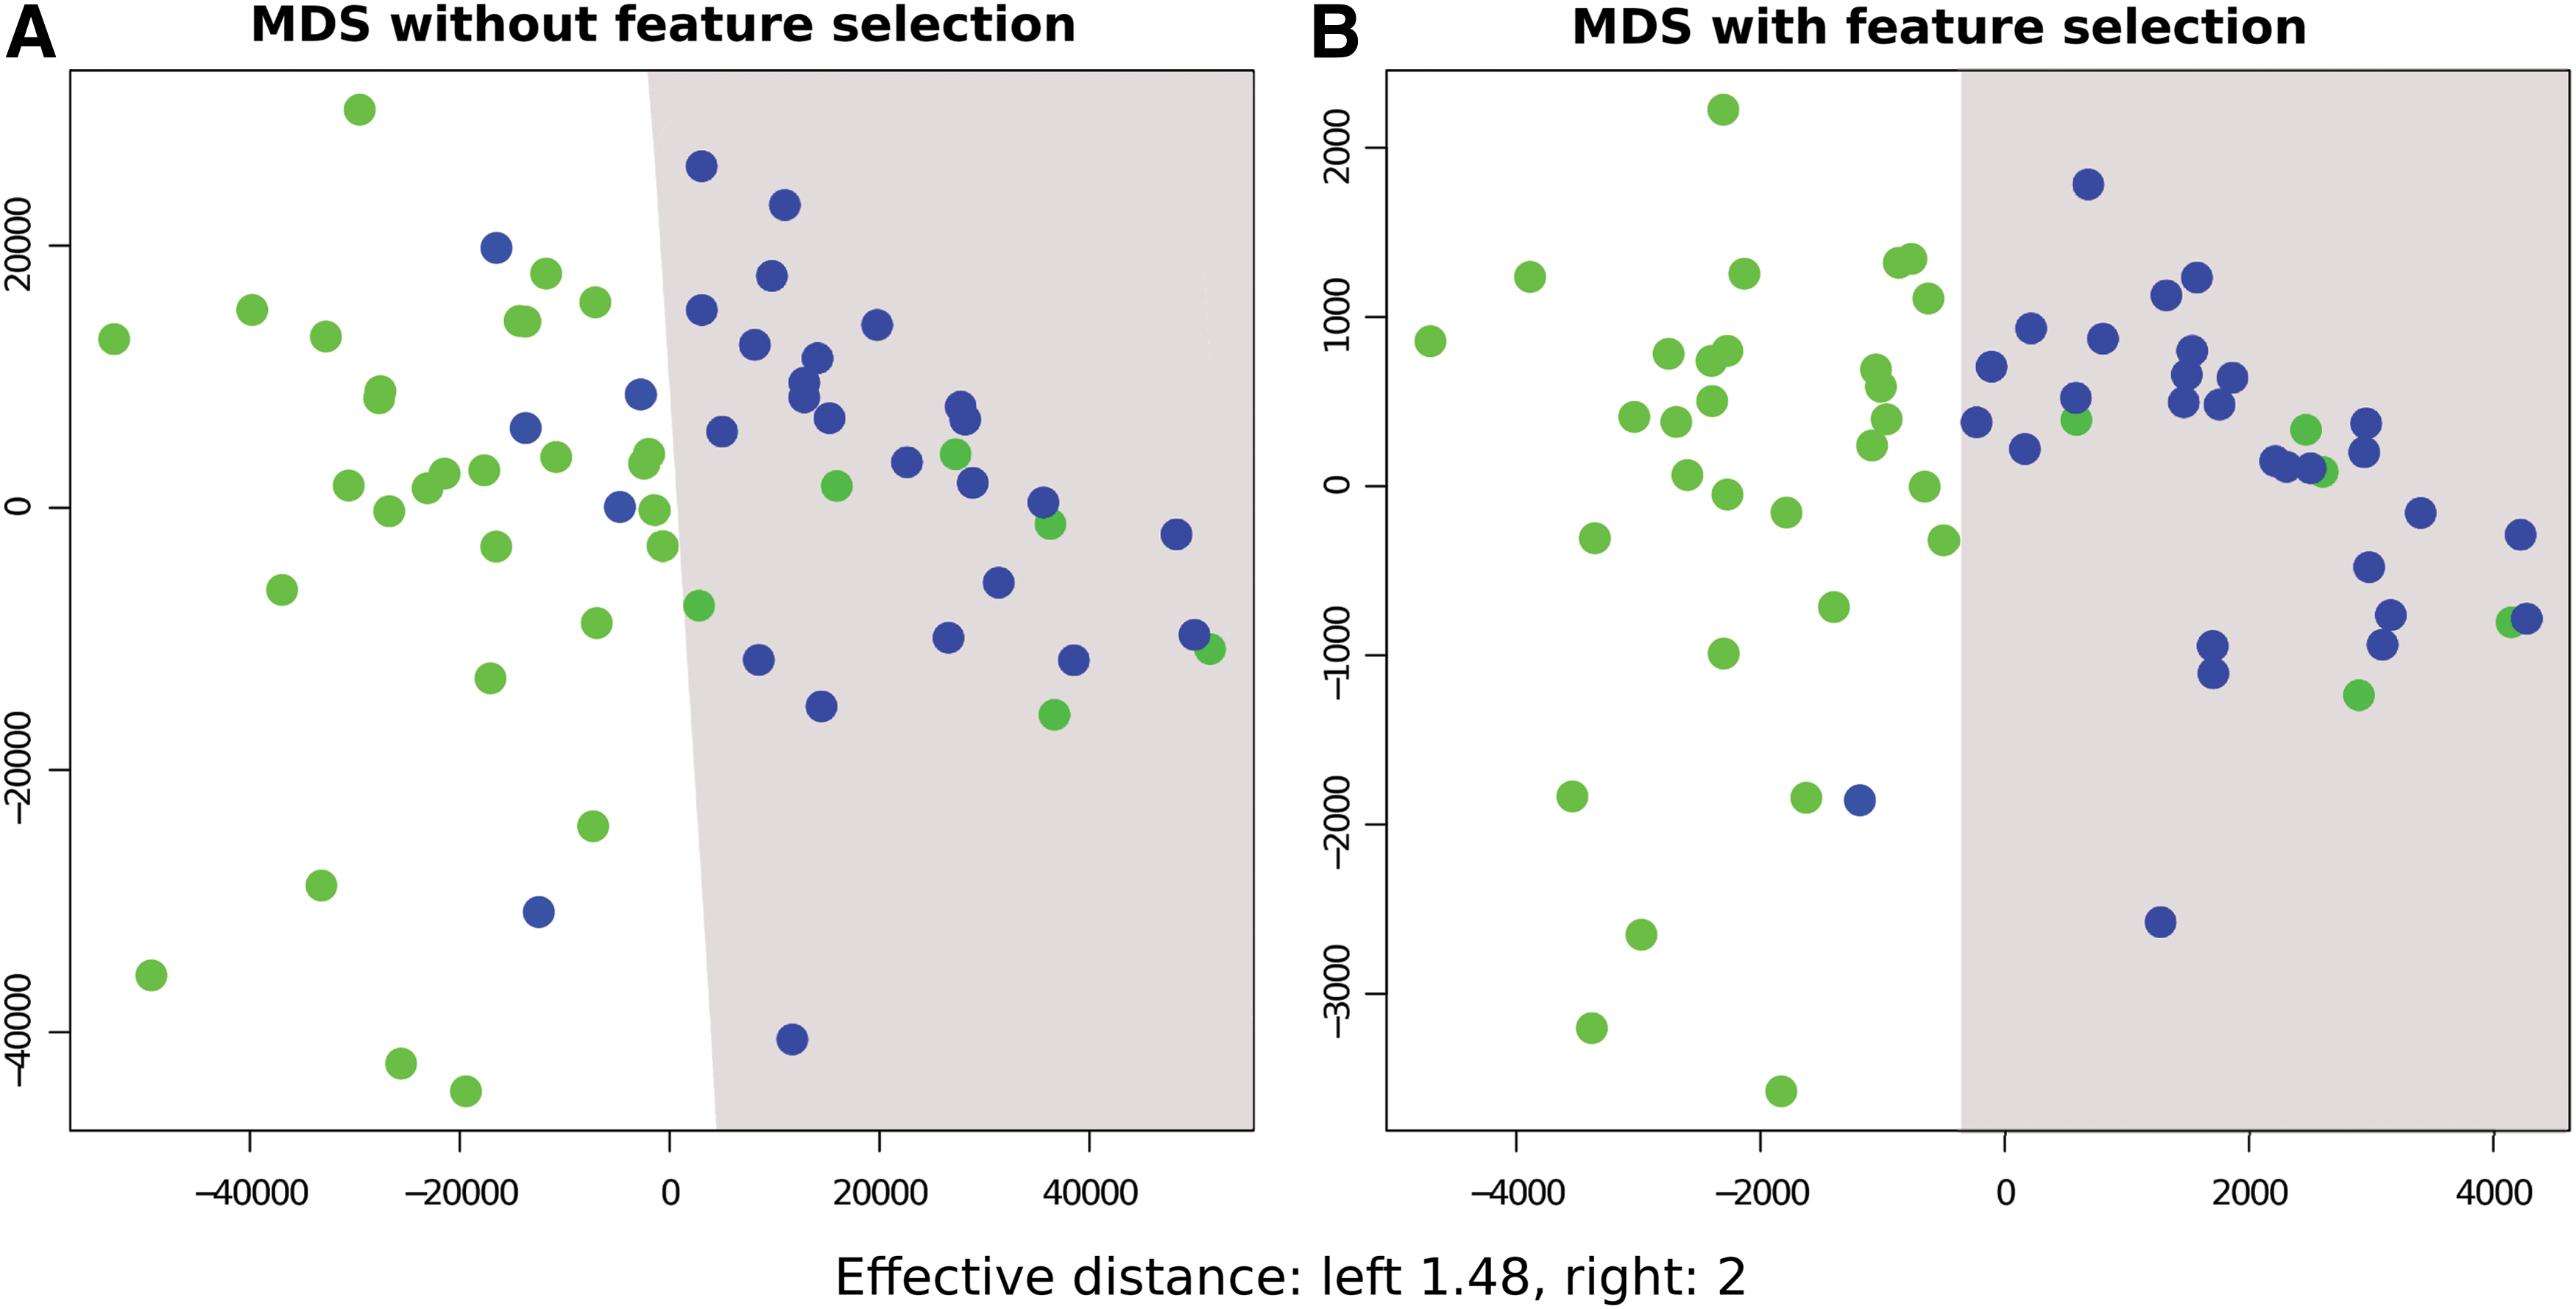
Multidimensional scaling comparison. Dimensional representation of PM count matrix using Multidimensional Scaling.
Despite the positive results, it is possible that problems associated with the use of fold change in ranking also occur with the geometric approach (Feng et al., 2012), although results generated through fold change are more reproducible and biologically relevant (Dembélé and Kastner, 2014). One disadvantage of this method is that it does not provide statistical significance. Nevertheless, it can be employed in association with other methods (such as DEpackages) so that it may help to increase the overall DGE performance. From this perspective, the relevance of this study was to show that this simple method can provide, at least, as good performance as more complex methods do, and may yield additional insights into DGE.
Footnotes
Acknowledgments
T.T. was funded by Higher Education Personnel Improvement Coordination (CAPES). V.B.P.L. was supported by the National Council for Scientific and Technological Development (CNPq) and São Paulo Research Foundation (FAPESP) Grant 2014/06862-7 and 2016/19766-1.
Author Disclosure Statement
The authors declare that no competing financial interests exist.
References
Supplementary Material
Please find the following supplemental material available below.
For Open Access articles published under a Creative Commons License, all supplemental material carries the same license as the article it is associated with.
For non-Open Access articles published, all supplemental material carries a non-exclusive license, and permission requests for re-use of supplemental material or any part of supplemental material shall be sent directly to the copyright owner as specified in the copyright notice associated with the article.