
Abstract
Abstract
1. Introduction
C
In human and animal models, recent studies demonstrated that circadian rhythm is involved in the incidence of hypertension, coronary artery disease (CAD), dyslipidemia, and other cardiovascular pathologies by transcriptional regulation. Closely related to circadian rhythm, cardiovascular organs have diurnal rhythm, such as heart rate, blood pressure, and endothelial function. Disorders in circadian rhythm are usually the onset of cardiovascular disease such as acute coronary syndrome and atrial arrhythmia. Current evidences have supported that CHD pathology is tightly related to intrinsic circadian rhythms (Takeda and Maemura, 2011). The human heart has a rhythmic expression of clock genes, including PER1, PER2, and BMAL1, whereas the amplitudes are more different from any other human tissues (Leibetseder et al., 2009). In Drosophila heart, the CLOCK–CYCLE heterodimer exists as the circadian oscillator (Gummadova et al., 2009).
It is well known that circadian rhythm disturbances lead to mood disorders and delayed sleep onset (Kennaway, 2010). The clock gene Bmal1 has long been associated with hypertension and metabolic dysfunction (Miyazaki et al., 2011). Heart response to hypertrophic stimuli is regulated by cardiomyocyte circadian clock (Durgan et al., 2011). Clock mutant mice displayed dampened diurnal amplitudes of arterial pressure and heart rate (Sei et al., 2008). Clock mutant mice, Bmal1 (−/−), Clock (mut), and Npas2 (mut), which has clock gene deletion, showed abnormal changes in blood pressure (Curtis et al., 2007). There are clear effects of circadian rhythm in CHD (Steidle-Kloc et al., 2016). Long-term myocardial structure and function are adversely affected by circadian rhythm disorder after murine myocardial infarction (Alibhai et al., 2014). Age-associated dilated cardiomyopathy could be developed by loss of the circadian clock gene Bmal1 through altered myosin heavy chain gene expression and damage of sarcomere structure (Lefta et al., 2012).
In contrast, loss of the circadian rhythm gene mPer2 could attenuate myocardial injury in mice (Virag et al., 2010). Furthermore, circadian rhythms could be also involved in drug response in hypertension and CHD disease (Lemmer, 2006). In general, the circadian rhythm genes have been proved to interact with CHD. However, the potential preventative and therapeutic strategies for susceptible populations through the regulation of this interaction remain to be studied.
The genome extensive association analysis for CHD has revealed several susceptibility genes for CHD, which play a key role in diverse biological pathways such as inflammation, innate immunity, and cholesterol metabolism (Broeckel et al., 2002). Single-nucleotide polymorphisms (SNPs) on circadian rhythm genes also indicate that they are CHD susceptibility genes. However, other cross talk between susceptibility genes and circadian rhythm remains to be characterized.
The transcriptome network is an effective approach to dissect the cross talk between CHD susceptibility genes and circadian rhythm since circadian rhythm is involved in transcriptional regulation of the genome. Several CHD-related transcriptome studies were performed by chip and next-generation sequencing. For example, a microarray was applied to display the mouse heart transcriptome in various heart diseases (Hong et al., 2008). Similar studies had been done in humans to reveal the divergent cardiovascular disease pathways (Zhao et al., 2012). Transcriptome network analysis from these datasets identified a number of potential candidate genes for heart failure (Chen et al., 2013). In addition, many transcriptional regulators in human ischemic cardiomyopathy and coronary artery calcification were revealed from the gene expression network (Sen et al., 2014; Herrer et al., 2015). These works suggested the link between CHD genes and circadian rhythm by correlation analysis between genes.
So far, only single gene pairs were considered in these coexpression analyses. It is valuable to study the potential combination of genes associated with the downstream pathway. However, limited studies have developed methods to solve this problem. For instance, canonical correlation analysis was carried out to determine the genetic regulatory units in the Childhood Asthma Management Program (Naylor et al., 2010). The same method was performed on AIDS susceptibility genes and metabolic pathways (Ye et al., 2016). Hypergeometric distribution statistics were executed on the coexpression of mitochondrial respiratory complexes (Chen et al., 2014).
Multiple correlation analysis statistically calculates the coefficient that determines a given variable as a linear function of a set of variables. It is suitable for mining the potential combination of gene expression levels related to downstream genes. It could be used to calculate the correlation between genes and predict the linear combination from the gene expression. In this study, we conducted multiple correlation analysis to identify linear combinations of circadian rhythm genes that correlated with CHD susceptibility genes. We discussed the most significant cross talk between CHD and circadian rhythm under transcriptional regulation.
2. Methods
2.1. Transcriptome datasets
The normalized transcriptome microarray datasets were downloaded from the website (http://coxpresdb.jp), including about 4000 experiments and 20,000 human genes. Circadian-related genes were defined by KEGG annotation (www.keg.jp) as members of circadian rhythms and circadian entrainment pathways. From published genome-wide association studies (GWAS), it was identified that the CHD susceptibility gene had a significant p value (p < 10E-5). The expression patterns of circadian-related genes and CHD genes were extracted from transcriptome datasets.
2.2. Strategy
In this study, we performed all analyses following the strategy in Figure 1. First, we collected two lists of CHD susceptibility genes and circadian rhythm genes from published literature and databases. Second, the expression patterns of these genes were arranged from genome transcriptome datasets, which used microarrays to determine the expression levels of about 20,000 genes in 4000 experiments. Third, the Pearson correlation coefficient, r, was determined between all gene pairs in lists. Setting a threshold for r, the remaining coexpression levels were considered as links between genes in a network. Next, we defined the expression of each single CHD gene as variable y and expression of circadian groups as an independent variable X (x1, x2, x3…xn). Then, a plurality of correlation coefficients (R2) was calculated to estimate the combination of X, which could provide an output of variable y. The F-test was used to assess the correlation. The coefficient β factor represents the combination of X. Circadian genes with top β factor were considered as important regulators of a certain CHD gene. Using their β factor and expression of top circadian genes, we predict the expression of a certain CHD gene. Compared with real microarray data, CHD genes were selected for further analysis by transient expression of top circadian genes in cells.
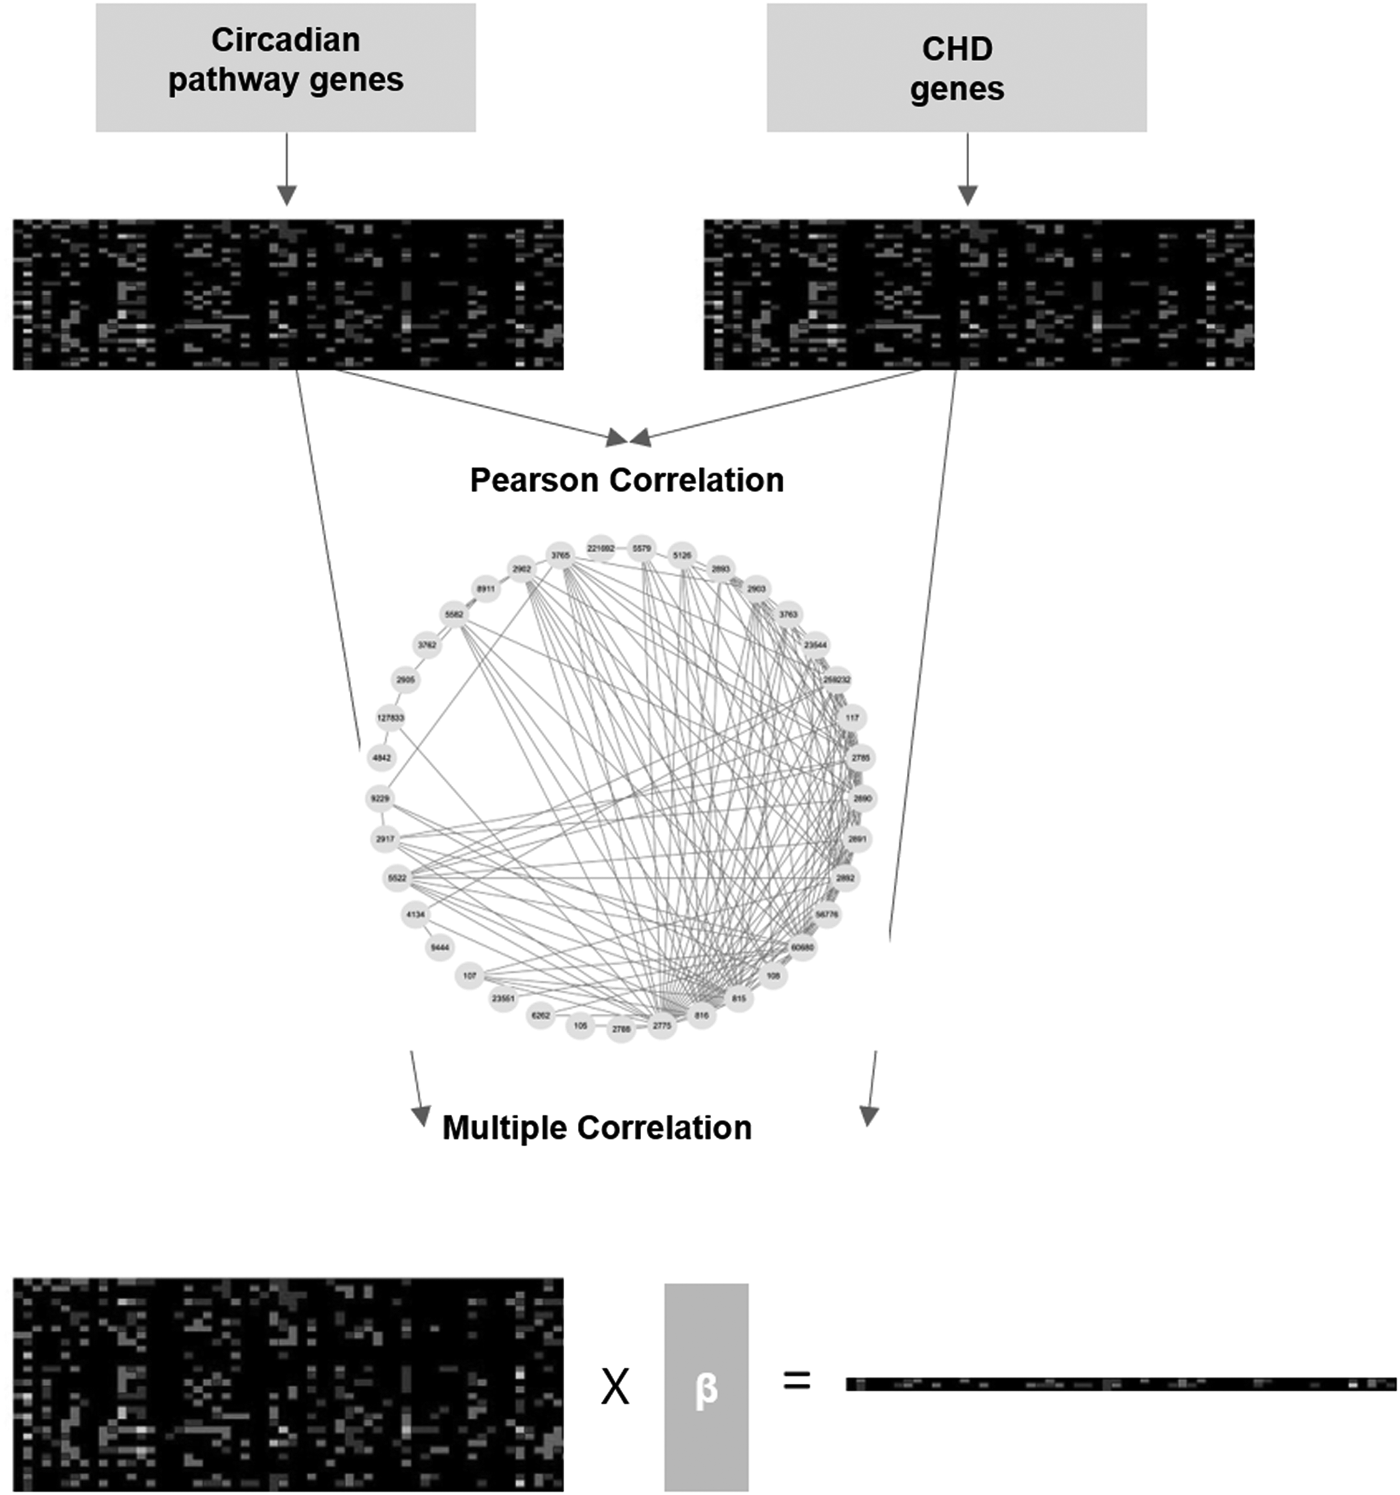
Strategy of study. Collection of CHD genes and circadian pathway genes; construction of the coexpression network among individual CHD and circadian pathway genes; and performance of multiple correlation analysis. CHD, coronary heart disease.
2.3. Multiple correlation analysis
The coefficient of multiple correlation is used to statistically fit the correlation between a given variable and a set of other variables by using a linear function. The best fitting function was judged by the coefficient of multiple correlation R2, which has values between 0 and 1. Higher value of R2 indicates that the independent variable is more adaptable to the linear function than the dependent variable. R2 revealed the strength of the association, but the direction could be provided by the simple correlation coefficient.
R2 is determined by the vector c = (rx1y, rx2y, …, rxNy)T of each simple correlation coefficient between the independent variables xn and dependent variable y. It is given by a formula: R2 = cTRxx−1c. Rxx−1 is the inverse matrix:
2.4. Cell culture and transfection
Human embryonic kidney (HEK) 293T cells were grown in Dulbecco's modified Eagle's medium (changed every 2 days), including 10% fetal bovine serum, with a 5% CO2 atmosphere at 37°C. Cells were cultured in six-well plates for transfections using Lipofectamine 2000 following the manufacturer's protocol. Lipofectamine was cultured in serum-free medium. Next, appropriate amounts of vector and Lipofectamine were incubated together and added to cell plates.
2.5. RNA isolation, complementary DNA synthesis, and qRT-PCR (quantitative real-time polymerase chain reaction) analysis
Total RNAs were extracted from cells using TRIzol Reagent (Life Technologies) according to the manufacturer's protocol. From each sample, 1 μg of total RNA was used to generate complementary DNA (cDNA) using the First Strand cDNA Synthesis Kit (TOYOBO). The gene expression level was determined by quantitative polymerase chain reaction (qPCR) on cDNA using TransStart Top Green qPCR SuperMix (Transgen Biotech). Real-time PCRs were performed on the iQTM5 Detection System (Bio-Rad). qPCR cycling conditions were carried out as follows: 50°C for 2 minutes, initial denaturation at 95°C for 10 minutes, and 40 cycles at 95°C for 30 seconds and 55°C for 1 minute, and extension at 72°C for 30 seconds.
3. Results And Discussions
3.1. Genes involved in circadian rhythm and entrainment in CHD susceptibility
Genes related to circadian rhythm and circadian entrainment were collected following KEGG annotations. These circadian genes include the core clock genes such as CLOCK, Baml1, Period, and Cry, which established feedback loops to drive the rhythmic expression pattern of clock genes. Cryptochrome genes CRY and period genes PER code the components of a heterodimer, which could lead CLOCK/BMAL1 to repress their own expression. During these processes, casein kinase epsilon (CKI epsilon) phosphorylates PER and CRY and causes their degradation. This is the first negative feedback loop in regulation of the circadian rhythm core. The CLOCK/BMAL1 heterodimer could activate target genes with the regulatory enhancer as a positive feedback loop (Supplementary Table S1).
In circadian entrainment, signal transduction established a general pathway, including calcium influx. Diverse signal transduction cascades, such as calmodulin kinase II (CaMKII) and neuronal nitric oxide synthase activity, and cAMP- and cGMP-dependent protein kinases, as well as mitogen-activated protein kinase (MAPK), are triggered by glutamate NMDA-induced calcium influx and other second messengers. Phosphorylation of cAMP response element-binding protein (CREB) occurs in the interaction between these signal cascades, whereas the cross talk is not yet clear. Again, PER1 and PER2 expression levels were induced by pCREB binding on the CRE of their promoters (Golombek and Rosenstein, 2010).
3.2. Genes involved in CHD susceptibility
CHD susceptibility genes were collected from published GWAS, which identify SNPs associated with the CHD-related phenotype. In total, 373 SNPs had significant p value <10E5 in results of eight studies. As these SNPs are amplified in both coding regions and noncoding regions, we used SNPs located in coding regions to define the CHD susceptibility genes. In general, 120 genes involved in different biological processes were selected as CHD susceptibility genes (Supplementary Table S2). These genes were enriched in rhythmic, developmental, response to stimulus, and metabolic processes. It suggests that CHD susceptibility is regulated by circadian rhythm.
3.3. Coexpression network
Using Pearson correlation (r > 0.6) to define the link among circadian-related genes and CHD susceptibility genes, a coexpression network was constructed to show gene interactions in transcriptional regulation (Fig. 2). In general, 47 genes from circadian-related genes and CHD susceptibility genes were identified in this coexpression network, such as adenosine deaminase, RNA-specific B2 (ADARB2); adenylate cyclase 1 (ADCY1); adenylate cyclase 2 (ADCY2); ADCYAP receptor type I (ADCYAP1R1); chrom 14 open reading frame 119 (C14orf119); calcium voltage-gated channel subunit alpha1 I (CACNA1I); CUGBP, Elav-like family member 5 (CELF5); cofilin 1 (CFL1); DLG-associated protein 1 (DLGAP1); formin 2 (FMN2); G protein subunit alpha i3 (GNAI3); G protein subunit alpha o1 (GNAO1); G protein subunit beta 1 (GNB1); glutamate metabotropic receptor 7 (GRM7); guanylate cyclase 1 soluble subunit alpha (GUCY1A3); guanylate cyclase 1 soluble subunit beta (GUCY1B3); microtubule-associated protein 4 (MAP4); maternal embryonic leucine zipper kinase (MELK); sodium leak channel, nonselective (NALCN); nitric oxide synthase 1 (NOS1); proprotein convertase subtilisin/kexin type 2 (PCSK2); phosphatase and actin regulator 1 (PHACTR1); QKI, KH domain containing RNA binding (QKI); RASD family member 2 (RASD2); ryanodine receptor 2 (RYR2); seizure-related 6 homolog-like (SEZ6L); synaptotagmin 2 (SYT2); tubulin alpha 1c (TUBA1C); and WD repeat domain 12 (WDR12).
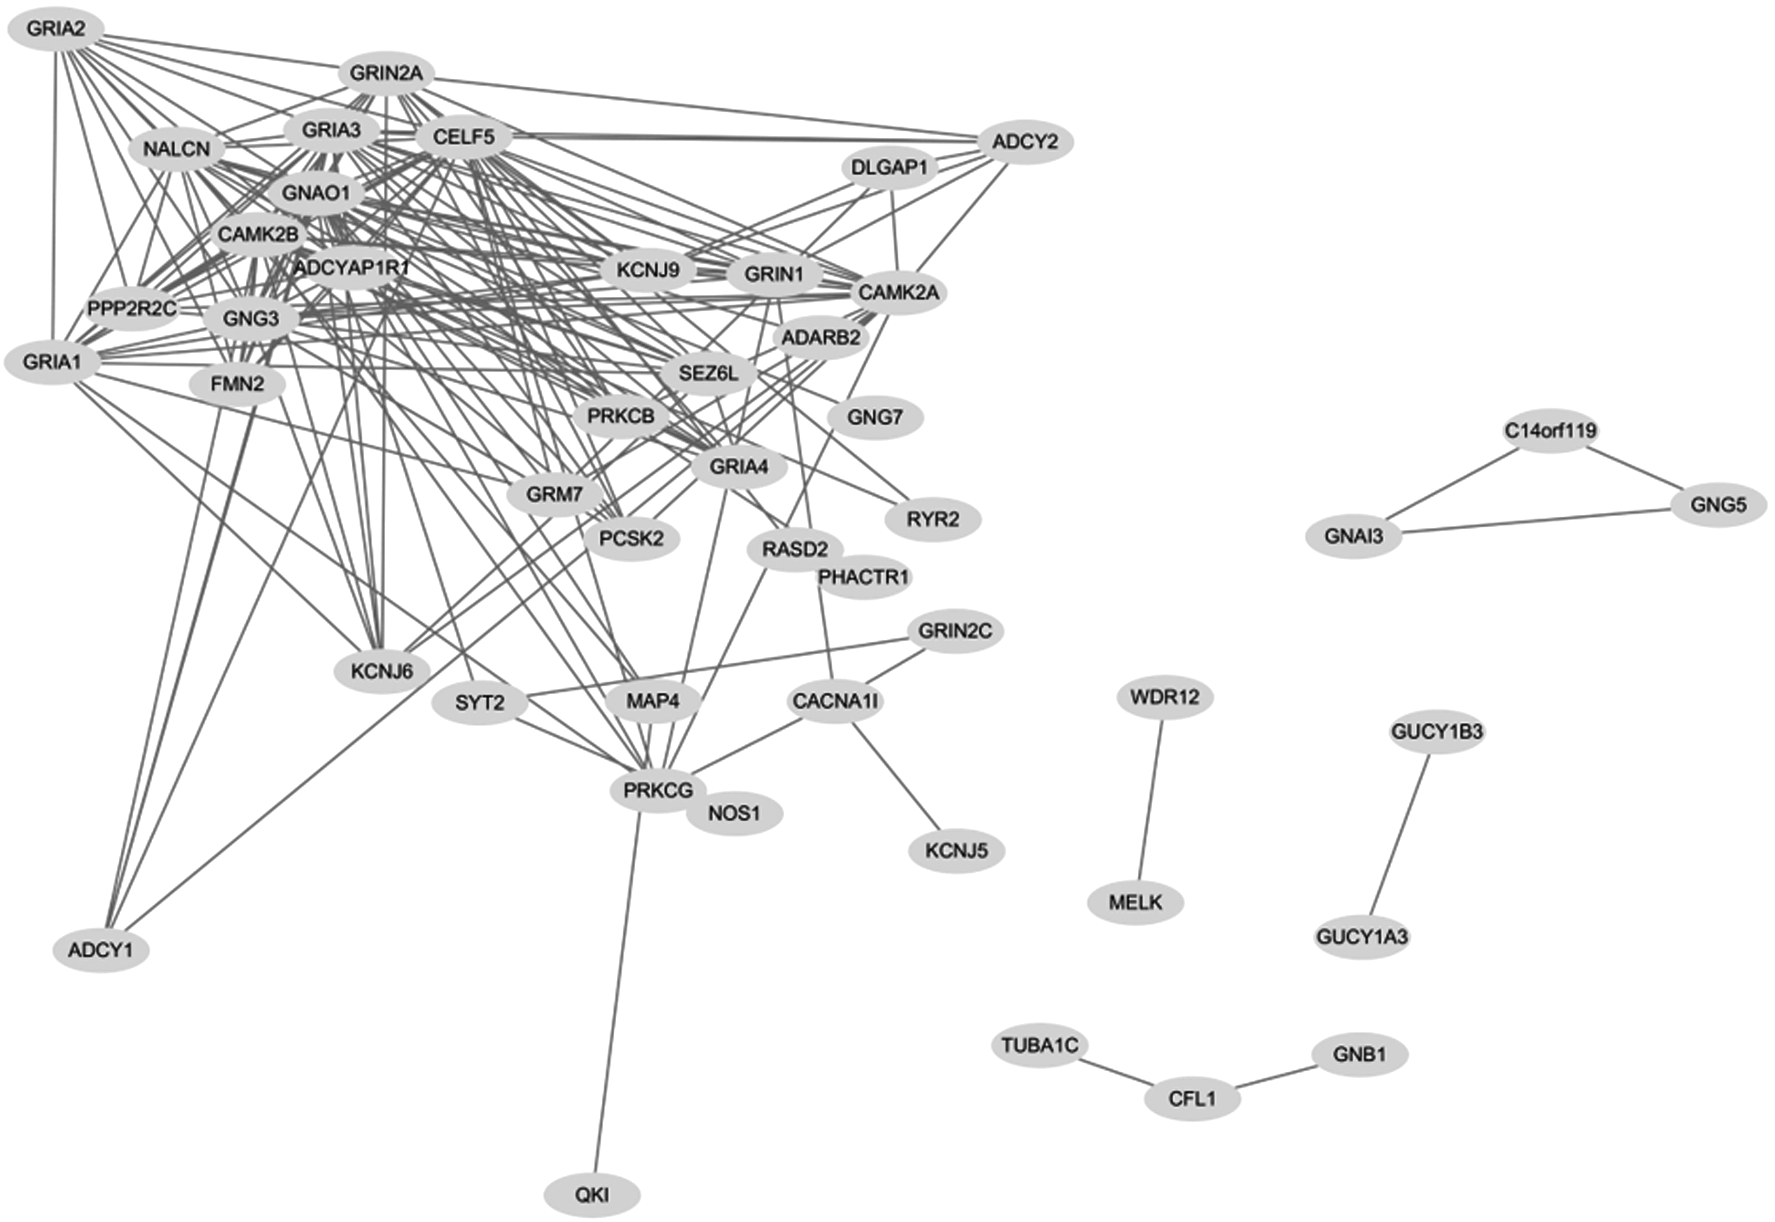
Coexpression network of CHD genes and circadian pathway genes. Pearson correlation factor r > 0.6.
There are many genes belonging to the same family, such as potassium voltage-gated channel subfamily J member 5/6/9 (KCNJ5/6/9), G protein subunit gamma 3/5/7 (GNG3/5/7), glutamate ionotropic receptor AMPA type subunit 1/2/3/4 (GRIA1/2/3/4), glutamate ionotropic receptor NMDA type subunit 1/2A/2C (GRIN1/2A/2C), calcium/calmodulin-dependent protein kinase II alpha (CAMK2A), calcium/calmodulin-dependent protein kinase II beta (CAMK2B), protein phosphatase 2 regulatory subunit B gamma (PPP2R2C), protein kinase C beta (PRKCB), and protein kinase C gamma (PRKCG). This coexpression network is constructed by 170 link edges (interactions) among these genes. Some genes have few edges that lead to isolation from the network, such as WDR12-MELK, GUCY1B3-GUCY1A3, TUBA1C-CFL1-GNB1, and GNAI3-GNG5-C140rf119. Some genes have multiple edges that lead to a complex network, such as GRIA1/2, ADCY1/2, KCNJ6, and CAMK2A. In all 47 genes in the network, 19 belong to CHD susceptibility genes and 28 are circadian related. Thus, this network provides new insight into interactions between CHD susceptibility genes and circadian-related genes, whereas the KEGG pathway could not reveal this important information.
3.4. Multiple correlations between CHD susceptibility genes and circadian genes CHD susceptibility gene
To identify the coexpression between CHD susceptibility genes and a combination of circadian-related genes, we performed multiple correlation analysis on each CHD susceptibility gene. In general, nine CHD susceptibility genes were determined with R2 more than 0.7 (Table 1 and Fig. 3A). Results showed that more than seventy percent of expression variation of CHD susceptibility genes in different conditions could be explained by a combination of all circadian-related genes. These genes are CUGBP, CELF5; NALCN; PPP2R2C; TUBA1C; MAP4; CFL1; myosin heavy chain 7 (MYH7); QKI; and MELK. The F statistic value for these correlations is on top of all calculations with a value >80 (Fig. 3B). In addition, theɛvalue for these correlations is minimal in all, which indicates that there is less error in using this correlation to predict gene expression (Fig. 3C).

Statistics of multiple correlation analysis.
List of Coronary Heart Disease Susceptibility Genes Coexpressing Multiple Circadian Genes with High Multiple Correlation Factor (R2 > 0.7)
We summarized gene function from published literature. NALCN codes proteins as a component of the voltage-independent, nonselective cation channel, which plays an important role in resting sodium permeability for normal respiratory rhythm (Wang and Ren, 2009). It works with UNC80 to activate the leak cation channel in a G-protein-independent manner (Lu et al., 2007). M3 muscarinic receptors control this ion channel in pancreatic beta cells. NALCN could also respond to tetrodotoxin, which was implicated to be involved in neuronal excitability (Aslam, 2009). PPP2R2C is located in human chromosome 4p16, which is a brain abundant protein (Hu et al., 2000). Mutation in PPP2R2C leads to intellectual disability (Backx et al., 2010). It acts as a suppressor of tumorigenesis and as a regulatory subunit of the PP2 complex, which is particularly induced by viral transformation (Banerjee et al., 2007). COFILIN works in cell migration as it affects F-actin fibers and cell membrane (Ashworth et al., 2010). Dephosphorylation and activation of cofilin could control actin reorganization and polymerization (Wang et al., 2010).
This gene activity is associated with Aur-A overexpression in breast cancer tissues (Eijgelsheim et al., 2010). MYH7 has been identified with SNPs associated with resting heart rate in recent studies (Eijgelsheim et al., 2010). In Laing distal myopathy, tail mutation in MYH7 leads to myopathic profiles (Muelas et al., 2010). In embryonic and neural stem cells, MELK is a marker for cell survival, proliferation, and apoptosis (Choi and Ku, 2011). In general, the relationship between the CHD susceptibility genes and circadian rhythm is unclear. Our results provide the first clue for this interaction.
3.5. Circadian-related genes
Then, β factors, which are coefficients of circadian-related genes, were analyzed to reveal all possible linear combinations of circadian-related gene expression (Fig. 3D). Top four combinations were further collected in terms of high R2 and statistical significance such as CELF5, NALCN, PPP2R2C, and TUBA1C (Fig. 4 and Table 2). Top two circadian-related genes with positive β factor coefficients were selected to make the linear combination. These are GNAO1 (2775) and PRKCG (5582), PRKG1 (5592) and GNAO1, ADCYAP1R1 (117) and GNAO1, and RBX1 (9978) and GNB1 (2782) for CELF5, NALCN, PPP2R2C, and TUBA1C, respectively. Using two circadian-related genes, we predict the output of the linear combination. Compared with true values of CHD susceptibility genes, the linear combination could provide significant prediction (Fig. 5). Thus, in each multiple correlation, these four CHD susceptibility gene expression levels could be correlated with a combination of two circadian-related genes.
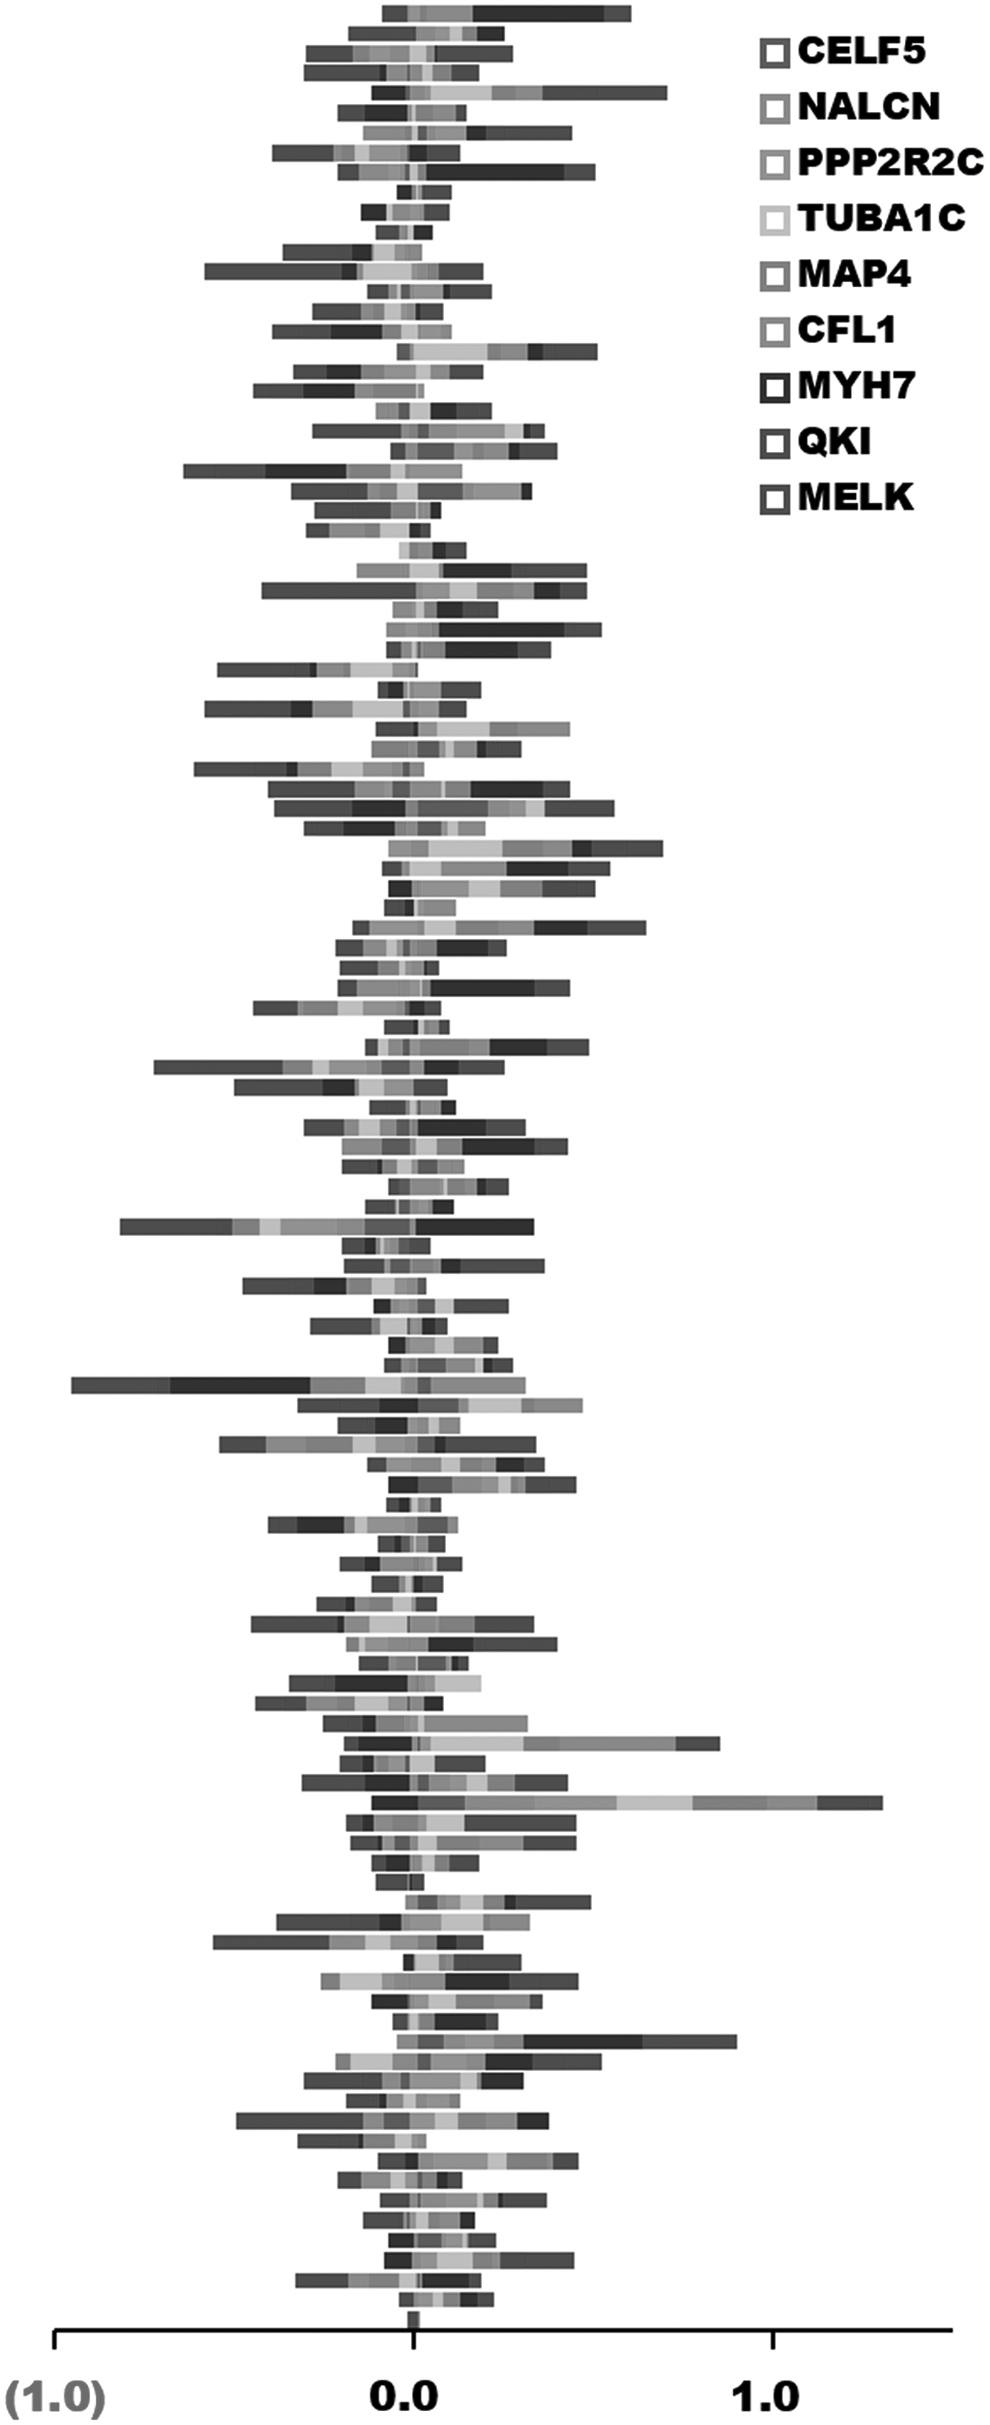
Coefficient for circadian genes with high correlation factors (R2 > 0.7).
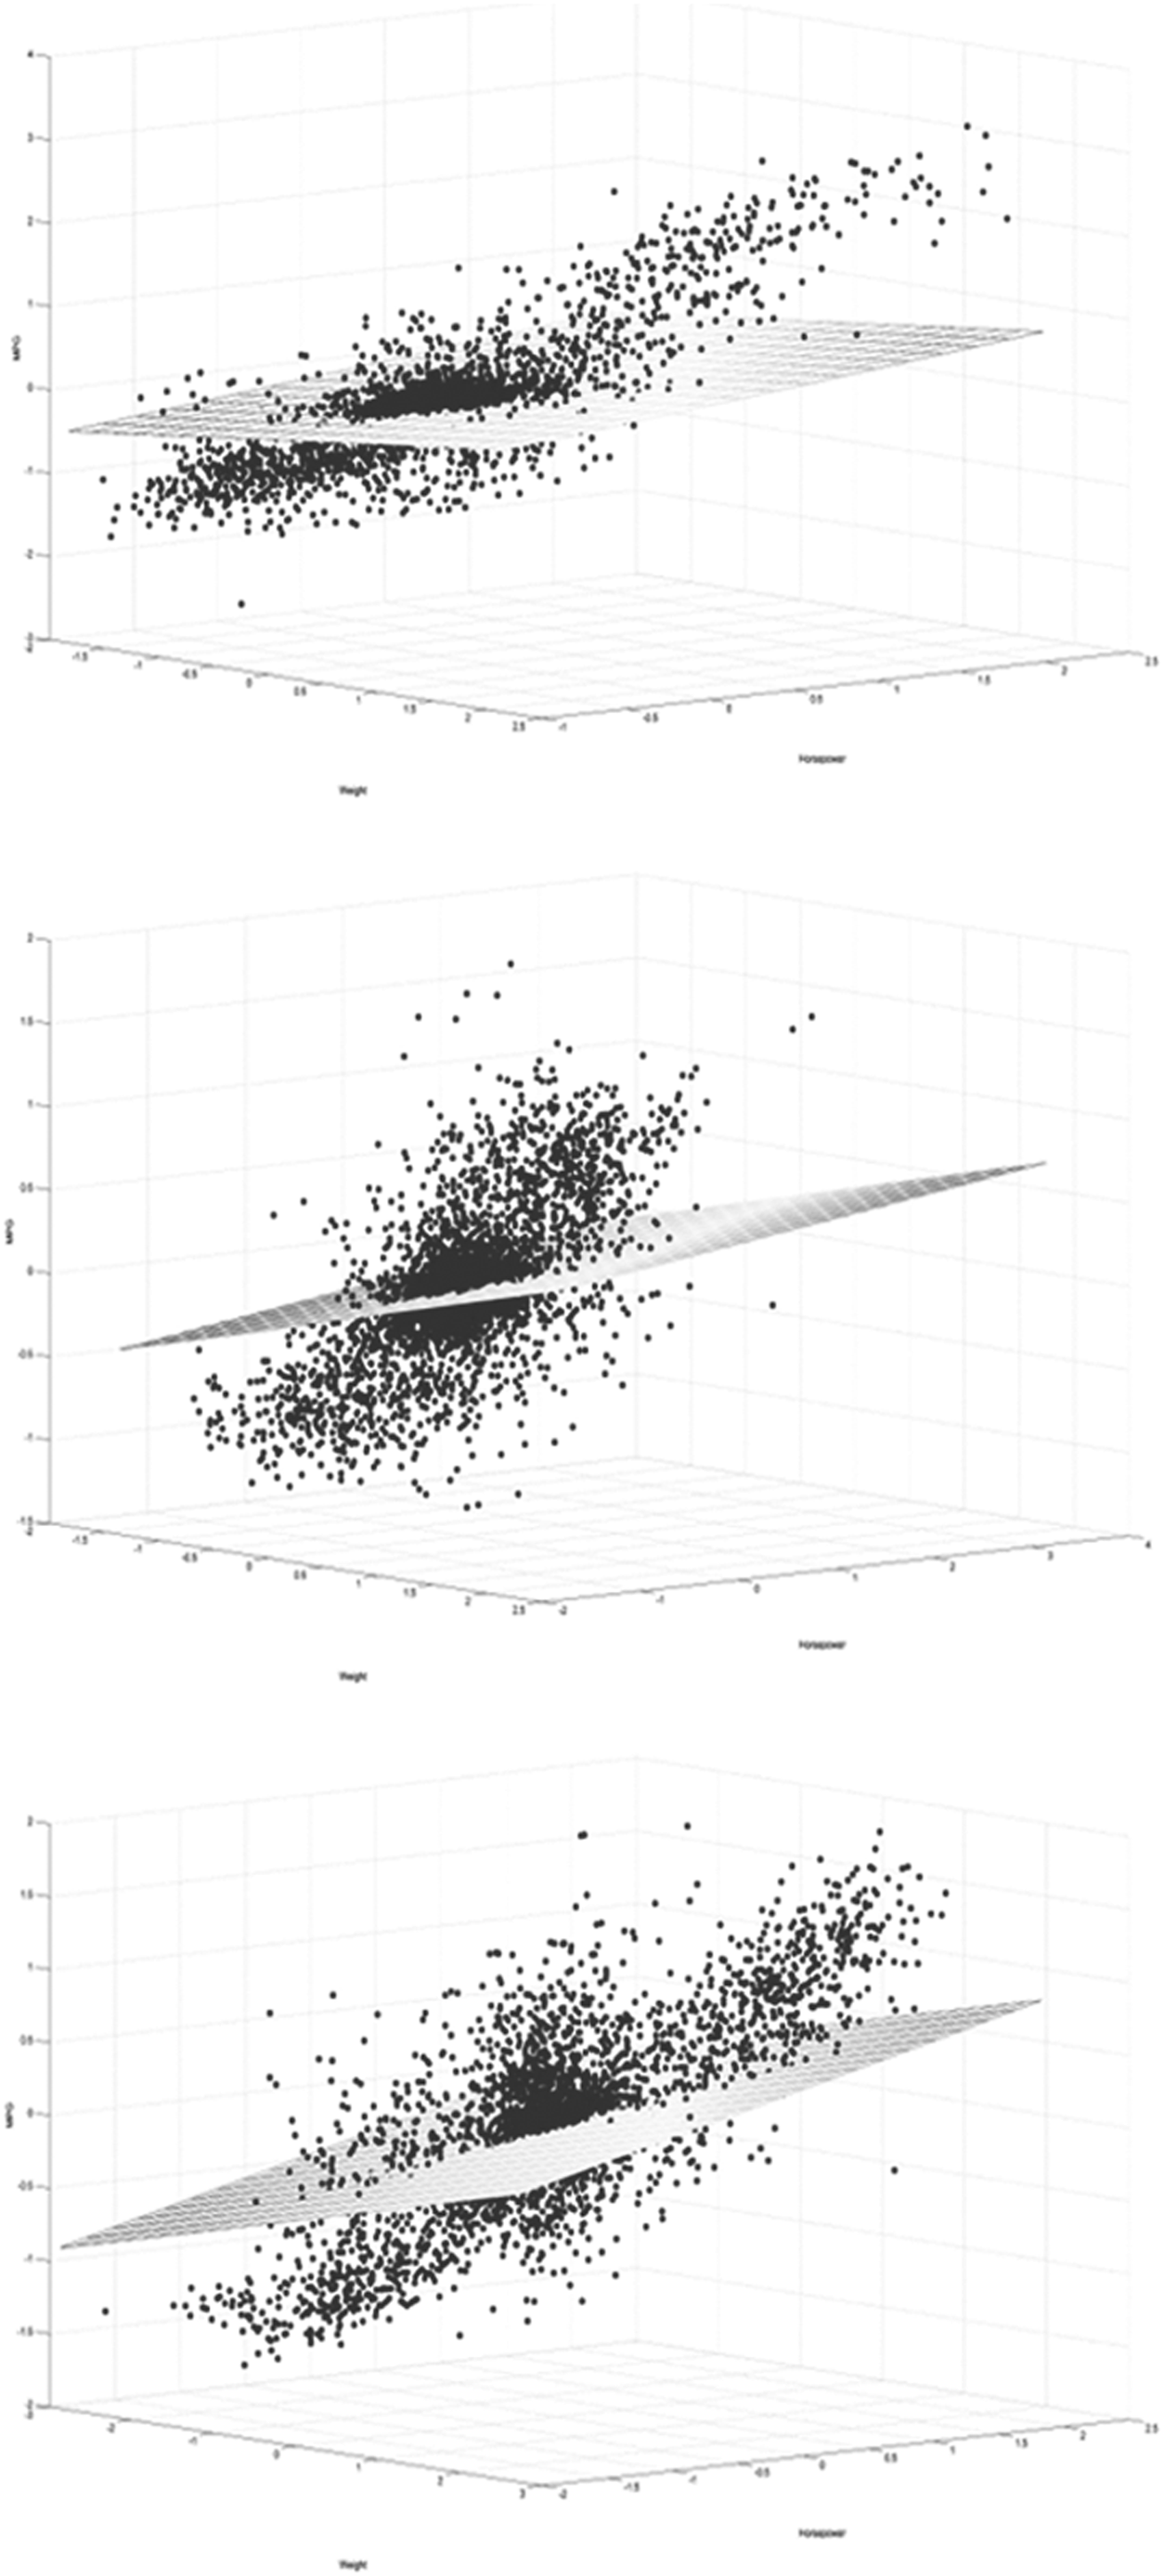
Multiple correlations predicted the expression. The scatter points are the true levels of gene expression, the net is predicted by linear regression of multiple correlations.
Multiple Correlation Coefficient of Coronary Heart Disease Susceptibility Genes as Linear Combinations to Coexpress with Circadian Genes
CHD, coronary heart disease.
GNAO1 encoded a component of the Go heterotrimeric G-protein signal-transducing complex, which plays a role in early-onset epileptic encephalopathy. In addition, studies found that GNAO1 mutation variants cause severe developmental delay that is associated with epileptic encephalopathy (Saitsu et al., 2016). Infantile-onset epilepsy has been proved to be the result of a missense mutation in GNAO1 in a clinical investigation (Law et al., 2015). Deep brain stimulation is related to the GNAO1 mutation in progressive dyskinesia (Kulkarni et al., 2016). Importantly, recent studies revealed the relationship between GNAO1 and CHD. Cardiac ventricular excitability is regulated by GαO-mediated signaling. Furthermore, cardiovascular reflexes require GαO-mediated signaling in the rostral ventrolateral medulla oblongata. There is a circuit comprising GαO-mediated signaling and RVLM, which plays the role of autonomic regulator of the heart. Mutation in GαO has a significant effect on cardiovascular-related processes such as responses to stress and electrical properties (Richard et al., 2016).
PRKCG belongs to the serine- and threonine-specific protein kinase family, which plays a key role with calcium and second messenger diacylglycerol. Research on osteosarcoma risk revealed an interaction between PRKCG and osteosarcoma. Its susceptibility could be affected by PRKCG SNP (Zhang et al., 2014; Lu et al., 2015). In the mouse model, Purkinje cell pathology is induced by overactivation of PRKCG (Ji et al., 2014). The role of PRKCG in CHD has been revealed in recent studies on hypobaric hypoxia-induced cardiac hypertrophy in rats (Uenoyama et al., 2010). In addition, PRKCG is involved in regulation of signaling in mouse coronary artery smooth muscle cells (Ansari et al., 2009). It was shown that PRKCG could be a candidate controller of contractility and heart failure susceptibility (Liu and Chen, 2009). Furthermore, human coronary microcirculation requires PRKCG to mediate microvascular reactivity (Sodha et al., 2007). Myocyte contractility after cardioplegic arrest also requires PRKCG function (Mukherjee et al., 2006).
PRKG1 works in the nitric oxide/cGMP signaling pathway and many signal transductions. In pancreatic adenocarcinoma, an early-onset thoracic aortic disease, mutation on PRKG1 has been shown as a genetic marker (Karakhanova et al., 2014; Gago-Díaz et al., 2016). It was also believed that PRKG1 participates in CHD by certain mechanisms such as cardioprotection through prevention of PKG1α oxidation (Lawliss et al., 2015). Pulmonary vascular tone and hypoxic pulmonary hypertension are currently proved to be related to PRKG1 (Ramchandran et al., 2014). In cardiomyocytes, PRKG1 could affect cardiac hypertrophy through inhibiting apoptosis signaling (Fiedler et al., 2006; Lukowski et al., 2010).
ADCYAP1R1 is a homologous gene of the glucagon/secretin receptor family with an important role in the fear responses of the amygdala and hippocampus (Stevens et al., 2014). There is significant interaction between ADCYAAP1R1 and CHD. Deficiency of ADCYAAP1R1 in mice leads to pulmonary hypertension and right heart failure (Otto et al., 2004). Guinea pig cardiac neuron excitability could be induced by ADCYAAP1R1 through internalization and endosomal signaling (Merriam et al., 2013). It was well known that ADCYAAP1R1 is involved in activation of MEK/ERK signaling to induce guinea pig cardiac neuron excitability (Tompkins et al., 2016).
RBX1 is involved in ubiquitination processes by interaction with cullin proteins for cell cycle progression in which mutation could cause hypertension and hyperkalemia (Schumacher et al., 2015). Nonmuscle-invasive bladder transitional cell carcinoma showed overexpression of RBX1 (Wei et al., 2013). Nonsmall cell lung cancer also takes RBX1 as a prognostic factor (Xing et al., 2016). Related to CHD is hyperosmotic stress of salmon induced by RBX1 expression (Pan et al., 2002). It also controls pulmonary arterial hypertension through Ca2+ signaling.
GNB1 is a heterotrimeric guanine nucleotide-binding protein with function in signals between receptors and effectors. Recent studies suggested that it could be a target of urocortin-mediated cardioprotection (Barry et al., 2010).
3.6. Validation
To validate in silico results by multiple correlation analysis, we performed qRT-PCR to check four expression levels of CHD susceptibility genes after transient expression of a combination of multiple correlated circadian-related genes in 293 cells. First, each circadian-related gene was separately transiently overexpressed by transfection. Then, two circadian-related genes were treated at the same time. Results showed that the expression of CEFL5 was increased about 2 times when 293 cells overexpressed 2775 (GNAO1) or 5582 (PRKCG) only. It was increased 7 times when 293 cells overexpressed both 2775 (GNAO1) and 5582 (PRKCG) (Fig. 6A). In another case, the expression of either 5592 (PRKG1) or 2775 (GNAO1) was induced, and NALCN expression was not increased (Fig. 6B). While expression of TUBA1C was increased about 3 times when 293 cells overexpressed only 9978 (RBX1) or 2782 (GNB1), it was increased 6 times when 293 cells overexpressed both 9978 (RBX1) and 2782 (GNB1) (Fig. 6C). The expression levels of CEFL5 and TUBA1C matched with multiple correlation analysis results. It indicates that there is transcriptional regulation from 2775 (GNAO1) and 5582 (PRKCG), 9978 (RBX1) and 2782 (GNB1), to CEFL5 and TUBA1C, respectively.
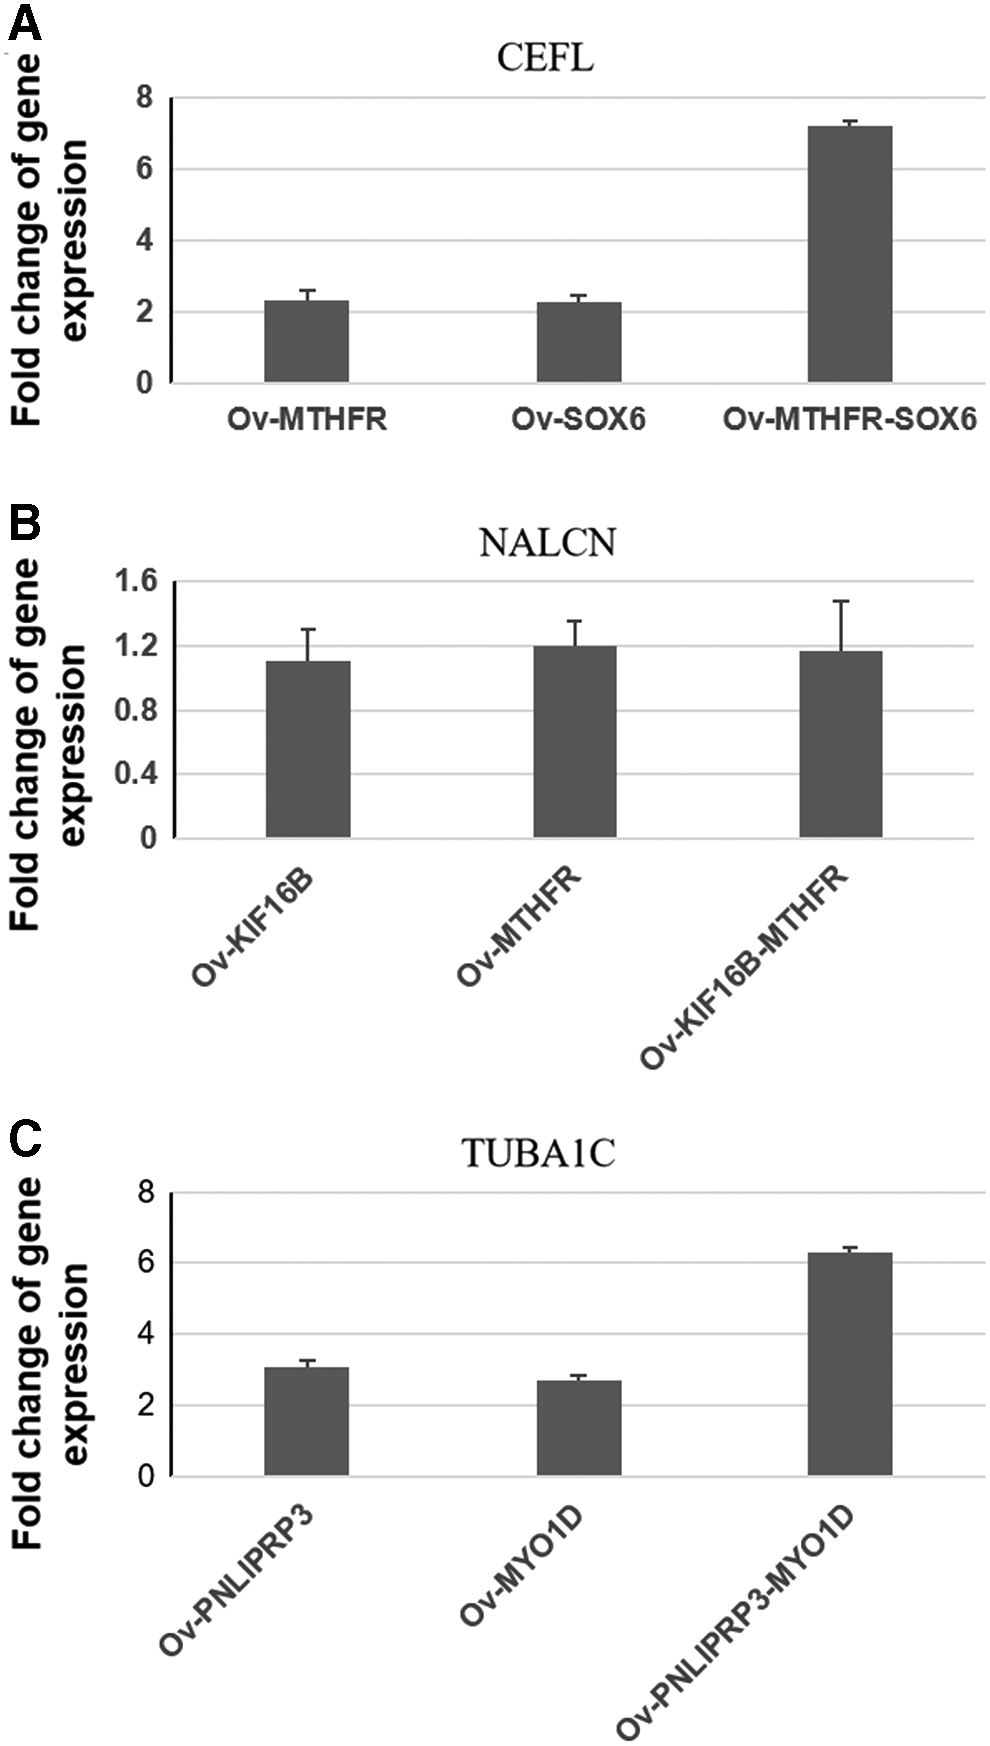
Validation of multiple correlations by RT-PCR after transient expression of combination gene sets.
Furthermore, this regulation could be added by combining two circadian-related genes. On the other side, expression of NALCN does not meet the prediction from multiple correlation analysis. That could be caused by the different down–upstream position or other actual errors in the experiments. However, multiple correlation analysis could provide an insight into the combination of transcriptional regulation. This will benefit detailed construction of gene interaction between CAD susceptibility genes and circadian-related genes.
Footnotes
Author Disclosure Statement
The authors declare they have no financial conflicts of interest.
References
Supplementary Material
Please find the following supplemental material available below.
For Open Access articles published under a Creative Commons License, all supplemental material carries the same license as the article it is associated with.
For non-Open Access articles published, all supplemental material carries a non-exclusive license, and permission requests for re-use of supplemental material or any part of supplemental material shall be sent directly to the copyright owner as specified in the copyright notice associated with the article.