




Abstract
Abstract
RNA-RNA interactions are key mechanisms through which noncoding RNA (ncRNA) regions exert biological functions. Computational prediction of RNA-RNA interactions is an essential method for detecting novel RNA-RNA interactions because their comprehensive detection by biological experimentation is still quite difficult. Many RNA-RNA interaction prediction tools have been developed, but they tend to produce many false positives. Accordingly, assessment of the statistical significance of computationally predicted interactions is an important task. However, there is no method to evaluate the statistical significance of RNA-RNA interactions that is applicable to interactions between two long RNA sequences. We developed a method to calculate the p-value for the minimal interaction energy between two long RNA sequences. The developed method depends on the fact that minimum interaction energies of RNA-RNA interactions between long RNAs follow a Gumbel distribution when repeat sequences in RNAs are masked. To show the usefulness of the developed method, we applied it to whole human 5′-untranslated region (UTR) and 3′-UTR sequences to detect novel 5′-UTR-3′-UTR interactions. We thus identified two significant 5′-UTR-3′-UTR interactions. Specifically, the human small proline-rich repeat protein 3 shows conserved 5′-UTR-3′-UTR interactions with some nucleotide variations preserving base pairings among primates. Our developed method enables us to detect statistically significant RNA-RNA interactions between long RNAs such as long ncRNAs. Statistical significance estimates help in identification of interactions for experimental validation and provide novel insights into the function of ncRNA regions.
1. Introduction
R
Although several experimental methods to infer RNA-RNA interactions have been developed (Engreitz et al., 2014; Lu et al., 2016; Nguyen et al., 2016), computational prediction of RNA-RNA interaction is still an essential technique. At present, many RNA-RNA interaction prediction tools have been developed (Tafer et al., 2011; Alkan et al., 2017; Kato et al., 2017; Mann et al., 2017). These programs output optimal or suboptimal interactions under optimization conditions of each program. As such, even when RNA pairs that do not interact [e.g., pairs of randomly generated RNA sequences (Tjaden et al., 2006)] are given as input data, these programs output interactions that are optimal or suboptimal solutions in input sequences. To eliminate likely false-positive interactions, a cutoff method based on a threshold score is frequently used. However, selection of an appropriate cutoff score is a difficult task, so this method may be highly arbitrary. Although some tools (Rehmsmeier et al., 2004; Tjaden et al., 2006; Wright et al., 2013) can assess the statistical significance of detected RNA-RNA interactions, these programs can be applied to only small RNAs and cannot be used to assess interactions between long RNAs.
In the assessment of statistical significance, there are at least four distinctions between short and long RNA interactions. The first issue is the consideration of repeat sequences. Repeat sequences are generally masked in sequence alignments because they are frequently aligned to nonhomologous regions, which produce incorrect homology predictions. On the other hand, the simple complementary of repeat sequences between two RNAs may make them important components of RNA-RNA interactions (Johnson and Guigó, 2014). While we need not pay attention to repeat sequences in RNA-RNA interaction predictions for short RNA because they do not include repeat sequences, we cannot ignore the effect of repeat sequences in the prediction of interactions between long RNAs because some of the repeat sequences are actually involved in RNA-RNA interactions between long RNAs (Gong and Maquat, 2011). However, by having the repeat sequences available for RNA-RNA interaction, the null distribution of RNA-RNA interaction scores may not follow the theoretical statistical distribution because these elements strongly decrease sequence randomness. Therefore, we have to investigate how the null distribution changes depending on whether repeat sequences are included in RNA-RNA interaction predictions.
The second issue is sequence length. While sequence lengths of short RNAs are approximately uniform and consist of several tens of bases, those of long RNAs are highly diverse, ranging from 200 bases to several tens of thousands of bases. Therefore, we have to consider the influence of differences in sequence lengths on null distribution. The third issue is the maximal span parameter. When considering the secondary structure of long RNAs, researchers generally restrict maximal spans between bases that form base pairs to reduce the computation time (Bernhart et al., 2006; Kiryu et al., 2008; Lange et al., 2012). As short maximal spans prevent the formation of intramolecular RNA secondary structures, this parameter should influence the potential for forming intermolecular RNA-RNA interactions. The fourth issue is the inequality in lengths of the two RNA sequences. In sequence alignment, the configurations of null distribution change as the lengths of two sequences become unequal (Altschul and Erickson, 1986). We have to investigate whether this trend also occurs in RNA-RNA interactions.
In the present study, we developed a method for assessing statistical significance of RNA-RNA interactions between two long RNA sequences. As the criterion for determining whether two RNA regions interact, we used interaction energy, which was calculated as the summation of hybridization energy and accessibility energy. In brief, hybridization energy is the stabilized energy based on intermolecular base pairs, and accessibility energy is the energy required to inhibit the regions from forming intramolecular stem structures. When several local RNA-RNA interactions were detected between two RNAs, we used an interaction with the minimum interaction energy. We first investigated influences of the aforementioned four factors on the null distribution of minimum interaction energies. Next, we implemented the method to evaluate the statistical significance of predicted RNA-RNA interactions between two long RNAs. Then, to validate usefulness of our developed method, we investigated whether novel human 5′-3′ UTR interactions were detected by our method. Our approach discovered a likely 5′-3′ UTR interaction associated with the small proline-rich repeat protein 3 (SPRR3), which shows conservation with some nucleotide variations preserving base pairings among primates.
2. Methods
2.1. Method for evaluating the null distribution of minimal interaction energy between two ribonucleic acid sequences
To evaluate whether minimal interaction energy between two RNA sequences is statistically significant, a null distribution of energies is required. In other words, we have to calculate the minimal interaction energies between many unrelated RNA pairs and specify a distribution function of these energies. In this research, for each experiment, we randomly cut out 6000 RNA sequences with certain sequence lengths from long noncoding RNA (lncRNA) transcripts annotated by Gencode, ver.25 (Harrow et al., 2012), and created 3000 RNA pairs from these 6000 RNA sequences. The reason for choosing lncRNA is as follows. LncRNA has a low expression level and shows a tissue-specific expression pattern (Cabili et al., 2011; Iwakiri et al., 2017) and thus the number of true lncRNA-lncRNA interactions should be limited. Actually, there are few experimentally verified lncRNA-lncRNA interactions at present (Nguyen et al., 2016). Therefore, the generated dataset should contain almost no true interacting RNA pairs. We used the longest lncRNA transcript for each lncRNA gene when the lncRNA gene has several splicing isoforms.
Then, we applied the RIblast program to these RNA pairs (Fukunaga and Hamada, 2017). RIblast is currently the only program to predict RNA-RNA interactions in long RNAs using accessibility energy. We used only an interaction with minimum interaction energy among the detected local interactions for each RNA pair. We set the seed length parameter, interaction energy threshold, and output energy threshold of RIblast to 3, 0.0, and 0.0, respectively, to enumerate as many interactions as possible. The other RIblast parameters were set to default values unless otherwise specified. Note that RIblast uses a maximal span parameter W to calculate accessibility energies (Kiryu et al., 2011). Next, we investigated whether the empirical distribution for absolute values of calculated minimum interaction energies fits a Gumbel distribution, an extreme value distribution that is widely used in bioinformatic applications (Smith et al., 1985; Altschul and Erickson, 1986; Rehmsmeier et al., 2004; Tjaden et al., 2006). The cumulative distribution function F(x) is defined as
The location parameter
where v, u, and
First, we investigated the influence of repeat sequences. When we included repeat sequences in the analysis, we randomly cut out, 400-nucleotide, 6000 RNAs from lncRNA transcripts and executed RIblast without masking repeats. When we masked repeat sequences, 6000 sequences were randomly cut out from lncRNA transcripts, so that the length of the nonrepeat region was 400 bases, and conducted RIblast with hard masking of repeats. Note that sequence lengths of these sequences were 400 bases or more when including repeats, and Supplementary Figure S1 shows the distribution of the total sequence lengths. Annotation of the GRCh38 assembly in the UCSC genome browser database was used as the repeat sequence annotation (Tyner et al., 2017). In addition, tandem repeats were further annotated using TANTAN (r = 0.02) (Frith, 2010).
Next, we investigated influences of the sequence length and maximal span W on the shape of null distribution. We used six sequence lengths between 100 and 800 and 15 maximal span values between 0 and 300. Then, we created 3000 RNA pairs for each length. Note that we used the same dataset for different maximal span values to ignore the influence based on the difference of datasets. In these experiments, the sequence length means the length of the nonrepeat region and RIblast was executed with hard masking of repeats.
Finally, we inspected the effect of uneven lengths of the two RNA sequences on the configuration of the null distribution. We used four sequence length pairs such that the product of lengths of the two sequences was uniform: (360, 360), (240, 540), (180, 720), and (120, 1080). Then, we created RNA pairs for each sequence length pair. In this study, the sequence length refers to the length of the nonrepeat region, and we used RIblast with hard masking of repeats.
2.2. Evaluation method for the p-value calculation method
We investigated whether distribution of p-values, which are obtained by our developed p-value calculation method, from the random dataset follows uniform distribution. We randomly cut out 6000 sequences from lncRNA transcripts and created 3000 RNA pairs. In this study, sequence lengths were randomly determined from 100 to 1000 nt for each pair. We obtained minimum interaction energy for each pair using RIblast and applied the p-value calculation method to the minimum interaction energies. We used four maximal span values between 50 and 200 and compared the shape of p-value distributions with that of uniform distribution using the QQ plot. Note that two sequence lengths in a pair are the same, and we used the same dataset for different maximal spans.
2.3. Method for detecting 5′-3′ untranslated region interactions
We applied our statistical significance assessment method for RNA-RNA interaction to the detection of novel 5′-3′ UTR interactions. We created a positive dataset of human 5′-3′ UTR pairs as follows. First, to mask tandem repeats, we applied TANTAN (r = 0.02) to human genome (GRCh38) in the UCSC genome browser database while preserving preannotated repeats. Next, we extracted all UTR regions annotated by Gencode, ver.25, from the genome sequence. In this study, we used UTR pairs with the largest sum of sequence lengths of 5′-UTR and 3′-UTR for each gene when genes have multiple UTR annotations. However, for the TP 53 gene, we used an ENST00000610292.4 transcript, which is a transcript containing a known 5′-3′ UTR interaction region (Chen and Kastan, 2010). Finally, by excluding UTR pairs of which the nonrepeat region lengths of either UTR were less than 100 bases, we obtained 12,839 UTR pairs. We applied RIblast with repeat hard-masking style to the obtained whole UTR pairs and calculated the p-value of the minimum interaction energy for each UTR pair. All RIblast parameters were set to the default parameter. We used the Benjamini–Hochberg method for controlling false discovery rates (FDRs) under multiple hypothesis testing (
3. Results
3.1. Parameter estimation of null distribution of minimum interaction energy
First, we investigated the dependence of null distribution of minimum interaction energy on consideration of repeat sequences (Fig. 1). We verified that the empirical null distribution corresponds reasonably well with the Gumbel distribution when we masked repeat sequences (Fig. 1A, C, E). However, when we included repeat sequences in the analysis, the null distribution did not follow the Gumbel distribution as a consequence of extremely low interaction energy (Fig. 1B, D, F). These results suggest that we can assess statistical significance of minimal interaction energies based on the Gumbel distribution when repeat sequences are masked, but not when repeat sequences are included in the analyses. Accordingly, we excluded repeat sequences in the following analysis.

The influence of repeat sequences on the shape of the null distribution of minimum interaction energies.
Second, we evaluated the effect of sequence length and maximal span W on parameters of the Gumbel distribution. We first found that null distribution does not follow Gumbel distribution when the maximal span is small (W = 0 or 10; Supplementary Figs. S2–S4). This reason is probably explained by the following observations. Small maximal spans ignore accessibility energies and thus tend to form long, local base-pairing interactions (Supplementary Fig. S5). As the length of the interaction region with minimum interaction energy approaches the total sequence length, the minimum interaction energy may no longer be an extreme value from many independent samples. Therefore, we set the maximal span parameter to 20 and over in the following analysis. We verified that null distribution follows Gumbel distribution regardless of the sequence length and maximal span when the maximal span was set to 20 and more (Supplementary Figs. S2–S4).
Next, we investigated the Gumbel distribution parameters for 78 combinations of sequence lengths and maximal spans using the moment method (Tables 1 and 2). When we investigated the dependence of the parameters
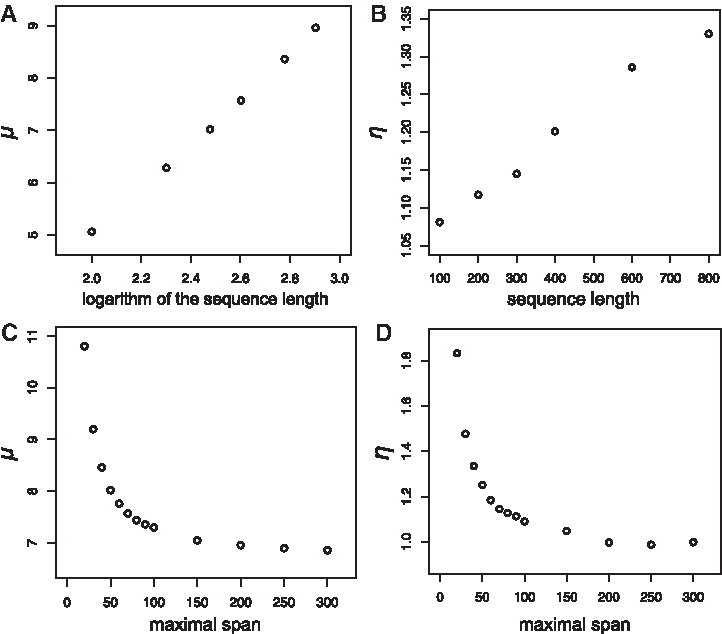
The effect of the maximal span parameter W and the sequence length on Gumbel distribution parameters.
Third, we checked the influence of uneven lengths of two RNA sequences on the Gumbel distribution parameters. Supplementary Table S1 shows the estimated parameters
3.2. The calculation method of statistical significance
Based on the above analysis results, we constructed a method to calculate the p-value for the minimal interaction energy in RNA-RNA interactions between long RNAs as follows. We defined N and M as the lengths of two RNA sequences and e as the minimum interaction energy. In addition, we defined W as the maximal span parameter used when assessing RNA-RNA interactions. Additionally,
We evaluated the correctness of our developed p-value calculation method. Figure 3A–D shows the QQ plot between theoretical uniform distribution and distribution of obtained p-values from the random dataset for various maximal span values. We verified that the plot is on the diagonal and thus the distribution of obtained p-values follows uniform distribution for all maximal span values.
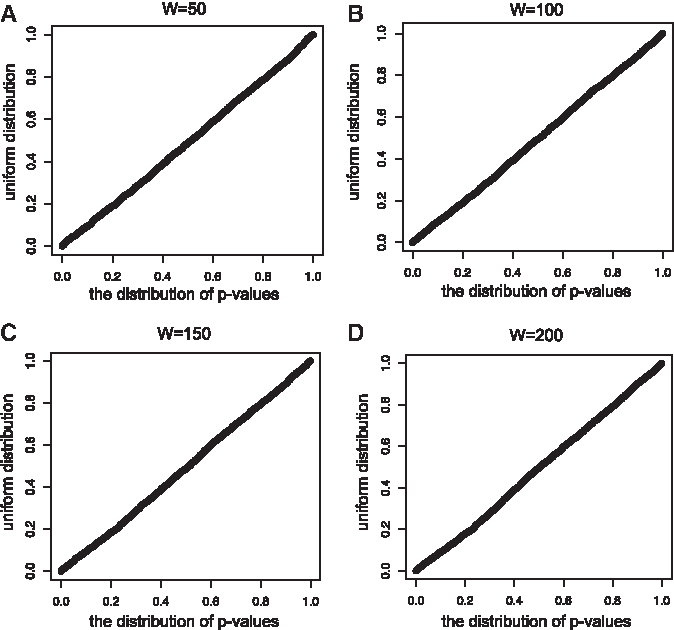
The QQ plot between empirical distribution of p-values and the uniform distribution. The x-axis represents calculated p-values, and the y-axis represents sampled values from the uniform distribution. If the plots are arranged on the y = x, empirical distribution of p-values follows uniform distribution. The maximal span values were
The source code for the p-value calculation method is freely available at https://github.com/fukunagatsu/RIblast_pv
3.3. Detection of novel 5′-3′ untranslated region interactions
We showcase one application that demonstrates the usefulness of our method for assessing the statistical significance of RNA-RNA interactions between long RNAs. While eukaryotic mRNAs generally form circular structures through the interaction between the 5′ CAP structures and 3′ poly-A tails (Wells et al., 1998), some mRNAs have another circularization mechanism, 5′-3′ UTR interaction based on complementary base parings. Although this mechanism has been frequently reported in RNA viruses (Nicholson and White, 2014) and bacteria (de los Mozos et al., 2013), there are few reports in eukaryotes. The only experimentally confirmed example among human mRNAs is the TP53 mRNA, in which the 5′-3′ UTR interaction region exerts translational regulation (Chen and Kastan, 2010). In the present study, we tried to detect novel human 5′-3′ UTR interactions using our method.
When we controlled the FDR using the Benjamini–Hochberg method (

Visualization of statistically significant UTR-UTR interactions.
4. Discussion and Conclusion
We developed a p-value calculation method for predicting interactions between two long RNAs. Our method utilizes the Gumbel distribution, which matches empirical null distribution of minimum interaction energies of RNA-RNA interactions. Using our method, we predicted comprehensive human 5′-3′ UTR interactions, and we found that UTR interactions involving SPRR3 are conserved among primates with some substitutions preserving base pairings.
While we focused on minimum interaction energy in this research, recent studies have reported that the summation of interaction energies of all detected local interactions between two RNAs is an effective predictor of long ncRNA interactions (Terai et al., 2016; Iwakiri et al., 2017). These studies emphasized the importance of a statistical significance assessment method for the summed interaction energies. Karlin and Altschul developed a p-value calculation method for the sum of the local sequence alignment scores of multiple regions (Karlin and Altschul, 1993). However, because they assumed that each segment is independent of other segments, we cannot directly apply this method to RNA-RNA interaction predictions because a region may interact with multiple sites. More work is needed to overcome this complication.
Although our method identified two human 5′-3′ UTR interactions, we could not recover the known TP53 5′-3′ UTR interactions. This is because the interaction region in TP53 is relatively short and thus the interaction energy is relatively large (Chen and Kastan, 2010). In addition, we excluded repeat sequences in the analysis, but there may be functional UTR-UTR interactions occurring through the repeat sequences of expressed transcripts. As such, we presume that functional UTR-UTR interactions are more widespread in the human transcriptome than indicated by the analysis in this research. The development of a more sensitive bioinformatic method for RNA-RNA interaction predictions is an important research topic.
Footnotes
Acknowledgments
This work was supported by JSPS KAKENHI, Grant Numbers JP16J00129 and JP17H05605 to T.F. and JP16H05879 to M.H. Computations in this research were performed using the supercomputing facilities at the National Institute of Genetics in Research Organization of Information and Systems.
Author Disclosure Statement
The authors declare that no competing financial interests exist.
References
Supplementary Material
Please find the following supplemental material available below.
For Open Access articles published under a Creative Commons License, all supplemental material carries the same license as the article it is associated with.
For non-Open Access articles published, all supplemental material carries a non-exclusive license, and permission requests for re-use of supplemental material or any part of supplemental material shall be sent directly to the copyright owner as specified in the copyright notice associated with the article.
