
Abstract
Abstract
To identify signature genes for the pathogenesis of cancer, which provides a theoretical support for prevention and early diagnosis of cancer. The pattern recognition method was used to analyze the genome-wide gene expression data, which was collected from the The Cancer Genome Atlas (TCGA) database. For the transcription of invasive breast carcinoma, lung adenocarcinoma, lung squamous cell carcinoma, colon adenocarcinoma, renal clear-cell carcinoma, thyroid carcinoma, and hepatocellular carcinoma of the seven cancers, the signature genes were selected by means of a combination of statistical methods, such as correlation, t-test, confidence interval, etc. Modeling by artificial neural network model, the accuracy can be as high as 98% for the TCGA data and as high as 92% for the Gene Expression Omnibus (GEO) independent data, the recognition accuracy of stage I is more than 95%, which is higher compared with the previous study. The common genes emerging in five cancers were obtained from the signature genes of seven cancers, PID1, and SPTBN2. At the same time, we obtain three common pathways of cancer by using Kyoto Encyclopedia of Genes and Genomes' pathway analysis. A functional analysis of the pathways shows their close relationship at the level of gene regulation, which indicted that the identified signature genes play an important role in the pathogenesis of cancer and is very important for understanding the pathogenesis of cancer and the early diagnosis.
1. Introduction
C
The occurrence of cancer is a complicated process involving a variety of gene mutations, which are closely related to genetics and environment, and are the common result of the interaction of many factors. With the rapid development of microarray sequencing and bioinformatics, it can detect the expression of thousands of genes by gene chip, to understand the expression of patient-specific spectrum, and provides technical assurance for the system research of cancer-related genes, and thus become a routine technique in the field of cancer research (Bhattacharjee et al., 2001).
However, how to interpret tumor gene expression data still needs further demonstration. So far, there are many reports on the analysis of tumor gene expression data (Alon et al., 1999; Bittner et al., 2000; Furey et al., 2000; Ressom and Wang, 2003; Gao and Church, 2005; Tasoulis et al., 2006; Fernandez and Balzarini, 2007; Sheng et al., 2010). Li et al. (2014) proposed a Locally Linear Representation Fisher Criterion method based on the Locally Linear Embedding method and the Fisher discriminant criterion, which were successfully applied to five different categories of cancer gene expression data classification. The accuracy of identification for diffuse large B cell lymphomas and follicular lymphoma datasets was 93.83%, that of glioma was 78.31%, and that of prostate cancer was 88.97%. The identification accuracy of lymphocyte leukemia was 98.32%, and that of central nervous system was 98.01%. Simjanoska et al. (2014) put forward a new Bayesian model for staging of colorectal cancer prediction problem. In the experiment, 138 genes that were significantly differentially expressed in colon cancer and adjacent tissues were screened by using colorectal gene expression data of Affymetrix and Illumina. Based on these genes, a Bayesian model was used to predict the gene expression and the sensitivities of stage I in the two prior probability group, which were 0.971 and 0.846, respectively.
In the past 2 years of research, there has been a great progress in the screening of the signature genes. Xie et al. (2016) used feature selection method combined with discernibility and independent scores of variables for efficient and accurate feature selection. According to gene expression data for breast cancer identification, the ability of all different genes in accordance with the identification ability from large to small sort, screened a group of 10 gene clusters, which can well distinguish between breast cancer tissue and normal tissue (accuracy rate of 85.32%). Ghadiri et al. (2016) proposed a classification method combining partial least squares (PLS) and linear discriminant analysis (LDA) for classification of cancers. For gene expression data of lung cancer, after preprocessing, PLS was used for data reduction and feature selection, then LDA was used to classify, 214 genes were screened out from more than 50,000 genes, and the classification accuracy was 94.5%.
The above studies are related to the gene expression of a single type of cancer pathogenesis and development-related research. In this article, the information of gene expression profiles is studied from the whole genome level, starting from microarray data, using bioinformatics technology to a variety of cancers for modeling and forecasting, comprehensive search for cancer characteristics' related genes, with the aim to further reveal cancer pathogenesis, and new targeting drug development laid a theoretical basis.
2. Data and Methods
2.1. Data and preprocessing
The data used in this article was obtained from The Cancer Genome Atlas (TCGA) database (https://cancergenome.nih.gov/). Thirty-eight types of cancer clinical data and information data were downloaded from the TCGA database, using python programming language to integrate the patient's expression profile and clinical information. To ensure sufficient data in follow-up analysis, the cancer type, the number of adjacent and stage I samples of more than 40 were selected, they are: invasive breast carcinoma, lung adenocarcinoma, lung squamous cell carcinoma, colon adenocarcinoma, renal clear-cell carcinoma, thyroid carcinoma, and hepatocellular carcinoma. For the convenience of follow-up study, we delete the gene whose expression value is null in all the samples, and finally obtain the information of seven kinds of cancer as shown in Table 1.
Since the data of gene expression are quite different, it is necessary to normalize the expression spectrum data to facilitate the later modeling and rapid convergence of training. The interval is [0,1], and the formula is as follows
Among them, x is the expression value of a gene in each sample,
2.2. Screening of signature genes
In this article, the classification problem is a common dichotomous model. However, due to the fact that the dimension of the feature is much larger than the number of samples, and the relationship between the features is relatively complicated, many problems arise in the study. For example: analysis data and training model time are long, and a large amount of data lead to “dimensionality disaster,” making the model too complicated and so on. To overcome the influence of these adverse factors and improve the accuracy of feature recognition, we adopt various statistical methods to combine them to form a set of process of feature gene screening.
1. Correlation filter. Correlation analysis refers to the analysis of two or more correlated variable elements to measure the correlation degree of the two variable factors, expressed by the correlation coefficient r. The common correlation coefficient is the Pearson correlation coefficient, which indicates the linear correlation between two continuous random variables. However, for the discrete variables that do not obey the normal distribution can no longer be described by the Pearson Correlation Coefficient. In this case, we can use the rank correlation to describe the degree and direction of the correlation between the two variables. In our study, the Spearman correlation coefficient was used to describe the association of gene expression with the classification results, preserving the genes with a correlation coefficient of r > 0.5.
2. t-test. The t-test uses the t-distribution theory to infer the probability of a difference and to compare whether the difference between the two averages is significant or not. Since the t-test sample must satisfy the homogeneity distribution, the homogeneity test must be done before t-test of the candidate gene and the classification result. In the experiment, for the homogeneous genes, the t-test was used to screen the characteristic genes, and we retained the genes with significant difference (p < 0.05) for the classification result tags. For the genes that do not satisfy the homogeneity analysis, the nonparametric test (such as Kruskal–Wallis rank sum test) is used to select the characteristic genes, and the genes which have significant difference (p < 0.05) to the classification result tags are retained.
3. Confidence interval. Although t-test can select the signature genes with different mean values from many genes, it is difficult to solve the problem that there is not much difference in the distribution of gene expression in the adjacent and stage I while the mean distribution is different. The confidence interval screening can be used to screen the signature genes according to the difference of the distribution of gene expression in adjacent tissues and stage I. The formula is:
Among them,
The flowchart of signature gene identification for cancer is shown in Figure 1, and all the screening processes are implemented in python language code.
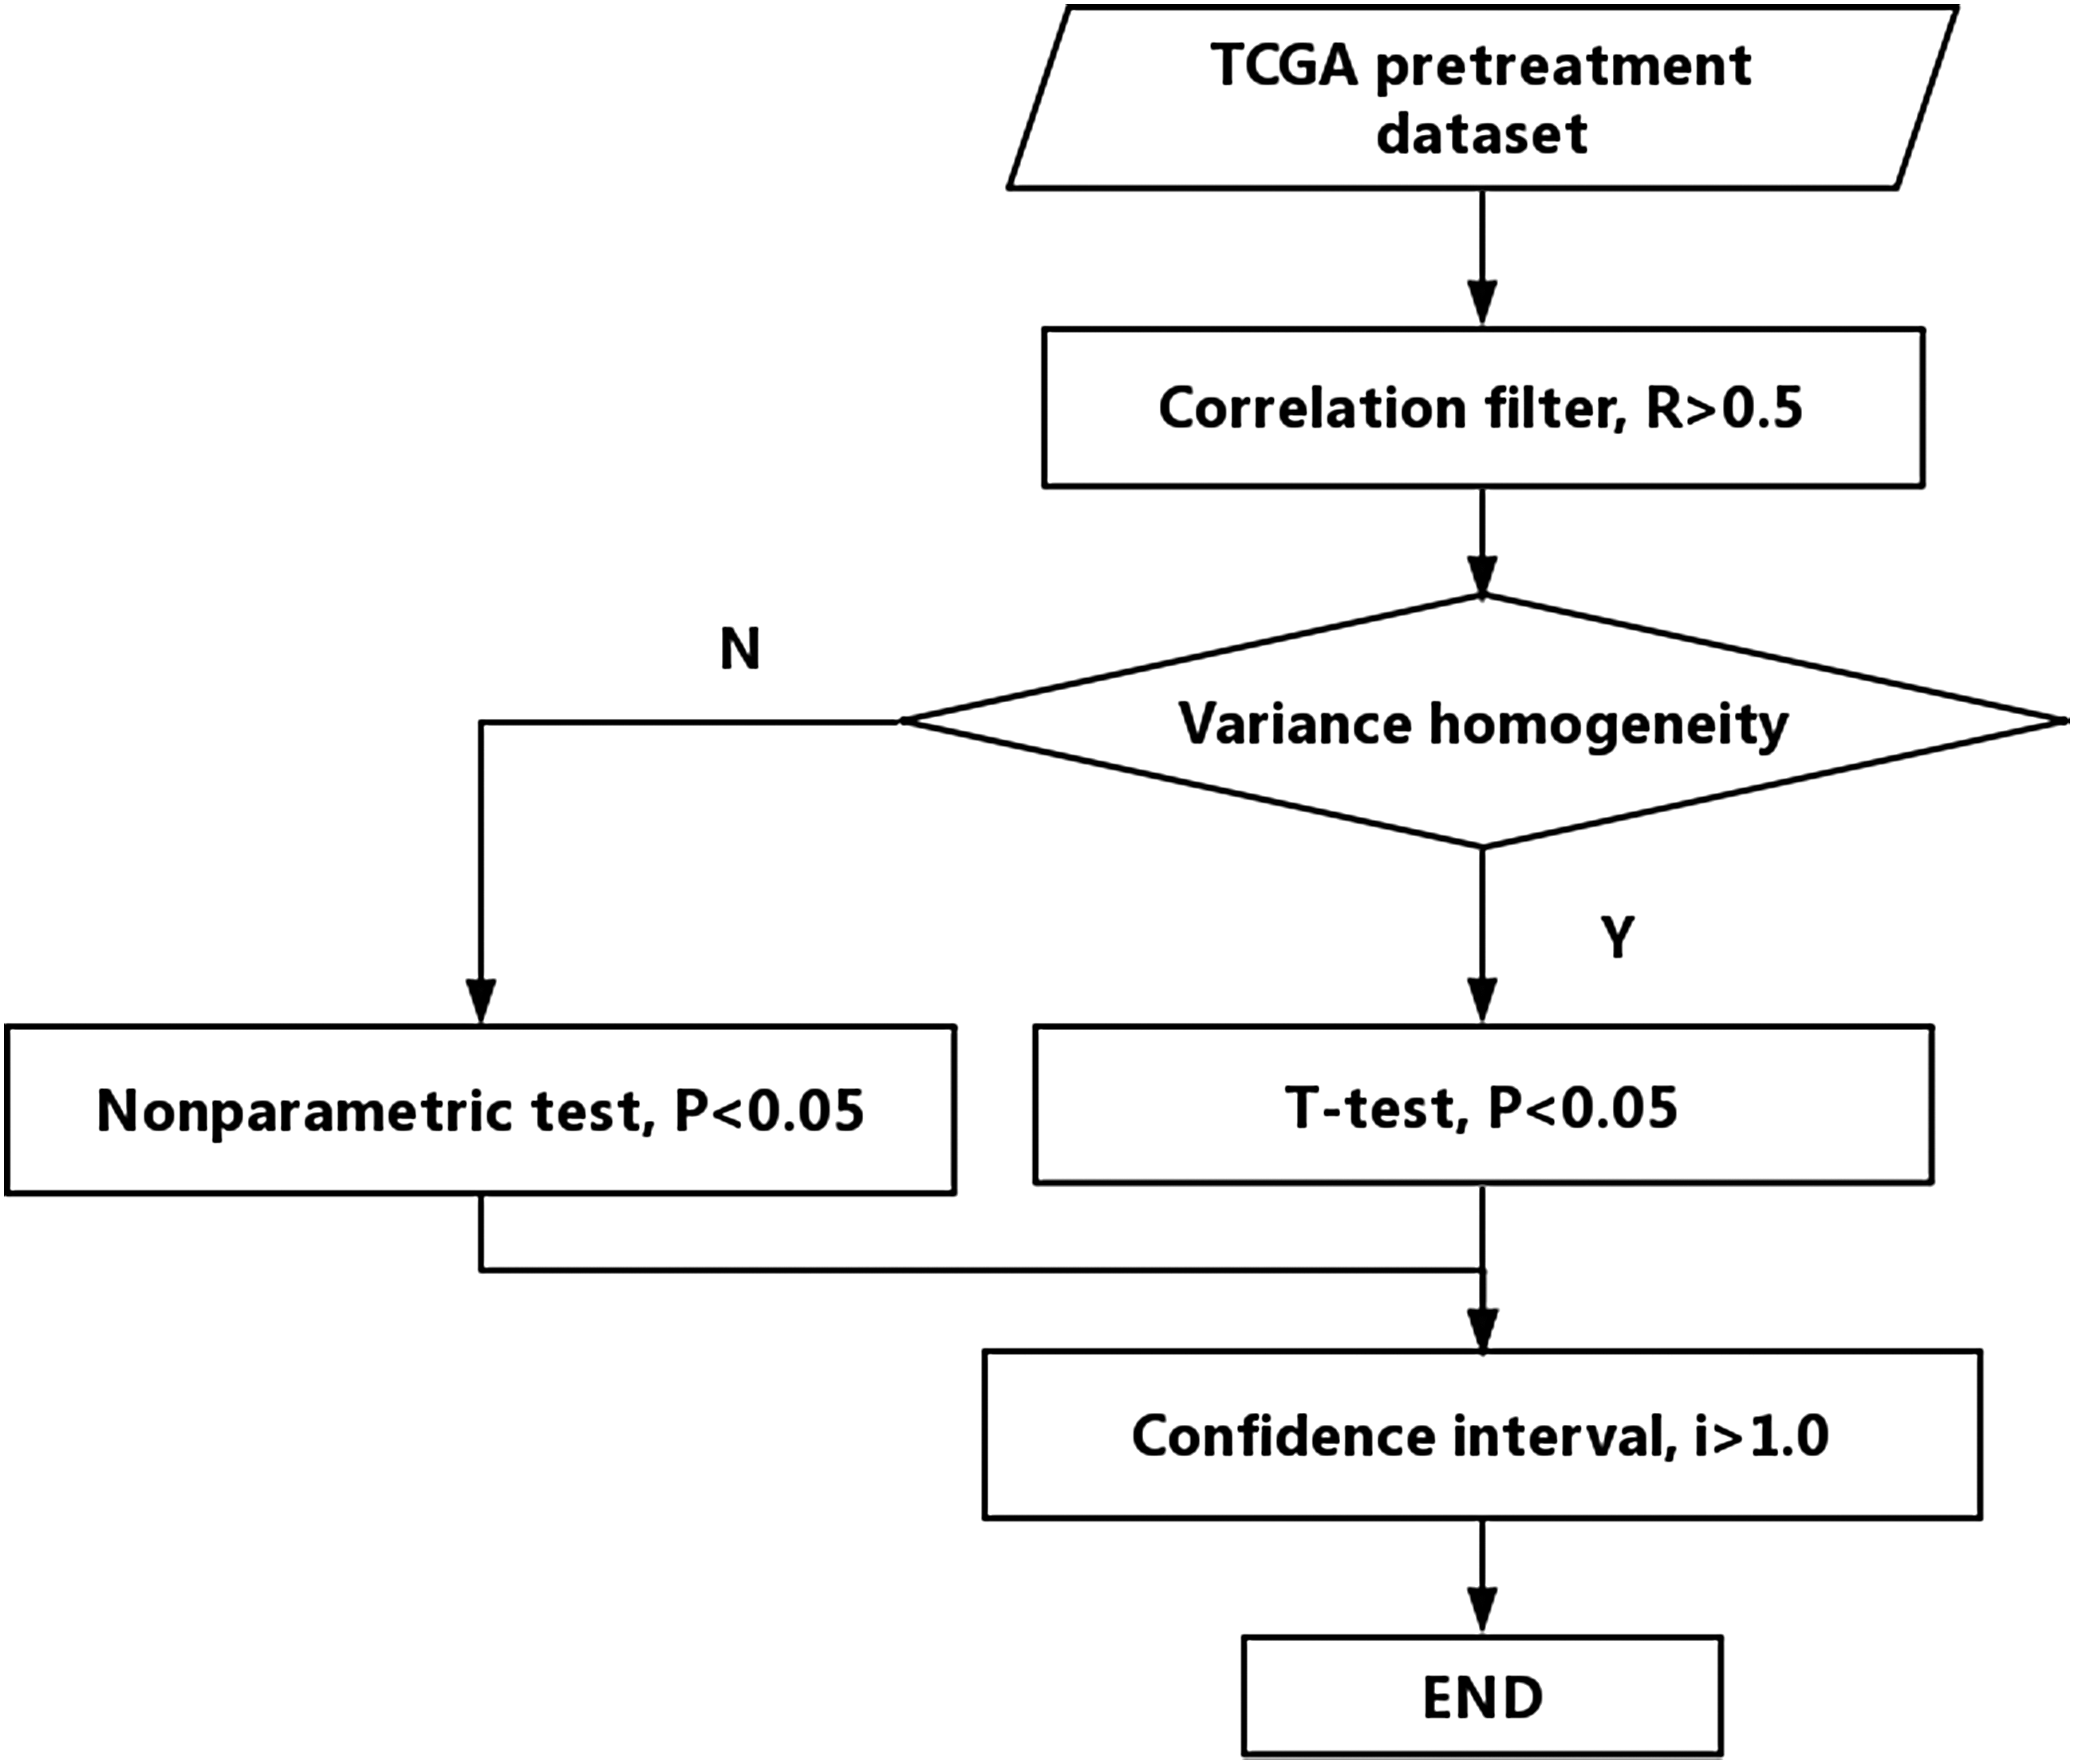
Flowchart of signature gene identification for cancer.
2.3. Modeling prediction and model evaluation methods
To make full use of the data, the training set and the test set data were divided by sixfold crossvalidation, and the Artificial Neural Network (ANN) was used to model and predict. The confusion matrix is used to count the classification results, and the accuracy (ACC), sensitivity (SEN), specificity (SPE), and Matthews correlation coefficients (MCC) are calculated to evaluate the classification results. ACC, SEN, SPE, and MCC are defined as follows:
Among them, True Positive is the number of samples that are normal samples in fact and predicted as normal samples at the same time; True Negative is the number of samples that are cancer samples in fact and predicted as cancer samples at the same time; False Positive is the number of samples that are cancer samples in fact but predicted as normal samples; and False Negative is the number of samples that are normal samples in fact but predicted as cancer samples.
3. Results
3.1. Classification results of signature genes
The aim of this article was to identify genes that are crucial for the development of cancer and to lay the foundation for revealing the mechanism of cancer. For this reason, the genes identified must have a high-enough ability to classify cancer, and the classification model used must have high classification accuracy to fully prove the validity of the gene. Using the signature gene screening method mentioned above, when the value of confidence interval i is 1.0, the number of signature genes of breast cancer is 336, that of lung adenocarcinoma is 586, lung squamous cell carcinoma is 2162, colon adenocarcinoma is 1442, renal clear-cell carcinoma is 812, thyroid carcinoma is 371, and that of hepatocellular carcinoma is 580. The data set is divided by sixfold crossvalidation, and the classification results obtained by ANN modeling are shown in Table 2.
ACC, accuracy; MCC, Matthews correlation coefficients; SEN, sensitivity; SPE, specificity.
It can be seen from Table 2 that the sensitivity of invasive breast carcinoma is 1, which indicates that the identification feature genes have the highest accuracy for the identification of paracancer. The specificity of lung adenocarcinoma reached 1, indicating that the identified signature genes have the highest accuracy in identifying the stage I of lung adenocarcinoma. The accuracy of recognition for colon adenocarcinoma samples was 100%, indicating that the screened colon cancer signature genes have good classification ability. According to the classification results of seven kinds of cancers, the accuracy of the classification of the signature genes obtained by the screening method can reach more than 97% and the MCC value can reach more than 0.92, indicating that the signature genes screened in this article have high ability to distinguish between adjacent and stage I, reflecting the reliability and superiority of this paper screening method.
Since the number of signature genes in each cancer is different from each other in i = 1.0, it is necessary to select a small set of signature gene sets with higher confidence and equal quantity for each kind of cancer, and study the influence of the size of signature gene sets on classification results. Based on this, we strictly control the value of i in the confidence interval so that the number of signature genes screened in each cancer is 12, sorting them from large to small depending on the distances of confidence intervals of genes in stage I and adjacent cancer sites. The specific information is shown in Table 3.
Using the characteristic gene sets obtained from seven cancers in Table 3, we select the highest confidence in the order of 1, 2,…12, 12 kinds of characteristic gene combinations for each cancer sample. When we used sixfold crossvalidation, ANN modeling results obtained is as shown in Figure 2. For a more intuitive analysis, the values for accuracy and sensitivity are omitted from Figure 2.
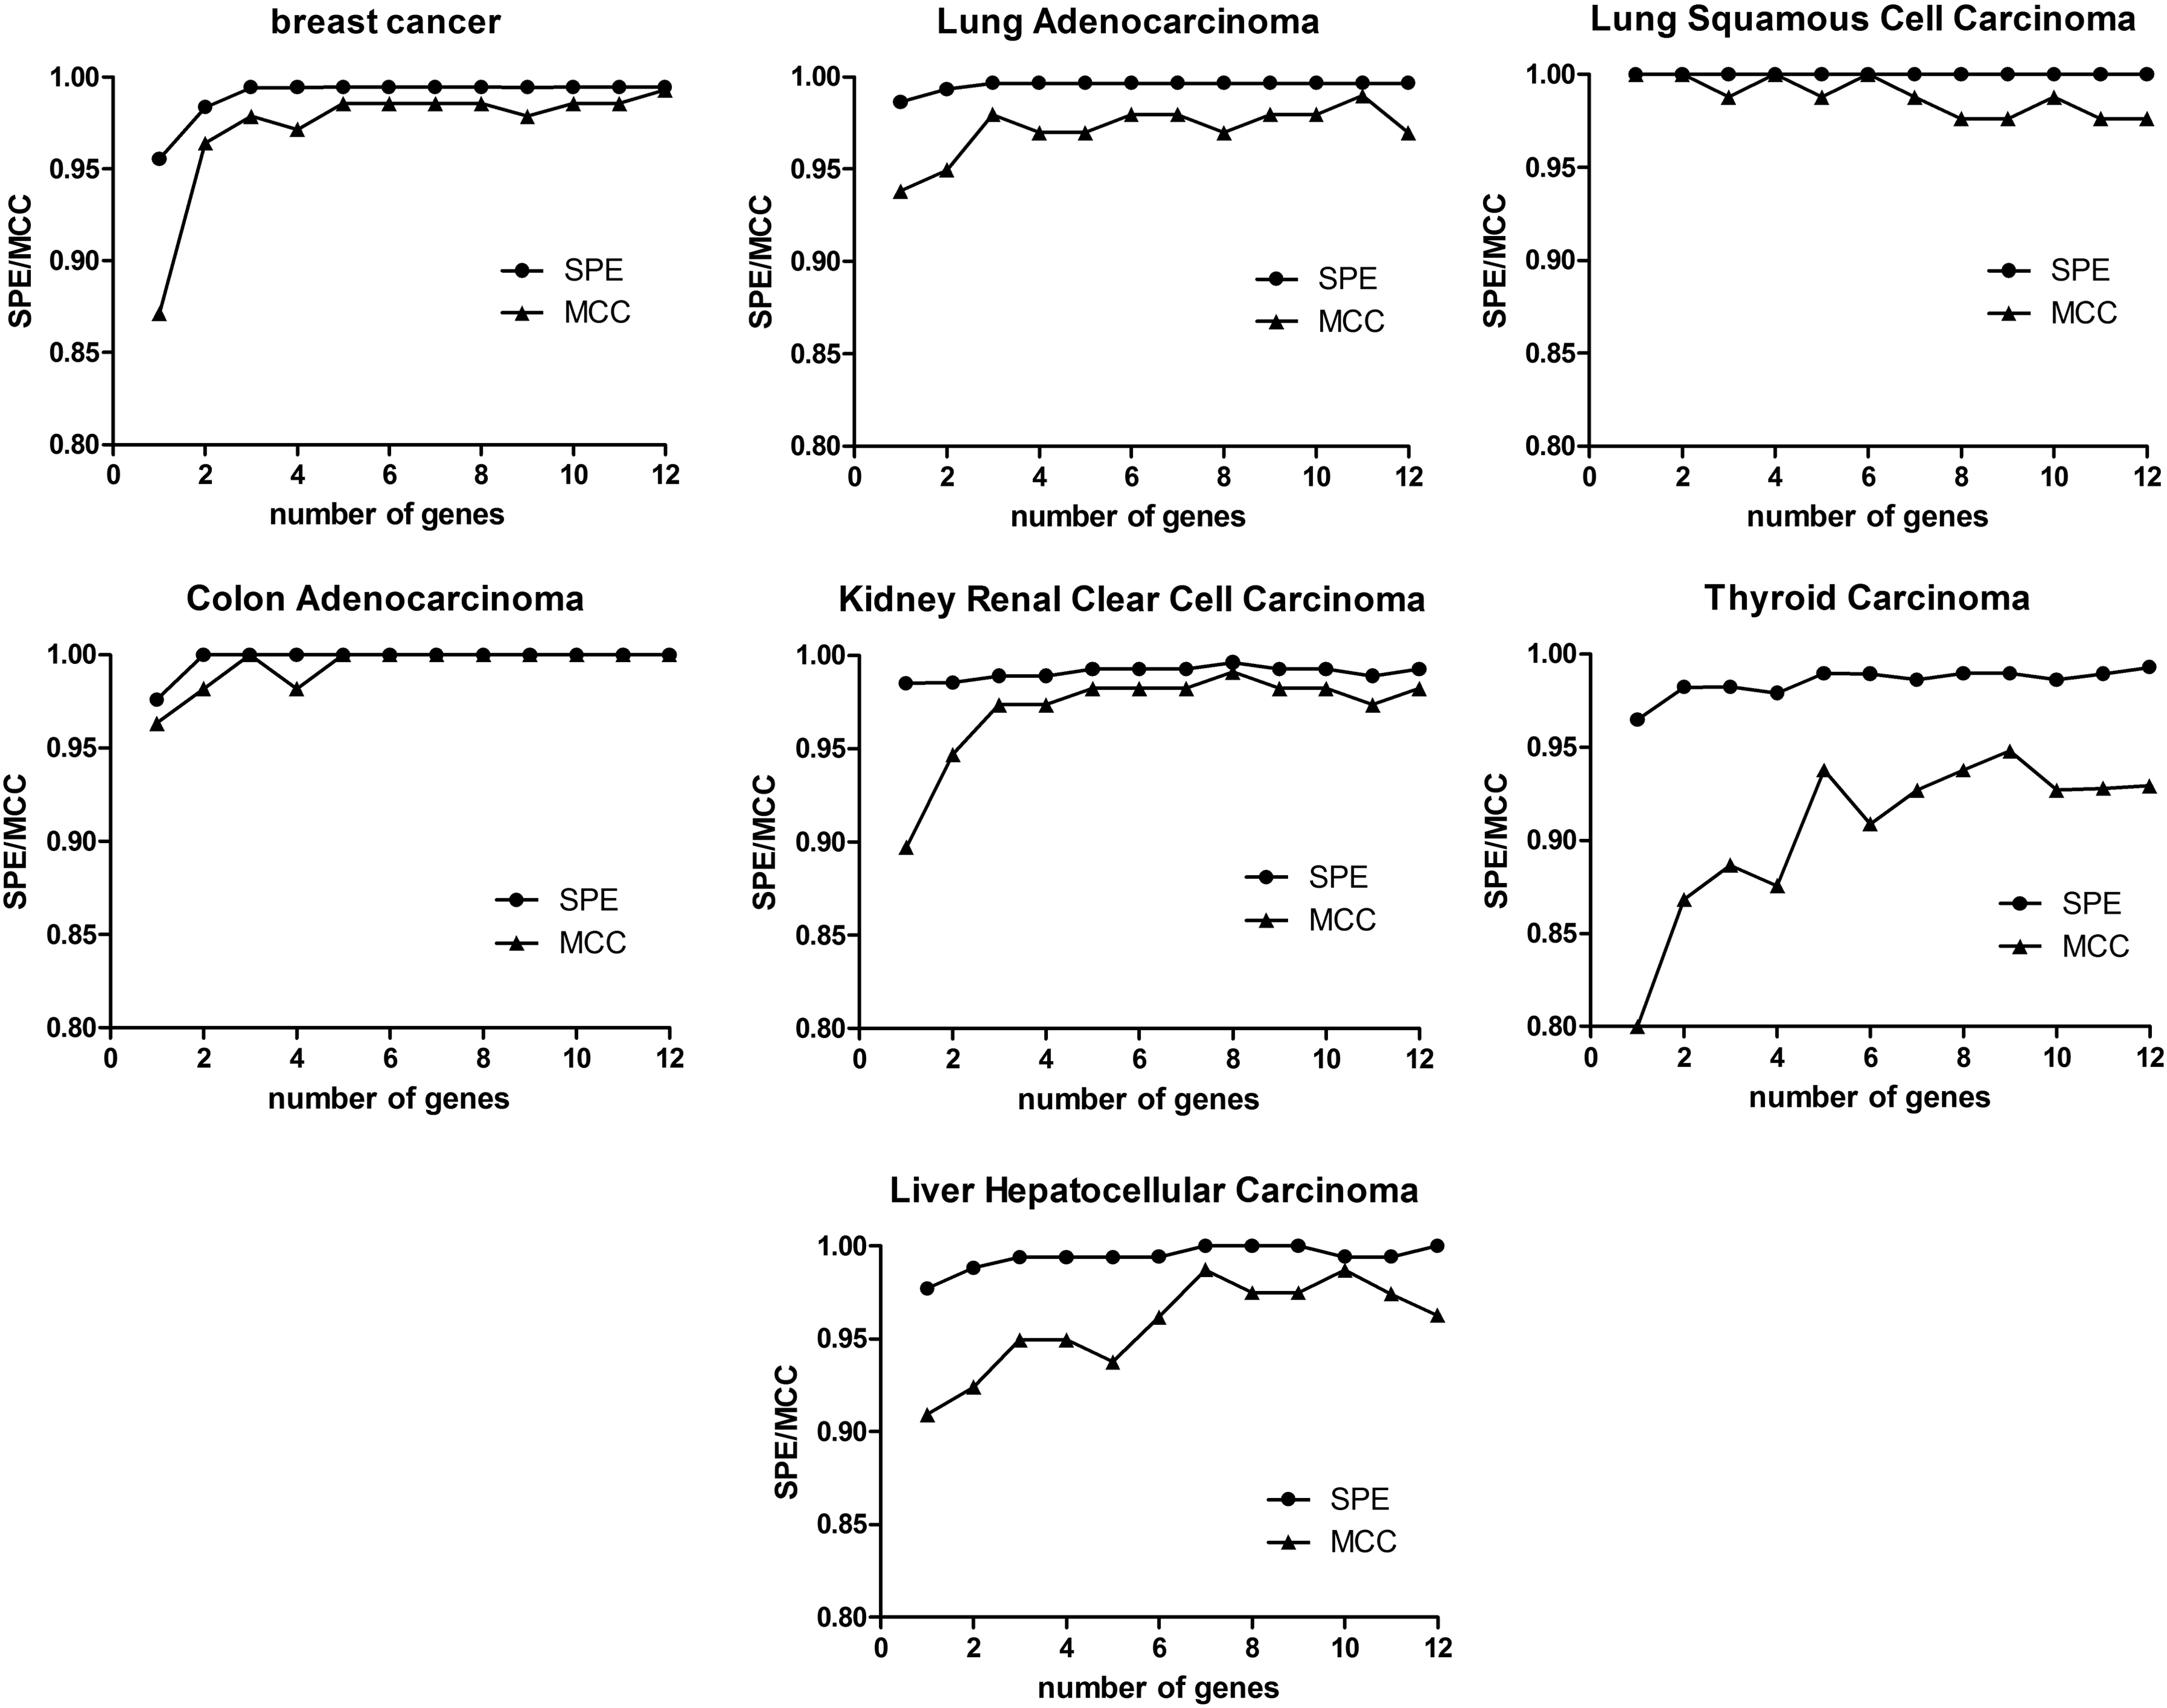
The result of artificial neural network model for each cancer.
As can be seen from Figure 2, different numbers of signature genes affect the predictive accuracy of the model for cancer stage I and cancer. When the number of signature genes reached all of the 12 genes, the prediction accuracy of invasive breast carcinoma was the highest. For lung squamous cell carcinoma and colon carcinoma, only the fewer genes can achieve the highest prediction accuracy of 100%. For lung adenocarcinoma, renal clear-cell carcinoma, thyroid carcinoma, and hepatocellular carcinoma, when the number of signature genes was 11, 8, 9, and 7, they reach the highest predictive accuracy, respectively.
The number of signature genes corresponding to the maximum MCC of seven kinds of cancer in Figure 2 and other model evaluation results are listed in Table 4. As can be seen from Table 4, all the indicators of lung squamous cell carcinoma and colon carcinoma are 1, and the sensitivity of invasive breast carcinoma, lung adenocarcinoma, and renal clear-cell carcinoma can reach 1, indicating that these few genes have the highest identification accuracy for adjacent cancer. At the same time, the specificity of hepatocellular carcinoma reached 1, indicating that these seven genes screened have the highest recognition accuracy for stage I of cancer. The highest accuracy rate of all seven kinds of cancers can reach more than 98.5%. These results indicate that the selected genes have an important role in the occurrence of cancer and the reliability of the screening method.
Comparing data in Table 2, it can be seen that when the threshold of the confidence interval is increased and the number of signature genes is reduced to less than 12, the MCC value of the most severe index in the evaluation model is flat or rising, the ACC and SEN is flat or rising, except for lung adenocarcinoma, the SPE values for the other six cancers were either flat or rising. This indicates that a small number of high-confidence signature genes can effectively distinguish early cancer and normal samples. The screening method in this article can eliminate the genes that contribute little to the classification results by setting the i value of the confidence interval.
This article also validates the independence using gene expression data from seven cancer patients in the Gene Expression Omnibus (GEO) database. Seven series of cancer patients' gene expression data were downloaded from the GEO database, respectively. According to the platform annotation information of the database, the gene probe was converted into gene names, and the data of normal and stage I samples in seven kinds of cancers were screened separately. The results are shown in Table 5.
Twelve signature genes screened for each cancer in the TCGA database were matched to GEO samples, and 10 of the breast and renal clear-cell carcinomas were matched in the GEO dataset, 8 of the lung squamous cell carcinoma and colon adenocarcinoma were matched, and the rest of the cancer were all matched. According to the matched signature genes, the data set is divided by the leave-one-out method, and the prediction accuracy obtained by ANN modeling is shown in Table 6. It can be seen from Table 6 that the prediction accuracy of invasive breast carcinoma, lung adenocarcinoma, and squamous cell carcinoma can reach 100% when the signature genes screened by TCGA are used to validate the GEO independent data set. In combination with seven kinds of cancer, the specificity is higher than 95%, that is, the accuracy rate of recognition for stage I is higher than 95%, and ACC is more than 92%, and the corresponding MCC value can reach more than 0.86. These results indicate that the method of signature gene screening given in this article is generally good. The selected genes can effectively distinguish the paracancer and early cancer samples, and have important value in the pathogenesis and early diagnosis of cancer.
3.2. Signature gene analysis related to cancer occurrence
As mentioned above, when the i value of the confidence interval is 1.0, all seven types of cancer have their own set of signature genes, which are all important genes in the occurrence of cancer. To further investigate the signature genes for a variety of cancers, we screen signature genes, which occur at least three times in seven cancers and obtain 245 genes (see Table S1 in Supplementary Material); there are 34 genes that occur simultaneously in four cancers, including 9 upregulated genes and 22 downregulated genes in cancerous tissues. There are three genes that are upregulated and downregulated in different cancers, and the specific information is shown in Table 7.
Bold genes indicate they occur in five cancers simultaneously.
Of the 34 genes screened above, phosphotyrosine interaction domain containing 1 (PID1) and spectrin beta, non-erythrocytic 2 (SPTBN2) occur simultaneously in five cancers (the bold genes in Table 7). PID1, also known as NYGGF4, is a protein-coding gene, which has a high expression level in obese patients. It may be a signal molecule that can regulate the transcription and replication of mitochondrial DNA (Shi et al., 2013). PID1 plays a role in the process of cell growth and differentiation (Wang et al., 2006), and it has been pointed out that the gene may have tumor suppressor function in some cancers (Erdreich-Epstein et al., 2014), which is consistent with the downregulated expression of the gene in five cancers. SPTBN2 is a protein-encoding gene; the encoding protein belongs to the spectrin family, is highly expressed in brain, kidney, pancreas, and liver, and at lower levels in lung and placenta; the defect of SPTBN2 is the cause of SCA5 (Lise et al., 2012). In the latest study of SPTBN2 gene, it has been pointed out that the defect of this gene is associated with the occurrence of multiple tumors (Chen et al., 2016).
3.3. Kyoto encyclopedia of genes and genomes' pathway analysis of signature genes
This article uses DAVID bioinformatics resources 6.8/NIAID function annotation tool to analyze the Kyoto Encyclopedia of Genes and Genomes' (KEGG) pathway of characteristic gene set. To study the interconnection of regulatory networks, we first analyzed, respectively, the KEGG pathways of the seven cancers when the value of i is 1.0, and then made a comprehensive analysis based on the pathways obtained from the seven cancers.
The results of KEGG analysis showed that when the significant correlation p < 0.05 was set, there were 8 pathways significantly associated with 336 characteristic genes in invasive breast carcinoma, there were 7 pathways significantly associated with 586 characteristic genes in lung adenocarcinoma, there were 26 pathways significantly associated with 2162 characteristic genes in lung squamous cell carcinoma, there were 27 pathways significantly associated with 1442 characteristic genes in colon adenocarcinoma, there were 27 pathways significantly associated with 812 characteristic genes in renal clear-cell carcinoma, there were 7 pathways significantly associated with 371 characteristic genes in thyroid carcinoma, and there were 8 pathways significantly associated with 580 characteristic genes in hepatocellular carcinoma, and the specific information is shown in Table S2 in Supplementary Material.
Pathways that occur at least three times in seven cancers are called common pathways of carcinogenesis; they are axon guidance, cell adhesion molecules, and p53 signaling pathway.
Axon guidance is a key phase in the formation of neuronal networks; axon guidance molecules guide axons to select the correct growth direction during the process of nerve development, so as to reach the target area successfully. In recent years, the research on axon guidance molecule has been progressing rapidly, and many studies have found that it plays an important role in the nervous system, immune regulation, angiogenesis, tumor invasion, and metastasis (Eissler and Rolny, 2013; Rehman and Tamagnone, 2013; Battum et al., 2015).
Cell adhesion molecules are collectively referred to as the mutual contact and binding molecules between cells and cells, cells and extracellular matrix. It plays a role in its receptor ligand-binding form; adhesion between cells and cells, cells and stroma, or cell–stroma–cells; involved in cell recognition, activation, and signal transduction; cell proliferation and differentiation; cell extension and migration; and is the molecular basis of a series of important physiological and pathological processes, such as cell response, inflammatory response, coagulation, tumor metastasis, and wound healing (Liu et al., 2007).
The P53 gene belongs to tumor suppressor gene family, and in normal human cells, it is involved in cell cycle arrest, apoptosis, and DNA repair, which plays a role in avoiding the accumulation of damaged DNA, maintaining the stability of the genome, and regulating cell differentiation and aging. When the p53 gene mutation is inactivated, it not only loses the tumor inhibitory effect, but also obviously enhances the invasion ability of tumor cells, promotes tumor metastasis and cell transformation. As the most important tumor suppressor gene, more than half of the tumors are related to the change of P53 signaling pathway, and p53 signaling pathway plays a critical role in the occurrence and development of malignant tumors (Vogelstein et al., 2000; Toledo, 2006).
The change of signature gene expression affects the function of the pathway of signature genes in normal tissue, which leads to the change of internal and external environment, and promotes the carcinogenesis of normal cells. Signature genes are closely related to the common pathway of carcinogenesis, different characteristic genes may act on the same pathway in diverse cancer tissues, suggesting that different cancer tissues may have the same mechanism of occurrence. The discovery and revelation of common pathways associated with signature genes further illustrate the effectiveness of the screening method of signature genes in this article.
4. Conclusions
In this article, we use bioinformatics methods to study the changes of gene expression in cancer patients from normal to disease stage I at the genome-wide level. The screening method of cancer signature genes was established by comprehensively using relevant methods in statistics, and the signature genes of seven kinds of cancer datasets of TCGA database were screened, respectively, to obtain the signature gene sets of different cancers.
Crossvalidation testing of TCGA datasets was performed based on the gene signature of cancer, and an ANN model was established to classify the normal samples and early cancer samples. The recognition accuracy of early cancer samples was higher than 98%. The signature genes were matched with GEO dataset, and the ANN model was built independently by using GEO dataset. The accuracy of recognizing stage I of cancer was higher than 95%, which is slightly lower than that of TCGA dataset. These results indicate that the signature genes screened can effectively distinguish early cancerous samples from normal samples, and the method of screening signature genes is universal and effective.
The common genes emerging in five cancers were obtained from the signature genes of seven cancers, PID1 and SPTBN2, and we explained their key role in the stage of cancer. Meanwhile, KEGG pathway analysis of seven cancer signature genes revealed three common pathways of carcinogenesis: axon guidance, cell adhesion molecule pathway, and p53 signaling pathway. These pathways are closely related to the occurrence of cancer, suggesting that different cancer tissues may have the same mechanism of occurrence. The screened signature genes, especially the small number of high-confidence screening signature genes, can effectively distinguish the normal and cancer stage I samples, and are of great value to the cancer pathogenesis and early diagnosis research.
Footnotes
Author Disclosure Statement
The authors declare that no competing financial interests exist.
References
Supplementary Material
Please find the following supplemental material available below.
For Open Access articles published under a Creative Commons License, all supplemental material carries the same license as the article it is associated with.
For non-Open Access articles published, all supplemental material carries a non-exclusive license, and permission requests for re-use of supplemental material or any part of supplemental material shall be sent directly to the copyright owner as specified in the copyright notice associated with the article.