
Abstract
Abstract
Homologous sequences are widely used to understand the functions of certain genes or proteins. However, there is no consensus to solve the automatic assignment of functions to protein problem and many algorithms have different ways of identifying homologous clusters in a given set of sequences. In this article, we present an algorithm to deal with specific sets, the set of coding sequences obtained from phylogenetically close genomes (of the same species, genus, or family). When modeled as a graph, these sets have their own characteristics: they form more homogeneous and denser clusters. To solve this problem, our algorithm makes use of the clustering coefficient, which maximization can lead to the expected results from the biological point of view. In addition, we also present an algorithm for the identification of sequence domains based on graph topology. We also compared our results with those of the TribeMCL tool, a well-established algorithm of the area.
1. Introduction
T
The detection of homology is relatively simple for experts, but it is time-consuming compared with automatic processes. Although the automatic process is not as reliable as the one performed by the experts and there are many considerations on that approach (Bork and Koonin, 1998), the automatic detection of homologues is widely used in databases (Apweiler et al., 2004; Zdobnov et al., 2017) and has been fundamental for the understanding of genomes (Pieretti et al., 2009).
Many of the approaches to improve gene function automatic identification are based on graph theory (Enright and Ouzounis, 2000; van Dongen, 2000; Bolten et al., 2001; Abascal and Valencia, 2002; Pipenbacher et al., 2002). In this model, the sequences are represented as vertices and the edges receive values according to some criteria, typically defined from local alignments. Some also use the concept of transitivity to find homologous groups, a concept derived from mathematics that states that if a and b are related, as well as b and c, then a and c should also be related. These relationships are easily applied to the ancestry of sequences (Sasson et al., 2002). Thus, each related component will be considered a group of homologous CDSs, or a family of CDSs.
Although homology is transitive, similarity is not, and works that are based on similarity can produce false relationships that merge two groups incorrectly (Sasson et al., 2002). Therefore, it is potentially problematic to group sequences in a way that is highly dependent on transitivity, which do not have more direct relationships, producing low-density groups.
Multidomain proteins are well-known cases that can undermine automatic annotation algorithms because they have well-conserved domains that are very representative of two or more unrelated sequences. These cases make it necessary for algorithms to define strategies, either by preventing the joining of unrelated groups (Pipenbacher et al., 2002) or as a postprocessing step (Enright and Ouzounis, 2000).
In this work, the focus is to group the set of all the CDSs obtained from completely sequenced genomes of phylogenetically close organisms. Thus, some characteristics are expected, among them, it is expected that the graph formed by the homology relationships is more homogeneous and denser. A significant part of the clusters, therefore, should contain at least one gene from each genome (the core genome of the genome set).
This work presents a sequence clustering algorithm that aims to maximize the density of the sequence clusters through a graph's metric called clustering coefficient, thus reducing the number of related groups strongly based only on transitivity. In addition, a case study involving 55 complete genomes of Streptococcus pyogenes strains and 69 complete genomes of the Xanthomonadaceae family was performed.
2. Related Work
Most of the sequence clustering algorithms use graph-based modeling. This model allows making decisions considering the neighborhood, but the use of this model can imply a higher computational cost. Because of this, there are some works that use alternative representations. An example is the CD-Hit (Li et al., 2001), which is based on greedy decisions and thus it is very fast and was designed to work with a huge volume of data. However, it was not designed to identify homology, but rather to index CDS databases.
Another method of clustering common to many works is the use of single linkage, which consists of starting from single elements and then joining them in an iterative way. These algorithms determine a metric not only for comparing sequences but also for the comparison of groups. The linkage of sequences or groups aims to maximize or minimize this metric. Sasson et al. (2002) use the maximization of several metrics applied to the alignments' e-value of all the sequences of the groups. The Abascal and Valencia (2002) approach is based on the entropy of graphs, starting not from unitary sets, but from groups formed by the Ncut algorithm (normalized cut). This model is based on local decisions and, thus, it is important to consider the whole groups to avoid false relationships. However, the treatment of multidomain proteins is implicit, potentially not grouping the multidomain proteins correctly.
Bolten et al. (2001) developed a graph-based approach using the Smith and Waterman (1981) metric. The clusters found are the strongly connected components of the graph. This method evidences the creation of clusters that contain multidomains, not including them in the clusters of other sequences that have some of their domains. The algorithm needs a minimum initial alignment for the edges. This algorithm was extended (Pipenbacher et al., 2002) to work with edge significance filters and an additional step was also proposed for the separation of some groups.
TribeMCL (Enright et al., 2002) is widely used for clustering sequences and it is an application of the MCL (van Dongen, 2000) that was proposed for the clustering in graphs with strong biological motivation. The algorithm is based on hidden Markov models to simulate graph flow walks. This algorithm is quite robust, fast, and is little affected by small changes in the graph topology (Brohée and van Helden, 2006).
GeneRage (Enright and Ouzounis, 2000) uses a different approach for graphs, representing them as an array of similarity. And unlike other approaches, local alignments are only used for a kind of initial edge filter (considering only alignments that have e-value smaller than
All these algorithms are based on local decisions, between neighboring sequences or near groups. However, none of these approaches makes use of a global metric that considers all sequences in decision-making. Therefore, we present in this article an algorithm that uses the clustering coefficient.
3. Clustering Coefficient
The clustering coefficient is a topological metric for graphs in which, for each subset of three connected vertices, it calculates the probability of these three vertices being a clique of size three, that is, these three vertices are all connected to each other (Algorithm 1). The denser the components of the graph, the closer to 1 will be its clustering coefficient; otherwise, the components with few edges tend to have their coefficient closer to 0. An important characteristic of this coefficient is that it is not impacted by isolated components, and if in each component all the vertices are totally connected to each other, then the graph clustering coefficient will be 1.
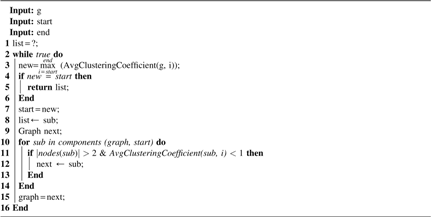
For each vertex of the graph, it is necessary to check all the combinations of pairs of its neighbors, and whether or not there is an edge that connects them (Algorithm 1). Therefore, the total complexity of this algorithm is
Therefore, in the worst case, the complexity is of the order of
4. Methods
To take advantage of the characteristics of phylogenetically closely related genomes (such as the organization of coding sequences (CDs) in more homogeneous groups and the fact that a significant part of the groups is expected to be formed by orthologous genes), an algorithm was developed using the average clustering coefficient, where the sum of the coefficients of each vertex is divided by the number of vertices. The higher the value of this coefficient, denser are the components of the graph, and therefore, its maximization produces graphs according to the expected characteristics for a graph of homologies.
The first step of the algorithm is to perform a local alignment, for example, using the BLAST tool, of all sequences against all. A minimum threshold was established and alignments above it are discarded. The threshold used was a maximum e-value of
The next step is to progressively remove edges that prevent the graph from obtaining the expected topology, as discussed earlier. For this, an e-value between
For each one of the tested e-value, the alignments with values greater than this value are removed. Then the groups that are fully connected are separated, and the process is repeated for the remaining groups until a new e-value does not improve the clustering coefficient of the graph. The result at the end of the process is a list of e-values, forming increasingly restrictive layers.
From the biological point of view, the sequences evolve differently. In the first layer the most well-defined sequences are grouped, separating the sequences that are more distant from each other, and in the next ones the separations occur among sequences that have closer relationships.
To take advantage of the characteristics of phylogenetically closely related genomes (such as the organization of CDs in more homogeneous groups and the fact that a significant part of the groups is expected to be formed by orthologous genes), an algorithm was developed using the average clustering coefficient, where the sum of the coefficients of each vertex is divided by the number of vertices (Algorithm 2). The higher the value of this coefficient, the denser are the components of the graph and, therefore, its maximization produces graphs according to the expected characteristics for a graph of homologies.

Two sets of genomes from bacteria were chosen to evaluate the proposed solution. One composed of 55 S. pyogenes genomes and the other of 69 Xanthomonadaceae genomes, both formed by fully sequenced genomes and selected based on their importance in the fields of medicine (Lamagni et al., 2008; Ferretti et al., 2016) and agronomy (Jalan et al., 2013), respectively. All genomes are available at the National Center for Biotechnology Information and were automatically annotated using the PATRIC tool (Wattam et al., 2017).
Based on the amino acid sequences and their respective annotated functions, the correspondences of the functions in the homologous groups were analyzed. These data were considered classes in a homology classification problem, that is, if two genes were grouped in the same connected component they were classified as positive (P), otherwise as negative (N), and if there was a correspondence between their function then they are classified as true (T), otherwise they are classified as false (F).
This approach allows us to use evaluation metrics widely used in the classification area, such as the following:
Accuracy: Sensitivity: Specificity: Efficiency:
Unlike what is common for classification problems, a considerable part of the classes are unknown (between 13% and 27%) and marked as hypothetical proteins. In addition, the annotated functions were not cured by a specialist because of the large volume of data from these sets. Although these limitations do not allow us to accurately assess all cases of homology, it makes possible to automatically evaluate the performance of the classification for the subset of proteins with known functions. Therefore, it was necessary to separate the evaluation of the results into two groups, the first with only sequences with known functions and a second formed by all of them.
The results were compared with the results of a state-of-the-art tool, the TribeMCL, that had excellent performance and had its quality already verified (Brohée and van Helden, 2006).
5. Results
Different alignment percentage lengths were tested to maximize the total number of families present in the core genome. Since the sets of analyzed genomes are quite close, it is expected that there is a broad set of homologous CDSs shared by all genomes.
The distribution of the number of families in the core genome as a function of the percentage size of alignment tested (Fig. 1) indicated a maximum of 38% for the Streptococcus group. For the Xanthomonadaceae group, the core genome showed to be decreasing as a function of the alignment percentage. The value used in the experiments for this parameter was 30%. Our algorithm organized the genes at an initial layer plus six layers for the set of Streptococcus (the e-value threshold for each level was
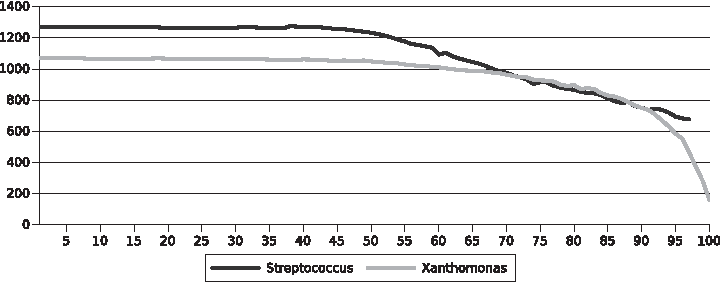
Number of gene families in the core genome using the proposed algorithm.
The same strategy was used to choose the inflation parameter of the TribeMCL, in an exploratory way. Therefore, the following results are based on the inflation of 15.0 for the group of Streptococcus (with a core genome of 1237 families) and 10.0 for the group of Xanthomonadaceae (with a core genome of 988 families).
The results found for the analyzed algorithms prove to be quite positive, given the complex nature of the problem (Tables 1 and 2). Although the TribeMCL obtains better true positive (TP) values in some cases, this does not necessarily correspond to a better classification as discussed based on the other metrics.
Classification Results Using the Proposed Algorithm
FN, false negative; FP, false positive; N/A, not available; TN, true negative; TP, true positive.
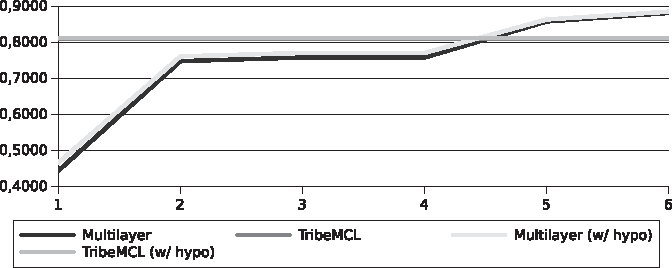
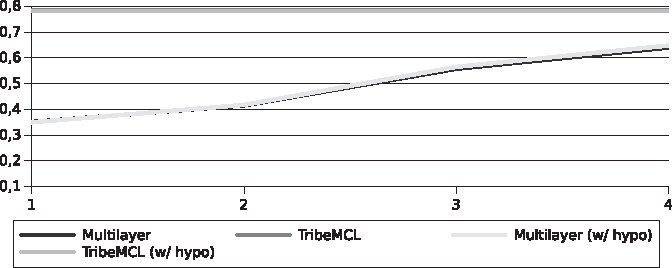
The accuracy results are better for our approach (Figs. 2 and 3), mainly because of the values of true negative (TN) that are the vast majority of instances in this type of problem. This is justified by the density of the graph. However, individually the groups are dense, globally the graph is sparse. The classification, including sequences with unknown functions, was better than TribeMCL and this classification only showed less accuracy by mixing sequences of unknown function with the already known ones, giving indications that they could share the same function.
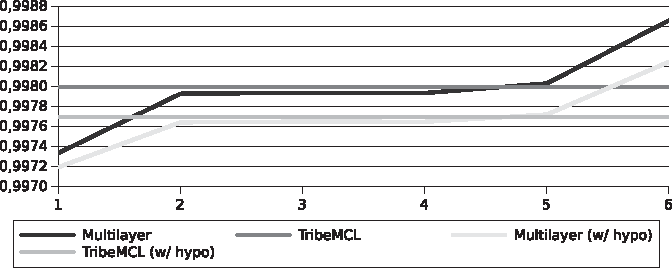
Overall accuracy for the Streptococcus pyogenes genomes.
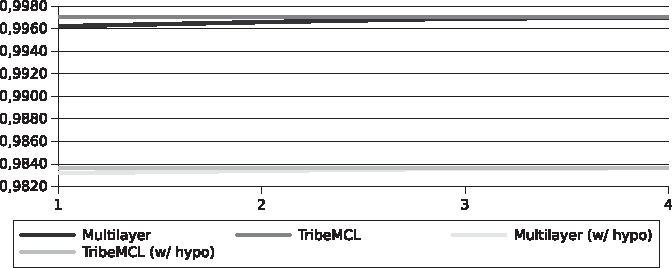
Overall accuracy for the Xanthomonadaceae genomes.
Figures 4 and 5 present the sensitivity results. Although our solution for the set of phylogenetically closest genomes (Streptococcus) obtained considerably better results than with TribeMCL, the same did not happen with the more distant genomes (Xanthomonadaceae). Due to the fact that at this stage we still do not treat cases with multidomain sequences, many misleading junctions can still be avoided in both sets.
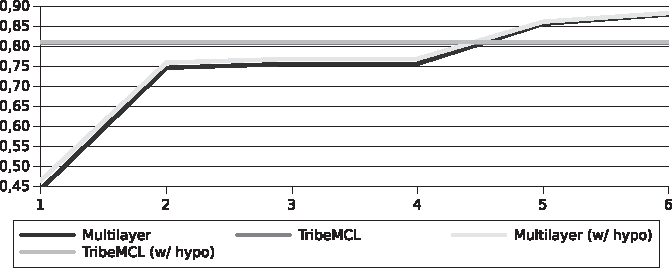
Sensitivity for the Streptococcus pyogenes genomes.
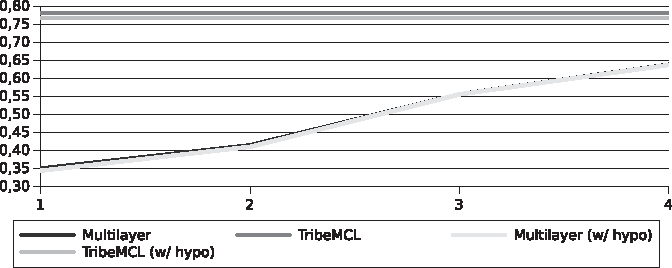
Sensitivity for the Xanthomonadaceae genomes.
The differences found in the specificity (Figs. 6 and 7) were small in comparison between the two algorithms (<0.01%), this is due to the large amount of TNs, as well as already seen with accuracy.
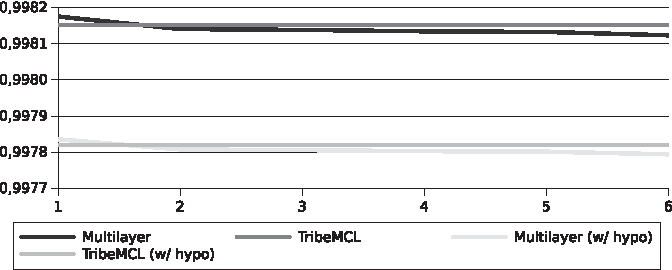
Specificity for the Streptococcus pyogenes genomes.
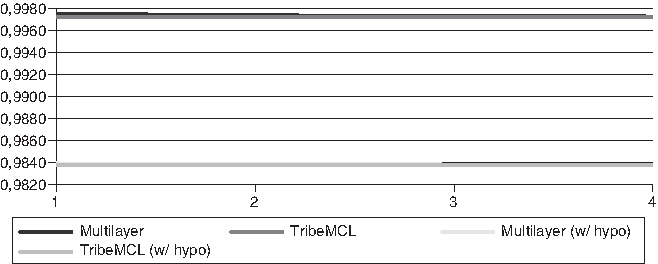
Specificity for the Xanthomonadaceae genomes.
Our solution produced better sensitivity results for the set of Streptococcus than TribeMCL, something that did not happen with the set of Xanthomonadaceae (Figs. 8 and 9). These results do not represent a reliable performance of both algorithms, for reasons previously discussed such as the lack of knowledge of the function of part of the sequences and the lack of curatorship by specialists. However, this experiment helps the understanding of the behavior of a subspace of the problem. In addition, our approach preserves the structure of the graph allowing other topological analyses, such as domain identification. The identification of domains has the potential to further improve peer identification, and shows that even without a defined strategy in this regard, TribeMCL also achieved very good results.
Efficiency for the Streptococcus pyogenes genomes.
Efficiency for the Xanthomonadaceae genomes.
6. Identification of Motifs and/or Sequence Domains
Since our approach preserves the relationships between the vertices in the graph, it allows us to make additional analyses regarding the topology. One is the identification of possible domains and motifs, which is highly relevant for genetic studies (Vogel et al., 2004).
Multidomain sequences are a known problem for clustering algorithms because they can be grouped based on local alignments with sequences that do not have homology relationships to each other. This situation is very problematic because multidomain sequences can lead the clustering algorithms to produce groups of nonhomologous sequences. From the point of view of graph theory and topological analysis, these are vertices with smaller clustering coefficients than their neighbors. Therefore, this is the first step in the domain identification process: to identify vertices that have a clustering coefficient smaller than the average of their neighbors. These vertices are marked as possibly multidomains.
Following, the graph goes through a simplification step. The related groups formed of vertices considered here as single domain ones are converted to a single vertex each (a symbolic representation of the group), preserving their edges and the values of their local alignments to other vertices outside the group. The same happens with possibly multidomain vertices, and those with the same neighbors in common are converted to a single vertex to represent these vertices.
In the next step, the edges are converted to directed ones. For this, all the edges connected to the vertices that have been converted to the respective vertex are verified, if all the local alignments from a group to another are greater than two defined parameters, then the edge will become directed of the vertex with the smaller sequence to the greater. The two parameters used are based on the difference in length between the two aligned sequences, the first is the absolute value of the difference and the second is the difference divided by the length of the alignment. In the empirical analyses performed, values 100 and 0.3 were found to be adequate to solve the problem and were used to obtain the following results.
The use of a directed graph implies that not all vertices will be accessible from a given beginning (in a connected component). The domains considered are all sets of vertices accessible from all vertices.
The classification of the domains is different from the previous analyses because the groups are not disjoint. For each group, positive, negative, true, and false values are calculated, in which, given a domain, the vertices belonging to the domain are considered true and those that do not belong are considered false. Tables 3 and 4 present the results.
Classification Results Using the Proposed Algorithm Considering Multiple Domains
Accuracy of the Classification Results Considering Multiple Domains
Accuracy and specificity varied <0.5%. And the main advance was in the sensitivity metric and its reflection on the efficiency of the algorithm. The Streptococcus group increased from 87.9% to 90.4%, but the increase in Xanthomonadaceae was considerable, from 63.7% to 90.2%, directly impacting the efficiency of the classification that increased from 88.1% to 90.6% and from 63.9% to 90.9%, respectively.
7. Conclusions
This article presents a sequence clustering algorithm based on graph theory. The focus of the algorithm is the CDS of complete genomes of phylogenetically close organisms, which for this particularity have some characteristics of their own: they tend to have a broader core genome and homology relationships tend to be more homogeneous, forming denser components.
From these principles it was proposed an algorithm that maximizes the clustering coefficient, thus maximizing the density of the connected components of the graph. The result of the algorithm is hierarchical groups in which each layer is more restrictive than the previous one, and thus, by removing edges, the graph reaches the topology with the expected characteristics.
The problem of homologous gene family identification was treated as a problem of homology classification and the results of our solution were compared with the results of the TribeMCL. For both algorithms, two sets of input obtained from phylogenetically close genomes were presented. The algorithms obtained good classification results, considering the complexity of the problem, differing more strongly by the sensitivity metric, in which our algorithm showed better results in the set of the nearest genomes. This metric was negatively influenced by the number of false positives resulting from the set with the more distant genomes.
In addition, we also presented a domain identification algorithm that improved classification. Through the identification of domains, there was an improvement in the sensitivity metric, making the efficiency of the presented algorithm superior to TribeMCL.
As future work we intend to develop algorithms for performing the intracluster analysis to identify the phylogeny of each of the clusters, which may aid in the phylogenetic analysis of groups of closely related genomes.
Footnotes
Acknowledgment
This work was partially funded by CAPES.
Author Disclosure Statement
The authors declare that no competing financial interests exist.