
Abstract
Abstract
Obesity is a major risk factor for many metabolic diseases. To understand the genetic characteristics of obese individuals, single-nucleotide polymorphisms (SNPs) derived from next-generation sequencing (NGS) provide comprehensive insight into genome-wide genetic investigation. However, interpretation of these SNP data for clinical application is difficult given the high complexity of NGS data. Hence, in this study, obesity risk prediction models based on SNPs were designed using machine learning (ML) methods, namely support vector machine (SVM), k-nearest neighbor, and decision tree (DT). This investigation obtained clinicopathological features, including 130 SNPs, sex, and age, from 139 eligible individuals. Various feature selection methods, such as stepwise multivariate linear regression (MLR), DT, and genetic algorithms, were applied to select informative features for generating obesity prediction models. Multivariate logistic regression was used to evaluate the importance of the selected features. The models trained from various features evaluated their predictive performances based on fivefold cross-validation. Three measures, namely accuracy, sensitivity, and specificity, were used to examine and compare the predictive power among various models. To design obesity prediction models using ML methods, nine SNPs, including rs10501087, rs17700144, rs2287019, rs534870, rs660339, rs7081678, rs718314, rs9816226, and rs984222, were selected based on stepwise MLR. In evaluation of model performance, the SVM model significantly outperformed other classifiers based on the same training features. The SVM model exhibits 70.77% accuracy, 80.09% sensitivity, and 63.02% specificity. This investigation has demonstrated that the selected SNPs were effective in the detection of obesity risk. Additionally, the ML-based method provides a feasible mean for conducting preliminary analyses of genetic characteristics of obesity.
1. Introduction
T
To study SNPs in a more effective manner, next-generation sequencing (NGS) techniques provide a powerful tool for a more comprehensive view of obesity-associated genomic characteristics. The characteristics of NGS include fast, high resolution, and cost-effectiveness (Metzker, 2010). However, NGS data are generally highly complicated for analysis. The association of a single SNP or gene with a disease or phenotype has been widely studied. The associations between SNPs and phenotype have provided more clear insights into the mechanisms of disease development (Chen et al., 2009; Berndt et al., 2013; Wheeler et al., 2013). However, it is still difficult to integrate all the dispersed single associations together for clinical application.
Machine learning (ML) methods have garnered considerable attention this decade, given their excellent ability in dealing with classification or prediction problems. Their good performance in nonlinear classification has also been reported (Yan and Shao, 2002; Davatzikos et al., 2005). Moreover, the application of ML methods in several fields was successful, including biomedical studies (Cruz and Wishart, 2006; Wang and Huang, 2011). The advantageous features of ML methods include objectiveness, reproducibility, flexibility, comprehensiveness, and capability of analyzing multivariable or complicated data. Several hundred obesity-associated SNPs have been reported (Frayling et al., 2007; Scuteri et al., 2007; Chen et al., 2009; Cho et al., 2009; Speliotes et al., 2010; Berndt et al., 2013; Wheeler et al., 2013). The influence of each obesity-associated SNP was difficult to integrate because these SNPs were evaluated separately in various studies or populations. However, Mao et al. (2017) have investigated worldwide population differentiation in allele frequencies of obesity-associated SNPs. Their results indicated that 195 obesity-associated SNPs possess effect alleles significantly enriched or depleted in at least one of the 26 populations. To investigate the relation between the combination of specific SNPs and obesity risk, ML methods are adequate tools to access complicated data with multiple features (Bui et al., 2016a, 2016b; Huang et al., 2016).
In regard to the application of ML method on obesity prediction, Dugan et al. (2015) have tried six different ML approaches to predict childhood obesity after age 2. Recently, Seyednasrollah et al. (2017) integrated childhood clinical factors and the genetic factors (97 SNPs) to predict adulthood obesity based on ML. Their model not only improved the prediction of adulthood obesity but also performed best among young children (3–6 years), whereas the obesity risk among older children (9–18 years) can be identified using childhood clinical factors.
Additionally, a comprehensive study, which has identified 10 SNPs associated with obesity and T2D-related traits as well as other 3 SNPs associated with prostate cancer from mixed ethnicity cohorts, was published recently on IJCNN (2017 International Joint Conference on Neural Networks, DOI: 10.1109/IJCNN.2017.7966194). In this study, several well-designed feature selection methods, including stepwise multivariate linear regression (MLR), decision tree (DT), and genetic algorithm (GA), were employed to figure out informative attributes for generating obesity risk prediction models. Additionally, several supervised learning methods, such as support vector machine (SVM), k-nearest neighbor (KNN), and DT, were applied to generate binary classifiers for discriminating between obese and nonobese individuals based on selected features (obesity-associated SNPs). Moreover, we elucidate their effectiveness in obesity risk evaluation and compare the predictive performance among SVM, KNN, and DT models.
2. Materials and Methods
2.1. Eligibility of study subjects
Figure 1 presents the flowchart of this work, mainly including characterization of SNPs via NGS, features selection, model training and evaluation, as well as performance comparison of various ML methods. This study was reviewed and approved by the ethics committee of the Chang Gung Memorial Hospital (IRB No. 102-4256A3). Informed consent was obtained from each subject before recruiting. Body mass index (BMI) was used as an indicator of obesity in this study. BMI was calculated as weight (measured in kilograms) divided by the square of height (measured in meters). One hundred thirty-nine subjects were recruited from 2014 to 2015, including 74 obese individuals (BMI ≥27 kg/m2) and 65 nonobese individuals (BMI <24 kg/m2). All the included individuals have no known history of metabolic or endocrine disorders, undergoing steroid treatment, or undergone surgical treatment for obesity. There was also no pregnant individual. Specimen of each individual was collected via venipuncture for SNPs examination.
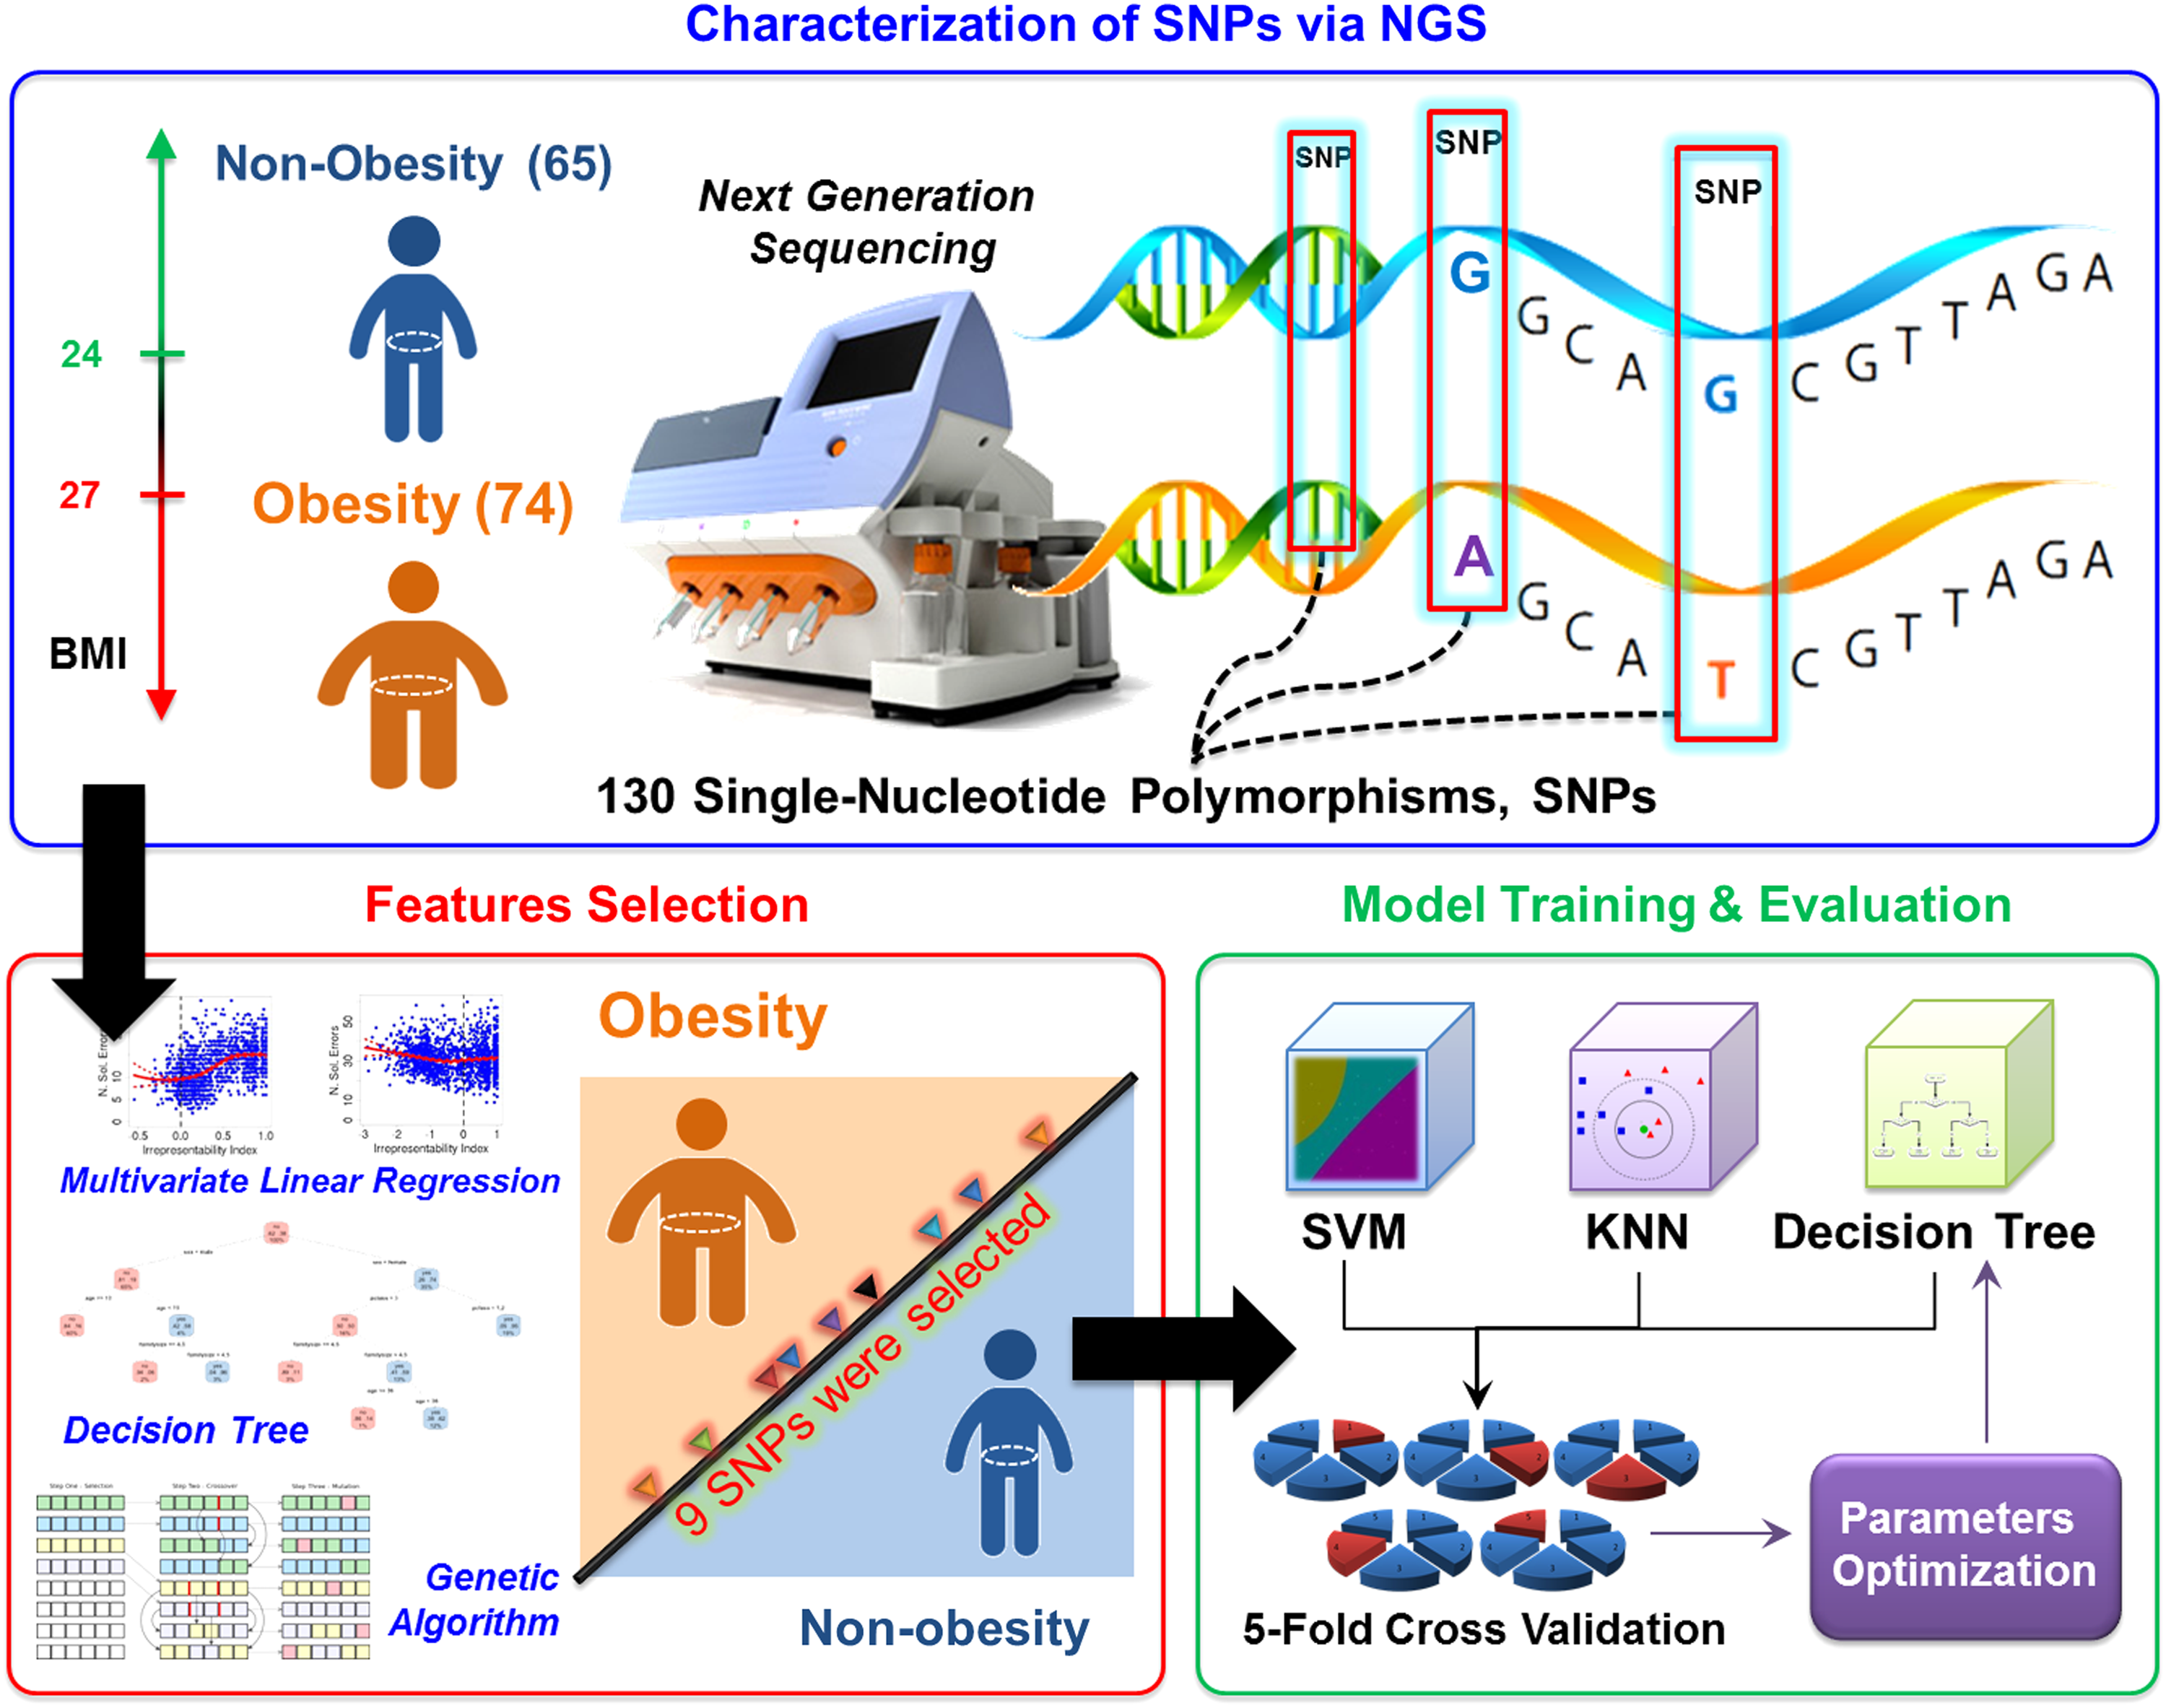
Flowchart of obesity risk prediction based on the ML methods. ML, machine learning.
2.2. Potential SNPs selection
In the investigation of genome-wide SNP analysis, 130 SNPs located in 72 obesity-associated loci were selected for examination. These loci are associated with BMI, body fat percentage, waist circumference (WC), waist-to-hip ratio (WHR), or early-onset extreme obesity in mostly Caucasian or Asian populations (Clement et al., 1995, 1996; Beamer et al., 1998; Ishiyama-Shigemoto et al., 1999; Siffert et al., 1999; Pereira et al., 2003; Chen et al., 2009; Cho et al., 2009; Ma et al., 2010; Loos, 2012; Asai et al., 2013; Berndt et al., 2013; Wheeler et al., 2013). Information of the reported SNPs is detailed in Supplementary Table S1.
2.3. Characterization of SNPs via NGS
Genomic DNA was extracted from whole blood specimens using the QIAamp DNA Mini Kit (Qiagen, Hilden, Germany) according to the manufacturer's instructions. An Ion AmpliSeq custom panel was designed using the Ion AmpliSeq Designer (ThermoFisher Scientific, Waltham, MA) for the 130 SNPs. Primers for the 130 SNPs were combined in two-primer pools. The average size of DNA fragments was 253 base pairs. The library was prepared using the Ion AmpliSeq Library Kit 2.0 and the Ion Xpress Barcode Adapter (ThermoFisher Scientific). Quantitation and size distribution analyses of the libraries were performed by an Agilent Bioanalyzer using a High Sensitivity Kit (Agilent, Santa Clara, CA). Emulsion PCR and subsequent enrichment were performed using the Ion PGM Template OT2 200 Kit and the Ion OneTouch 2 Instrument (ThermoFisher Scientific). Sequencing was performed using the Ion PGM Sequencing 200 Kit (v2) with the Ion 316 chip of the Ion Torrent PGM System (ThermoFisher Scientific) according to the manufacturer's instructions. The raw sequencing data were processed on the Torrent Server using the Ion Torrent Suite Software (Version 4.2.1; ThermoFisher Scientific). The Torrent Variant Caller plugins were adapted for data analysis. Each SNP genotype was coded as 0 (wild type), 1 (heterozygous), and 2 (homozygous) depending on the number of risk alleles.
2.4. Feature selection methods
Stepwise MLR, DT, and GA were used as feature selection methods and evaluated in this study. Stepwise MLR is a statistics-based method for feature selection. The model for a MLR analysis is defined as
where y is a dependent variable,
To minimize the sum of squares, the partial derivative for
In the process, each SNP attribute
DT is a rule-based classification algorithm, which was widely applied in supervised ML (Han, 2005). DT constructs a tree-like structure in a top-down manner, where each internal node denotes a test on a feature, each branch denotes an outcome of the test, and each leaf node holds a class label. At each internal node, the best feature is chosen to partition the training data of this node into individual classes. The features that appear in the tree are assumed to be relevant to the given classification problem. Before the construction of DT, the information gain of each attribute should be determined by calculating the entropy value for each attribute. Given a training data set X containing positive and negative samples, the entropy function of X is described as
where
where W(A) is the domain range of A, X is the sample set, and Xw is the sample set with attribute A equal to w. Then, all attributes (130 SNPs) were ranked by its information gain values. In this investigation, the J48 program, with an enhanced DT algorithm included in Weka toolkit (Hall et al., 2009), was adapted to perform the feature selection against 130 SNPs.
GA has been a well-studied optimization method as it usually succeeds in searching the optimal solution out from a set of parameters (Yang and Honavar, 1998; Saeys et al., 2007). In the implementation of GA, the parameters to be optimized are represented by a chromosome in which each parameter is regarded as a gene. A binary array is typically adapted to represent the chromosome. In this work, a chromosome includes a total of 130 attributes (SNPs) to be optimized. As presented in Figure 2, an initial population, which comprises a specified number of chromosomes, is generated by randomly assigning “1” (the SNP is used) and “0” (the SNP is not used) to all attributes. The chromosomes were used to generate the predictive models and were evaluated by the so-called fitness function, which is the performance in fivefold cross-validation. Reproduction, crossover, and mutation are the three major processes for generating offspring chromosomes in GA. The offspring chromosome is reproduced by the crossover and mutation of the best chromosomes selected by fitness function. A crossover process exchanged attributes in potential combinations in an attempt to create offspring with better discrimination ability. Subsequently, essentiality of attributes was tested by mutation process. The reproduction process shall be repeated until a certain number of chromosomes reaching a convergence criterion on fitness function.
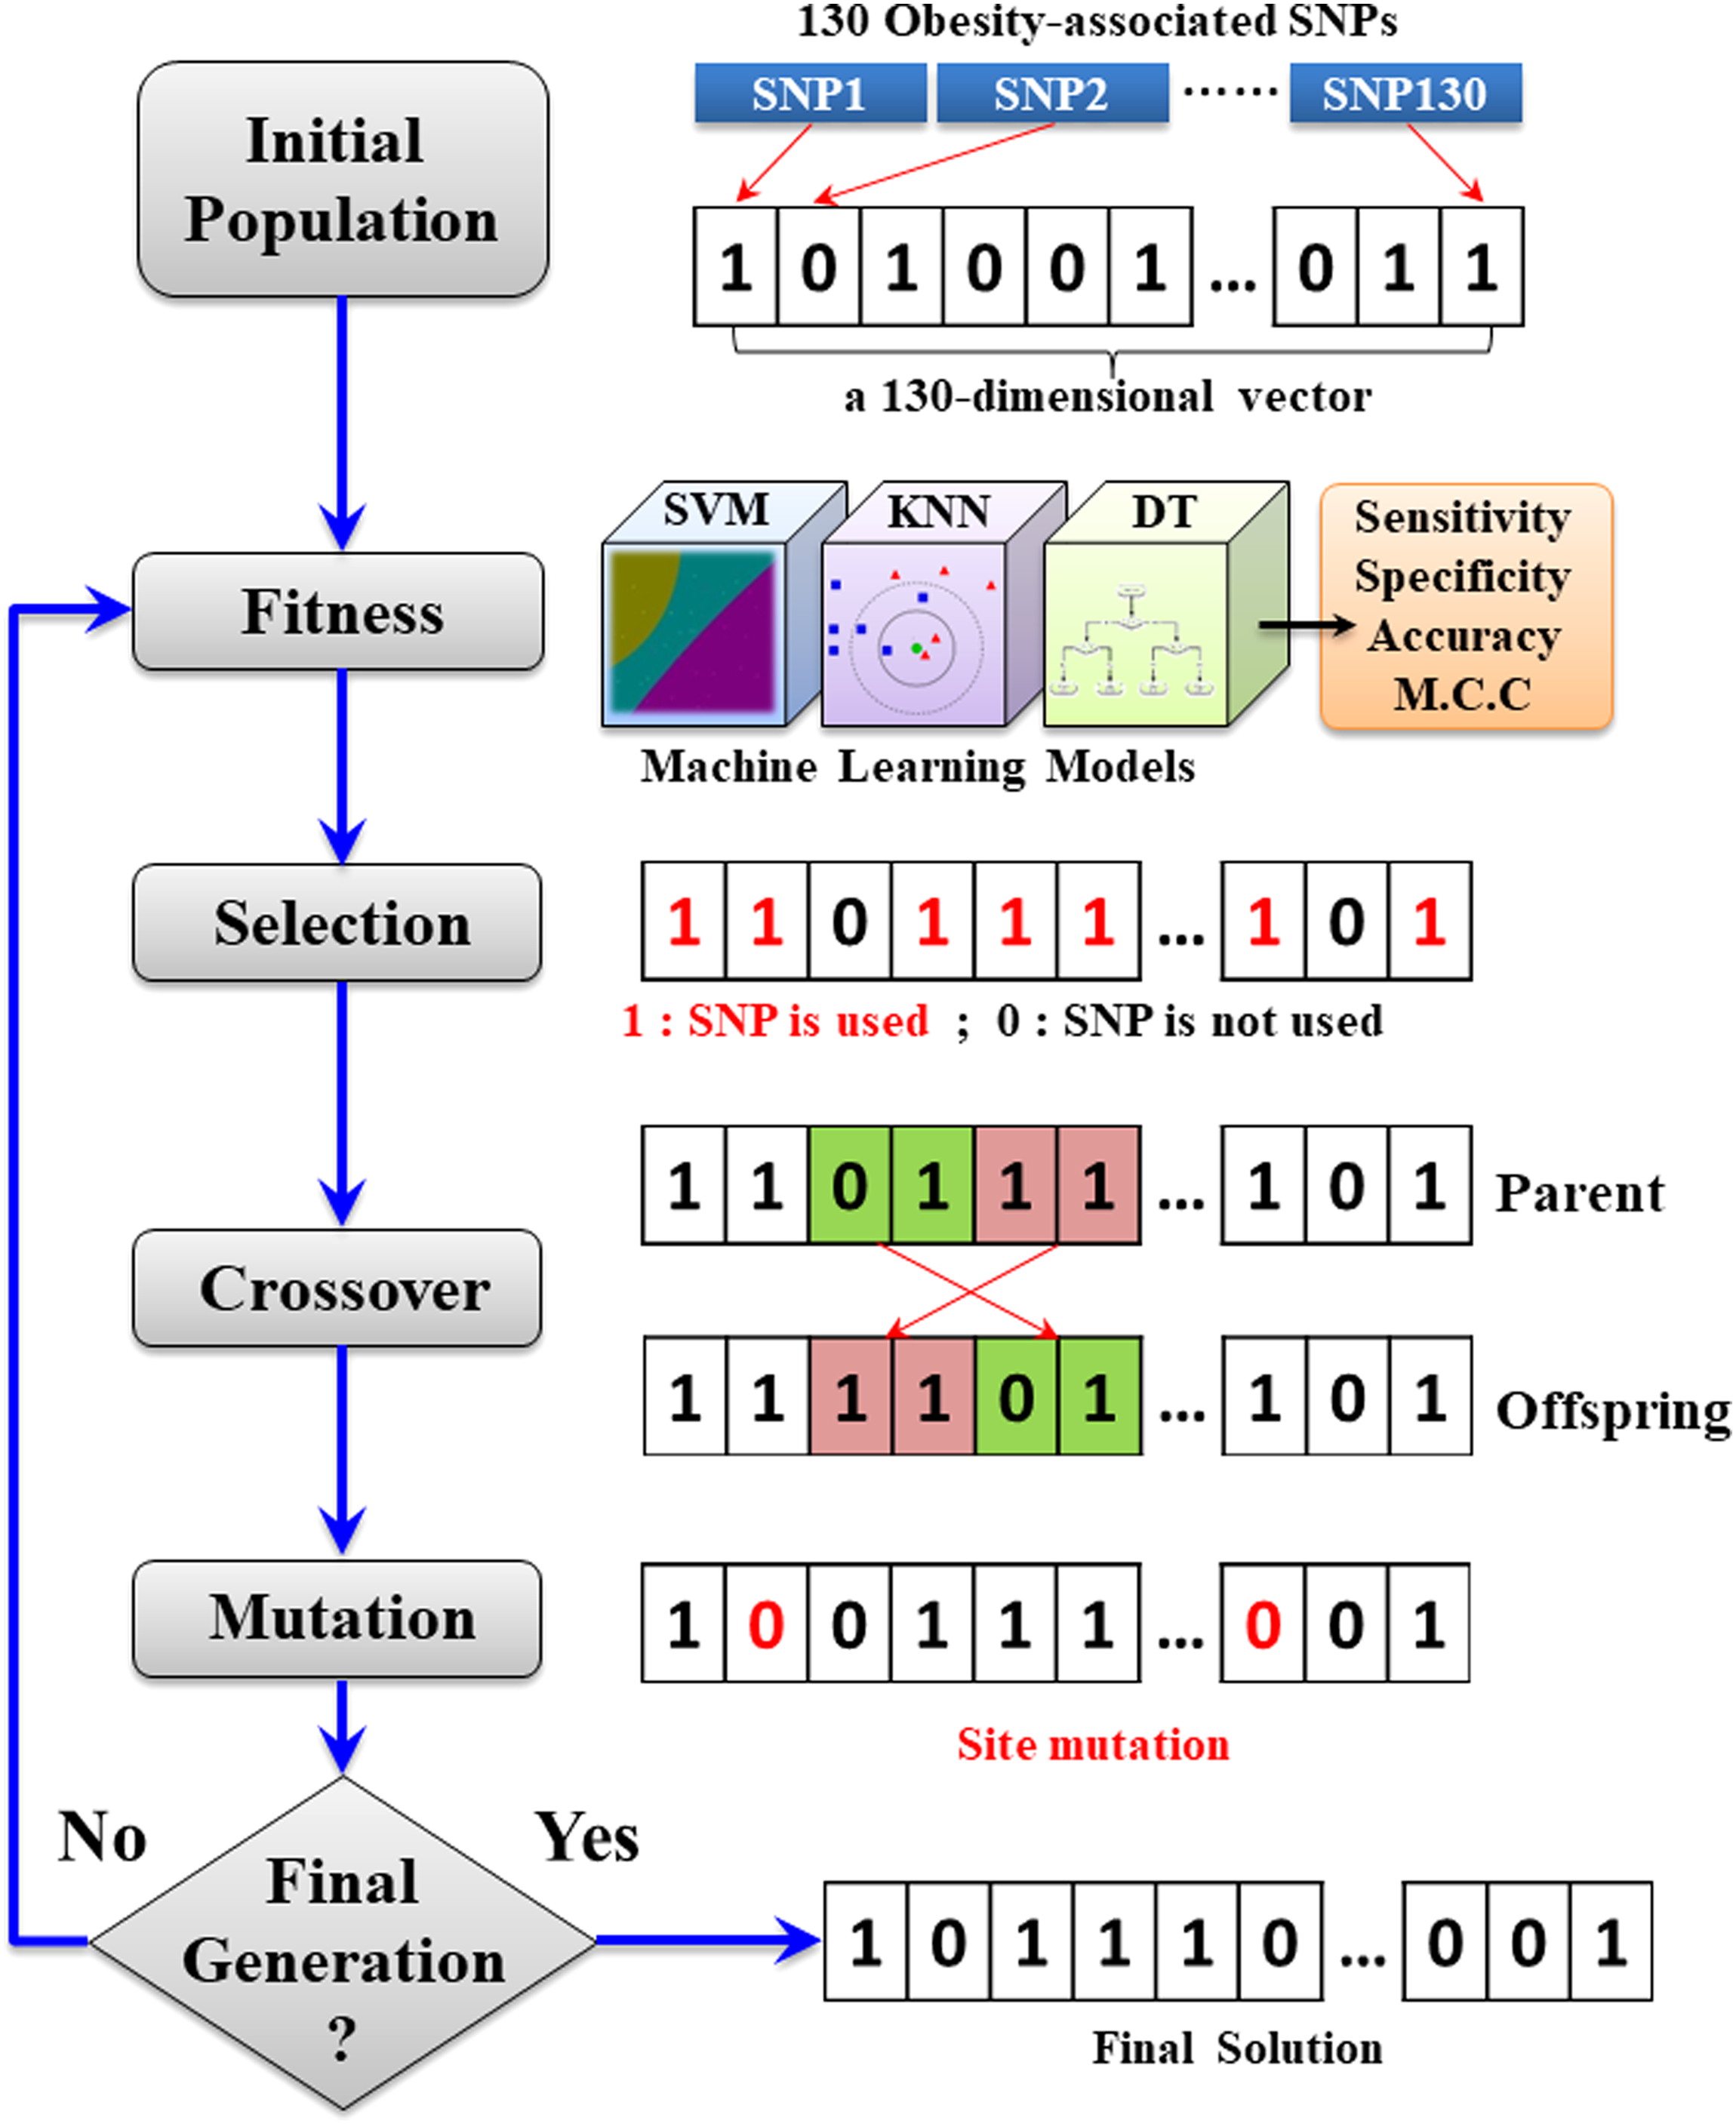
Flowchart of applying genetic algorithm on selection of attributes (SNPs). SNP, single-nucleotide polymorphism.
2.5. Construction of SVM models
In this study, a binary classification problem (nonobesity vs. obesity) was considered. The SVM models used in this study were constructed using the Matlab version of the LIBSVM 3.20 software package, which is the most well-known and widely applied SVM software tool (Chang and Lin, 2011). An effective SVM model was constructed using the procedures outlined in the manual by a previous study (Hsu et al., 2010). Briefly, the procedures mainly included two steps: (1) select an appropriate feature mapping kernel function such that the two groups might become linearly separable after mapping the samples into high-dimensional space and (2) determine the parameters c (penalty for misclassification) and γ (function of the deviation of the radial basis function [RBF] kernel). In this study, the RBF kernel was selected based on superiority compared with other kernel functions on performance in our preliminary trial. Subsequently, the values of c and γ were determined through an iterative grid search by fivefold cross-validation, as detailed in previous studies (Hsu et al., 2010; Wang and Huang, 2011).
2.6. Construction of KNN models
KNN is an instance-based algorithm used for classification. The KNN models used in this study were constructed using the Matlab (MathWorks). In this study, the number of the nearest number was set to 9 according to our preliminary trial. For each case in the validation set, the Euclidean distances from the cases in the training set were calculated. The class categories of the nine cases with Euclidean distances closest to the validation case were recorded. The class of the validation case was accordingly predicted on the basis of the major class categories of these nine closest cases.
2.7. Construction of J48 models
In J48, the classification of a query sample of an unknown class is a top-down process that tests the feature values of the sample against the nodes of the DT. The process starts from the test of the root node and follows the appropriate branch based on the test. If another node is reached, the test of the node is subsequently applied. If a leaf is reached, the class label associated with the leaf is assigned to the query sample. The J48 model was generated in WEKA (Version 3.6). All the parameters of J48 were set as default unless specified.
2.8. Validation and comparison of various predictive models
The obesity risk prediction models based on various different ML methods were trained and validated via fivefold cross-validation. The training data set was divided into five subgroups with approximately equal size. The ratio of the testing set to the training set was 1:4, and the cross-validation process was repeated five times. The five validation results were then combined to generate a single estimation. Obviously, one of the benefits of k-fold cross-validation is the improvement on the reliability of evaluation because all the original data, including the training and testing data sets, were considered, and each subset should be tested only once (Lu et al., 2011). Moreover, fivefold cross-validation was repeated by randomized allocation for 100 rounds. In an attempt to estimate the predictive performance of each trained model, measures such as sensitivity (Sn), specificity (Sp), accuracy (Acc), and Matthews correlations coefficient (MCC) were used:
where TP, TN, FP, and FN represented the number of true positives, true negatives, false positives, and false negatives, respectively. The MCC value shall be ranging from −1 to +1, where the value of +1 represents a perfectly correct classification between the two data sets, whereas the values 0 and −1 represent a random prediction and a completely wrong classification, respectively. Additionally, the ROC (receiver operating characteristic) curve of the three different models is used for the comparison of the area under the curve of ROC values.
2.9. Statistical analyses
To evaluate the performance of the ML models, a one-way analysis of variance (ANOVA) with a statistical significance level of 0.05 was used to examine the performance of various feature selection methods and the effect of different ML methods on discrimination accuracy. The Tukey honestly significant difference post hoc test was used to determine the differences when the null hypothesis of ANOVA was rejected. p-Values less than 0.05 and 0.01 were labeled separately. All statistical analyses were performed using SPSS (Version 20; SPSS Inc.).
3. Results and Discussion
3.1. Data distribution of obese and nonobese individuals
In this investigation, a total of 139 individuals, consisting of 74 obese individuals (BMI ≥27 kg/m2) and 65 nonobese individuals (BMI <24 kg/m2), were recruited from 2014 to 2015. All the studied individuals have no history of metabolic or endocrine disorders or undergoing steroid treatment or surgical treatment for obesity, and no pregnant individuals were included. As presented in Table 1, the sample size of men (88 individuals) was greater than that of women (51 individuals). In the men data set, there were 47 obese individuals and 41 nonobese individuals. The average age among men is ∼41 years. In addition, the women data set contained 27 obese and 24 nonobese individuals. The average age among women is ∼38 years. Overall, the sample numbers of obesity versus nonobesity were ∼1:1 in both males and females. In addition, the average age of males and females was not significantly different.
Data Distribution of Obese and Nonobese Individuals
Age data were presented as the mean ± standard deviation.
BMI, body mass index.
3.2. Performance evaluation of 130 SNPs in obesity risk prediction
In this study, genomic DNA was extracted from whole blood specimens of 139 individuals using the QIAamp DNA Mini Kit. Additionally, a customized Ion AmpliSeq panel containing 130 SNPs associated with obesity was designed using the Ion AmpliSeq Designer. Before the identification of informative SNPs by feature selection methods, all 130 SNPs were used to evaluate their predictive performance in obesity risk prediction. To evaluate the predictive performances of three various ML methods, fivefold cross-validation was repeated by randomized allocation for 100 rounds. Then, the average values of sensitivity, specificity, and accuracy were determined as well as 95% confidence interval (CI) values were determined. Table 2 shows that the SVM model trained with 130 SNPs performs better than KNN and J48 models in both predictive sensitivity and specificity. Overall, the SVM model yields an average accuracy of 0.67 in classifying 74 obese and 65 nonobese individuals. Additionally, Supplementary Figure S1 provides the comparison of ROC curves among the SVM, KNN, and DT models trained using 130 SNPs based on the evaluation of fivefold cross-validation.
Predictive Performance of Three Different Models Trained Using 130 Single-Nucleotide Polymorphisms on Obesity Risk Prediction
AUC, area under the curve of ROC; CI, confidence interval; DT, decision tree; KNN, k-nearest neighbor; MCC, Matthews correlations coefficient; SVM, support vector machine.
3.3. Examination of informative SNPs in obesity risk prediction
To determine the informative SNPs in obesity risk prediction, three feature selection methods were employed, and their performance in terms of predictive accuracy was compared. As presented in Figure 3, among the SVM models, the one trained using the SNPs selected by the stepwise MLR attained best performance; likewise, the KNN model also revealed significantly higher accuracy on the basis of stepwise MLR. By contrast, the J48 model performed best when using the SNPs selected by information gain of DT. Overall, the predictive models trained using the SNPs selected by the stepwise MLR exhibited the best performance in obesity risk prediction. An appropriate feature selection process can reduce the dimensionality of features and result in less intensive computation. Dimensionality reduction is an important issue especially in -omics studies, with hundreds or even thousands of features (Ghosh and Poisson, 2009; Guo et al., 2010). Feature selection is also crucial to avoid the curse of dimensionality, especially when the size of the data set is not sufficient. The stepwise MLR is a feature selection method based on statistics. The advantage of using the stepwise MLR may be correlated with the rule of gene expression. SNPs near or in the obesity genes potentially affect the transcription level.
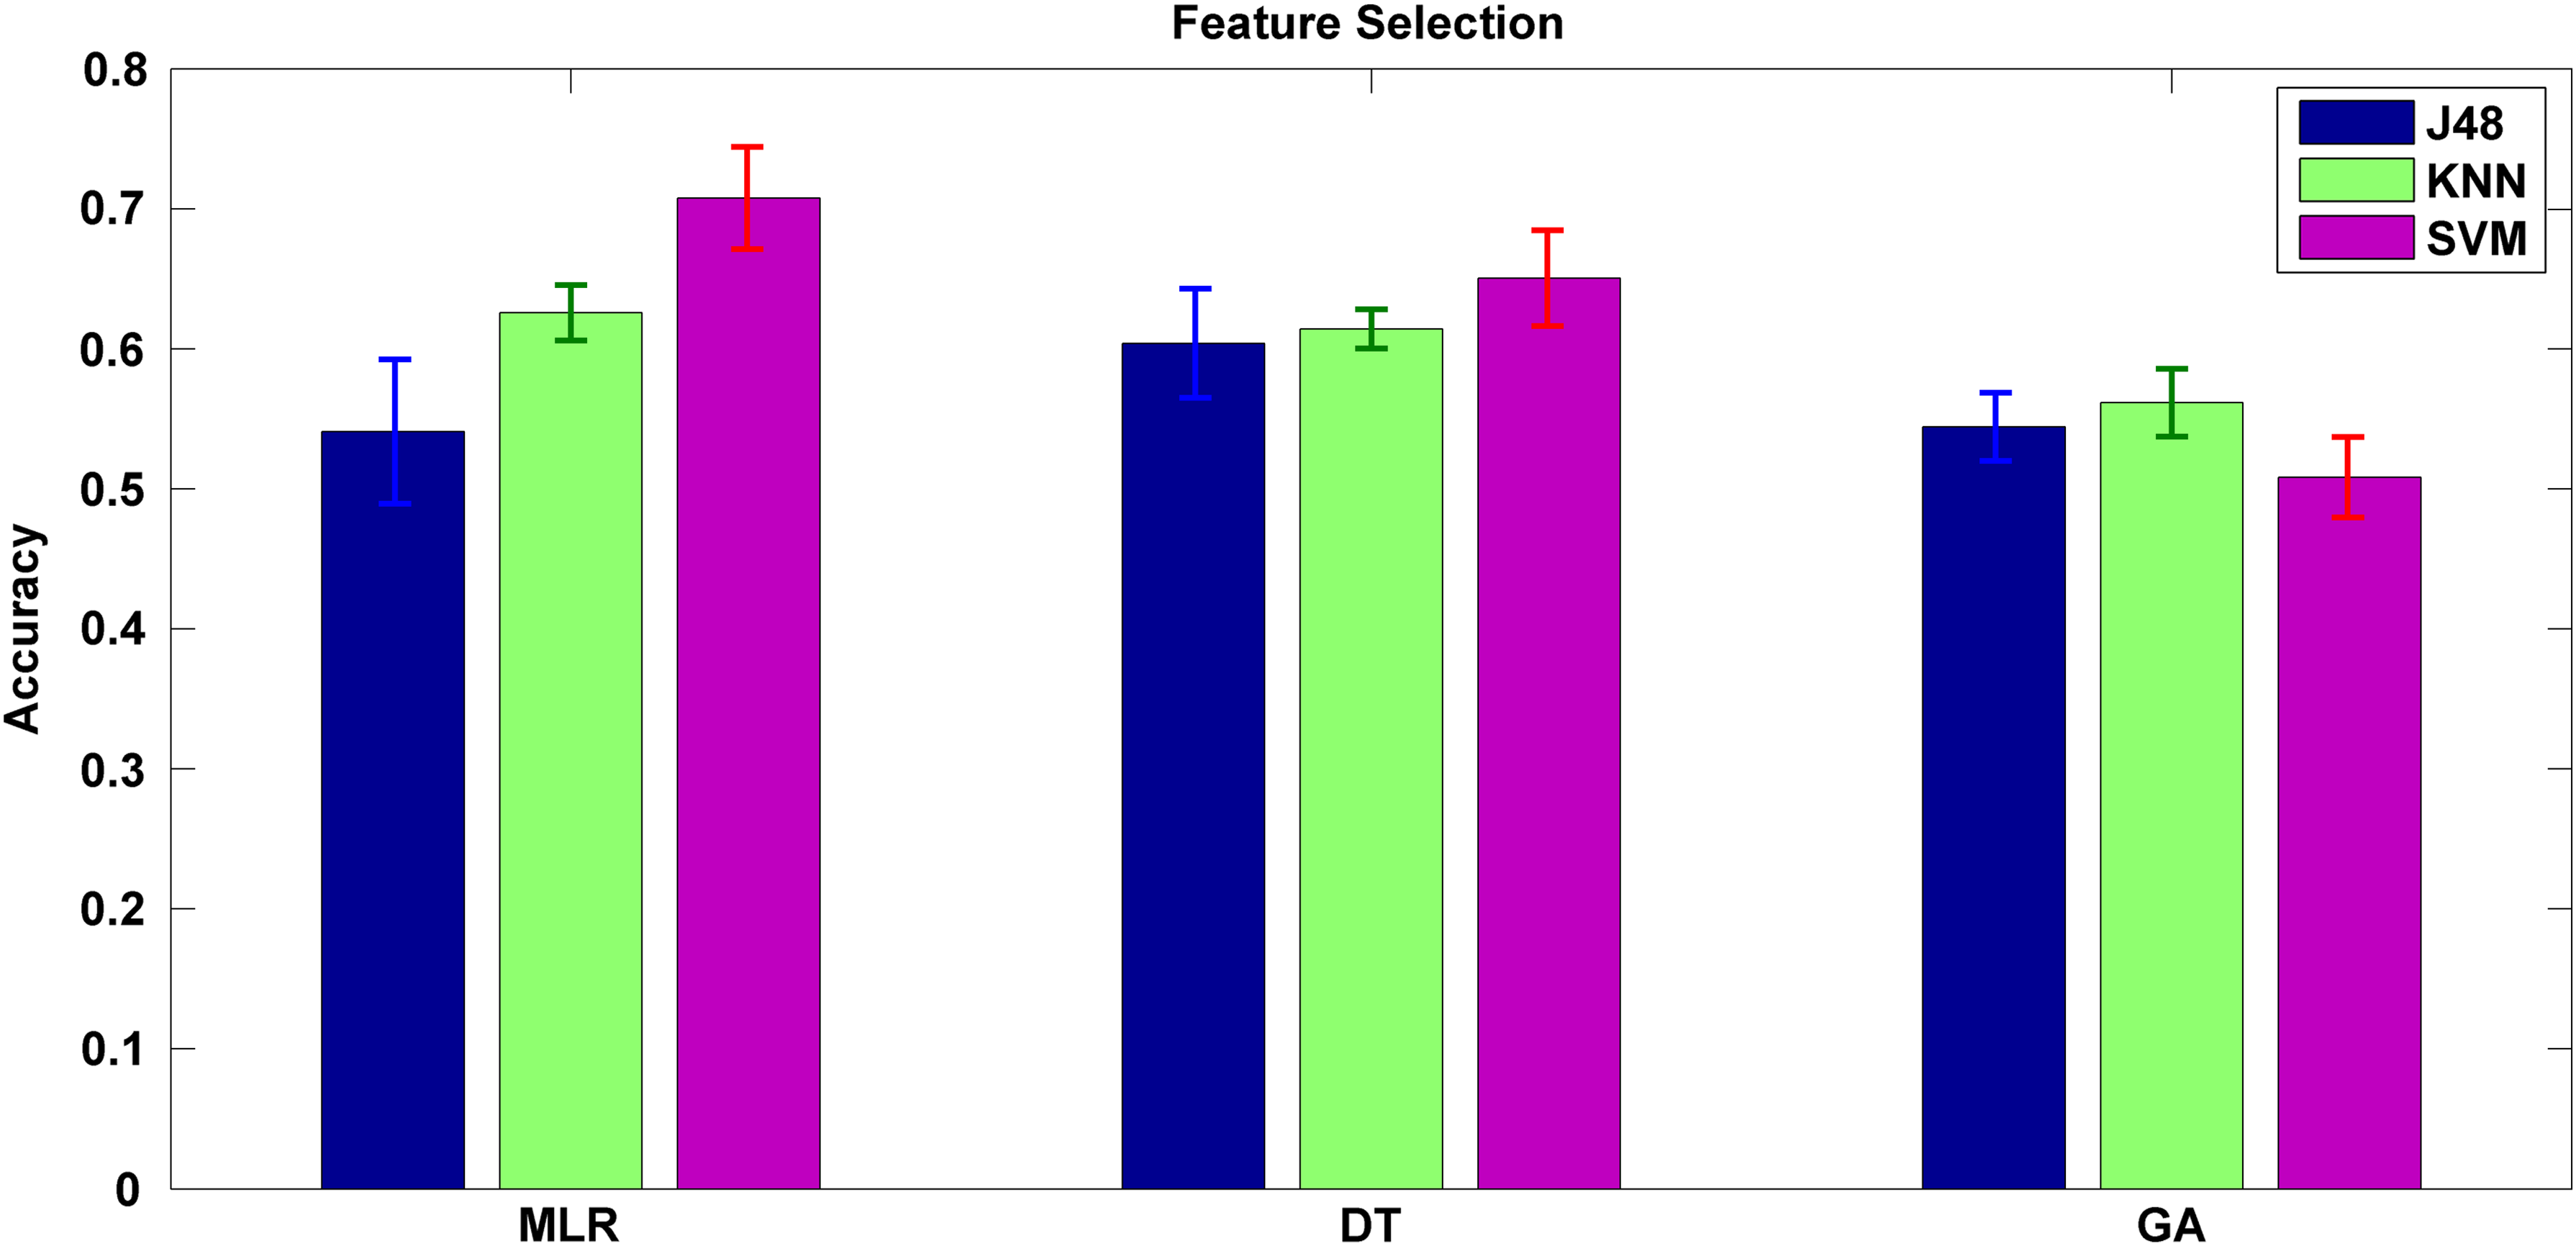
Predictive accuracy of various feature selection methods based on three ML methods. J48, KNN, and SVM models were designed on the basis of selected features obtained from MLR, DT, and GA. The results demonstrate that KNN and SVM models significantly (p < 0.05) attained higher accuracy based on MLR compared with DT or GA. DT, decision tree; GA, genetic algorithm; MLR, multivariate linear regression; KNN, k-nearest neighbor; SVM, support vector machine.
The number of mutant SNP alleles correlates with the transcriptional level and subsequent phenotype in a proportional manner. Consequently, the numeric relation between SNPs and BMI could be successfully illustrated by regression. According to the feature selection result of stepwise MLR, nine obesity-associated SNPs, including rs10501087, rs17700144, rs2287019, rs534870, rs660339, rs7081678, rs718314, rs9816226, and rs984222, and sex were selected as informative features to construct obesity risk prediction models. In this investigation, MLR analysis was performed to evaluate the significance of each variable (SNP); furthermore, one-way ANOVA with a statistical significance level of 0.05 was adapted to examine the accuracy and effect of various combinations of SNPs on discrimination between obese and nonobese individuals. Supplementary Table S2 presents the coefficients of the features (SNPs) in the regression equation and their significance values. In the combination of nine selected SNPs, four (rs10501087, rs534870, rs718314, and rs984222) were significantly associated with the accuracy of obesity risk prediction (p < 0.05).
3.4. Distribution of obese and nonobese individuals of nine selected SNPs
The distribution of individuals for nine selected SNPs according to three genotypes (wide type, heterozygous, and homozygous) is provided in Table 3. Wild type was predominant at SNPs rs17700144 (96.40%), rs2287019 (56.83%), rs7081678 (96.40%), rs718314 (50.36%), and rs9816226 (85.61%). By contrast, the heterozygous type was more abundant at SNPs rs10501087 (47.48%), rs534870 (53.24%), rs660339 (42.45%), and rs984222 (56.83%). However, the homozygous type was rare to absent for rs17700144 (0.00%), rs2287019 (2.88%), rs7081678 (0.00%), and rs9816226 (0.00%). Furthermore, Figure 4 provides more detailed information about comparing the distribution of obese (red chart) and nonobese (blue chart) individuals for each selected SNP. At SNP rs10501087, the number of obese individuals containing the homozygous type (23 samples) was significantly increased compared with nonobese individuals with the homozygous type (9 samples). Additionally, at SNP rs9816226, obese individuals also had a higher abundance of the homozygous genotype compared with nonobese individuals. However, at SNPs rs534870 and rs660339, obese individuals had a significant abundance of the heterozygous genotype compared with nonobese individuals. Obese individuals had a remarkable abundance of wild type at SNPs rs2287019 and rs984222.

Comparison of sample distributions of nine selected SNPs between obese and nonobese individuals.
Sample Distribution of the Nine Single-Nucleotide Polymorphisms Selected by Multivariate Logistic Regression
SNP, single-nucleotide polymorphism.
3.5. Performance comparison among ML methods considering only nine selected SNPs
Models trained on the basis of three different ML algorithms were compared regarding predictive accuracy. The SVM model trained using selected nine SNPs attained highest accuracy (0.71, 95% CI: 0.64–0.78), sensitivity (0.80, 95% CI: 0.72–0.88), and specificity (0.63, 95% CI: 0.54–0.72). As presented in Table 4, the SVM model significantly outperformed the KNN and DT models in obesity risk prediction. Moreover, the KNN model also significantly attained higher accuracy compared with the DT model. In an overall evaluation based on the nine SNPs selected by the stepwise MLR, the SVM model outperformed other ML methods in prediction of obesity risk. Moreover, based on the evaluation of fivefold cross-validation, the comparison of ROC curves among the SVM, KNN, and DT models trained only using nine SNPs is presented in Supplementary Figure S2. SVM has been reported as a superior ML method in some classification problems (Cruz and Wishart, 2006; Wang et al., 2016).
Predictive Performance of Three Different Models Trained Only Using Nine Selected Single-Nucleotide Polymorphisms on Obesity Risk Prediction
The accuracy of the SVM and KNN models significantly outperformed that of the DT model (p < 0.01). In addition, the accuracy of the SVM model was significantly higher than that of the KNN model (p < 0.01).
There are several advantageous features about the construction and calibration of SVM. First, SVM conducts relatively higher resistance to noise and outliers (Cruz and Wishart, 2006; Chang and Lin, 2011). This property makes it an adequate classifier in biomedical classification issues. Second, SVM performs well in nonlinear classification problems when incorporating an appropriate kernel function. In this study, RBF was used as the kernel function of SVM. Some clinical studies have reported that RBF kernel outperformed other kernel functions in generating SVM (Wang and Huang, 2011; Wang et al., 2016). The appropriateness of RBF kernel was also observed in this study. Third, only the models but not the entire data set is stored and used after training and validation, avoiding a massive demand of storage and computation. Briefly, the SVM model not only attains higher performance but also provides a cost-effective method appropriate for routine clinical practice.
3.6. Biological role and significance of the selected SNPs
Based on the stepwise MLR analysis, nine SNPs were selected to construct an SVM model with best performance in obesity risk prediction. As presented in Table 5, all nine SNPs were associated with obesity. In the SNP combination, rs10501087 is an intronic SNP located within the BDNF gene, which encodes a neurotrophin protein. BDNF and its receptor TrkB are key components in the MC4R signaling pathway, which plays an important role in the balance of energy and metabolism (Yeo and Heisler, 2012). Loss of BDNF function results in obesity (Gray et al., 2006). The relation between the BDNF gene and BMI was also studied in an East Asian population (Wen et al., 2012). It is hypothesized that variation in rs10501087 leads to obesity by reducing BDNF function. Another study also reported rs10501087 as a key BDNF-associated SNP in an obesity risk score (Speliotes et al., 2010). The importance of rs10501087 was also identified in the one-way ANOVA of this study. Generally, the finding was in accordance with the previous studies. Moreover, the nine SNPs were selected on the basis of best discrimination ability between obesity and nonobesity, consequently implying that the nine SNPs may be involved in the metabolic pathways associated with obesity.
List of Genomic Information of Nine Selected Single-Nucleotide Polymorphisms
EA, effect allele; WHR, waist-to-hip ratio.
3.7. Obstacles in applying obesity-associated SNPs in clinical practice
Obesity is attributed to multiple factors. The genome is the basic and intrinsic component that is influenced by environmental factors. The mechanism and level at which the intrinsic factors interact with the extrinsic factors define the development and severity of obesity. Consequently, a profile of obesity-associated SNPs could provide a basic illustration of obesity risk. Individuals with higher risk of intrinsic obesity risk should take more consideration upon exposure to other environmental factors, such as food intake, exercise, and lifestyle. Obesity-associated SNPs have been widely studied, mostly in Caucasian populations (Clement et al., 1995, 1996; Beamer et al., 1998; Pereira et al., 2003; Ma et al., 2010; Loos, 2012; Asai et al., 2013; Berndt et al., 2013; Wheeler et al., 2013).
To generate the population-specific obesity-associated SNPs profile, Chinese Han adults were included in this study. Although some obesity-associated SNPs have been studied and reported, the application of the SNPs in clinical practice remains limited. There are several contributing reasons. In addition to the variation of studied populations, it was doubtful whether the risk of each SNP could be integrated by simple summation. To address these issues, the ML methods were applied and evaluated in this study. The risk of a specific combination of SNPs could be studied comprehensively for a specific population.
To generate a population-specific obesity risk score, the sample size of this study may be not sufficient. The limitation was mainly attributed to the high cost of NGS tests. The performance of the ML models has been examined by fivefold cross-validation for 100 rounds to ensure a robust outcome. For wider clinical applications, external validation with a larger sample size is necessary. Moreover, the progressive reduction on the cost of NGS tests will also assist in the general application.
4. Conclusion
This investigation employed various feature selection methods, such as stepwise MLR, DT, and GA, to identify informative features for the construction of obesity prediction models. Evaluation by fivefold cross-validation indicated that the selected SNPs were effective in the detection of obesity risk based on 139 individuals. According to the MLR feature selection, nine SNPs, including rs10501087, rs17700144, rs2287019, rs534870, rs660339, rs7081678, rs718314, rs9816226, and rs984222, could provide the best predictive power (80.09% sensitivity, 63.02% specificity, and 70.77% accuracy) based on the SVM classifier. Additionally, the predictive model generated by SVM attained better performance than other ML methods. This work demonstrated that the ML-derived method could provide a feasible means for conducting preliminary analyses of obesity based on genetic characteristics.
This study used BMI as a measure of obesity because it is a simple and convenient determinant to identify obese participants. Other evaluating traits such as WC, WHR, body fat percentage, and the presence of early-onset extreme obesity have also been demonstrated to predict their associations with obesity in many studies (Loos, 2012). The aim of this work was to select SNPs from loci associated with BMI as well as those associated with other obesity-related traits. Of nine SNPs that were selected by MLR, four SNPs have been reported to be associated with BMI (rs10501087, rs2287019, rs660339, and rs9816226). This study also found three SNPs that were previously proposed to be associated with WHR (rs7081678, rs718314, and rs984222), and one SNP was confirmed to be related to each of body fat percentage (rs534870) and early-onset extreme obesity (rs17700144). This investigation has revealed the relationship between the loci of SNPs and the obesity-related traits (Table 5).
Footnotes
Acknowledgments
Publication charge for this work was funded by the Chang Gung Memorial Hospital (CMRPG3D0531 and CMRPG3C1372) and the Ministry of Science and Technology of Taiwan (MOST 106-2622-E-155-015-CC2), Taiwan. Availability of data and material: The sequencing data sets (74 obese individuals and 65 nonobese individuals) used and analyzed during the current study have been uploaded to NCBI sequence read archive (RSA) platform with the accession number SRP139885, which could be freely accessed online (![]() ).
).
Authors' Contribution
Conception and design: H.Y.W., W.Y.L., and T.Y.L. Development of methodology: H.Y.W., S.C.C., W.Y.L., and T.Y.L. Acquisition of data: H.Y.W. and S.C.C. Analysis and interpretation of data: H.Y.W., S.C.C., W.Y.L., C.H.C., B.Y.C., and T.Y.L. Writing, review, and/or revision of the article: H.Y.W., S.C.C., W.Y.L., C.H.C., S.H.C., K.Y.H., T.Y.L., and J.J.L. Administrative, technical, or material support: H.Y.W., S.C.C., C.H.C., and T.Y.L. Study supervision: T.Y.L. and J.J.L.
Author Disclosure Statement
The authors declare that no competing financial interests exist.
References
Supplementary Material
Please find the following supplemental material available below.
For Open Access articles published under a Creative Commons License, all supplemental material carries the same license as the article it is associated with.
For non-Open Access articles published, all supplemental material carries a non-exclusive license, and permission requests for re-use of supplemental material or any part of supplemental material shall be sent directly to the copyright owner as specified in the copyright notice associated with the article.