
Abstract
Abstract
Controlling complex networks through a small number of controller vertices is of great importance in wide-ranging research fields. Recently, a new approach based on the minimum feedback vertex set (MFVS) has been proposed to find such vertices in directed networks in which the target states are restricted to steady states. However, multiple MFVS configurations may exist and thus the selection of vertices may depend on algorithms and input data representations. Our attempts to address this ambiguity led us to adopt an existing approach that classifies vertices into three categories. This approach has been successfully applied to maximum matching-based and minimum dominating set-based controllability analysis frameworks. In this article, we present an algorithm as well as its implementation to compute and evaluate the critical, intermittent, and redundant vertices under the MFVS-based framework, where these three categories include vertices belonging to all MFVSs, some (but not all) MFVSs, and none of the MFVSs, respectively. The results of computational experiments using artificially generated networks and real-world biological networks suggest that the proposed algorithm is useful for identifying these three kinds of vertices for relatively large-scale networks, and that the fraction of critical and intermittent vertices is considerably small. Moreover, an analysis of the signal pathways indicates that critical and intermittent MFVSs tend to be enriched by essential genes.
1. Introduction
C
Various kinds of mathematical models and methods have been utilized to reveal the detailed properties of complex networks, such as master equations (Prigogine and Nicolis, 1977), Monte-Carlo methods (Gillespie, 1977), a stochastic model (Cai and Yuan, 2009), ordinary differential equations (Goodwin et al., 1963; Novak et al., 2001; Tyson et al., 2001), Boolean networks (Akutsu et al., 2012; Melkman and Akutsu, 2013), and other mathematical models. The general approach to controlling a complex network is to drive the system from any given state to any desired state in finite time by selecting a subset of vertices in the network as control vertices (driver vertices) and to control this subset directly from the outside.
Liu et al. (2011) showed that determining structural controllability of a network with linear dynamics is reduced to computing a maximum matching (MM) of the corresponding bipartite graph. They also showed that the identification of a minimum set of driver vertices can be reduced to the same problem. Since MM is not necessarily uniquely determined, there may be multiple candidates for the set of driver vertices. Accordingly, Jia et al. (2013) classified the vertices into three categories: critical, intermittent, and redundant control vertices. The definition of MM-based control vertices has found various applications (Cowan et al., 2012; Wang et al., 2012). These studies showed that although relatively small sets of control vertices are necessary to control random networks, large sets of control vertices are required to control networks with a scale-free structure (>80% with the parameter of
Nacher and Akutsu (2012) coped with this difficulty by introducing an MDS (minimum dominant set)-based approach to control complex networks. In a graph G, a dominant set (DS) is a set of vertices S with the property that every vertex in G is either an element of S or belongs to the adjacent list of a vertex in S, and an MDS is a DS with the minimum number of elements. They claimed to have reduced the number of control vertices to fewer than 20% for some types of scale-free networks. Note that, contrary to the MM-based approach, it is assumed in the MDS-based approach that each control vertex can control all of its links independently. Since an MDS is not necessarily uniquely determined, they also developed an algorithm to classify the vertices into those that are critical, intermittent, and redundant based on the MDS (Nacher and Akutsu, 2014). The MDS-based approach has also been applied to various areas (Nacher and Akutsu, 2016), which include the analysis of protein–protein interaction (PPI) networks (Wuchty, 2014; Zhang et al., 2015; Ishitsuka et al., 2016; Wuchty et al., 2017) as well as identifying relationships between human diseases and noncoding RNAs (Kagami et al., 2015) and the analysis of social networks (Sun, 2015).
Mochizuki et al. (2013) proposed another approach based on the feedback vertex set (FVS). In a graph G, an FVS is a set of vertices S with the property that removal of all the vertices in S results in G becoming acyclic, and an FVS with the minimum number of elements is known as a minimum feedback vertex set (MFVS). They showed that any FVS can be a set of control vertices if the target states are restricted to steady states and periodically steady states (i.e., attractors) for a wide class of networks (Mochizuki et al., 2013), where it was previously known that a close relationship between an FVS and steady states in Boolean networks exists (Akutsu et al., 1998). Since the target states are restricted in the MFVS-based approach, it is expected in many cases that much smaller sets of driver vertices are required than in the MM- and MDS-based approaches. Although the MFVS-based approach by Mochizuki et al. (2013) seems to be useful, the approach has two drawbacks: no efficient algorithm for selecting the MFVS is shown, and an MFVS is not necessarily uniquely determined as in the MM- and MDS-based cases.
In this article, we introduce an algorithm as well as its implementation for solving the structural controllability problem on a directed complex network through the MFVS-based approach. In addition, we present an algorithm to classify vertices into the mentioned three categories under the MFVS-based approach: critical control vertices (or critical vertices) denoting the vertices belonging to every MFVS, intermittent control vertices (or intermittent vertices) denoting the vertices that belong to some (but not all) of the MFVSs, and redundant control vertices (or redundant vertices) denoting the vertices not belonging to any MFVS.
Because the MFVS problem belongs to the class of non-deterministic polynomial (NP) complete problems (Garey and Johnson, 1979), it is not plausible that a polynomial time algorithm exists. However, NP-hardness does not necessarily mean that we cannot develop practical algorithms. In this regard, a heuristic algorithm to perform graph contraction would enable us to reduce the size of the original problem by noting that some of the vertices in G must be/cannot be in any MFVS and directly removing these vertices from G (Smith and Walford, 1975; Wang et al., 1985; Levy and Low, 1988; Lin and Jou, 2000). That is, the application of a graph contraction procedure to the MFVS calculation would definitely allow us to gain a more optimal speed performance benefit by reducing the size of the problem. After reducing the graph size, we could utilize an integer linear programming (ILP)-based algorithm to determine the types of vertices. Among the graph contraction approaches, Levy and Low (1988) presented a canonical graph contraction procedure consisting of the steps named IN0/OUT0/IN1/OUT1/LOOP. This approach has been successfully applied variously in areas such as determining Scan Flip-Flop (Cheng and Agarwal, 1900; Ashar and Malik, 1994) and the simulation of the energy system of a building (Sowell and Haves, 2001).
In this work, we utilize this approach to speed up the calculation of MFVSs. However, since our goal is to calculate critical/redundant vertices, we would need to make considerable modifications to this contraction algorithm to suit our situation. We would also need to modify the ILP-based algorithm for the same purpose.
In this article, we first present our modified contraction algorithm, which is suitable for the calculation of critical/redundant vertices through the MFVS-based approach. Next, we present our main algorithm for calculating critical/redundant vertices. Then, we perform computational experiments using two types of random directed networks: those with an ErdŐs-Rényi structure and those with a scale-free structure. We also apply our critical/redundant vertices calculation algorithm to real-world biological networks. Finally, we conclude with future work.
2. Methods
In this section, we introduce our preprocessing procedure (modified graph contraction procedure), our main algorithm for calculating critical/redundant vertices through an MFVS as well as a way to determine the critical/redundant/intermittent status of some vertices that are ignored in the preprocessing procedure. First, we introduce the definition of the MFVS as well as the definitions of CMFVS/RMFVS/IMFVS.
An instance of a set of MFVS for G is denoted as
Here it is noteworthy that although there may be multiple MFVS configurations for a graph G, there is only one CMFVS/RMFVS/IMFVS configuration for each graph.
Figure 1 shows an example of critical vertices (red elliptical vertices), redundant vertices (yellow elliptical vertices), and intermittent vertices (green elliptical vertices). In this graph, there are two MFVSs, {vertex 2, vertex 5} and { vertex 2, vertex 6}. Since vertex 2 belongs to all MFVSs, vertex 2 is a critical vertex. Since vertices 5 and 6 are in some but not all MFVSs, vertices 5 and 6 are intermittent vertices. Since vertices 1, 3, and 4 are not in any MFVS, vertices 1, 3, and 4 are redundant vertices. Thus, in this graph
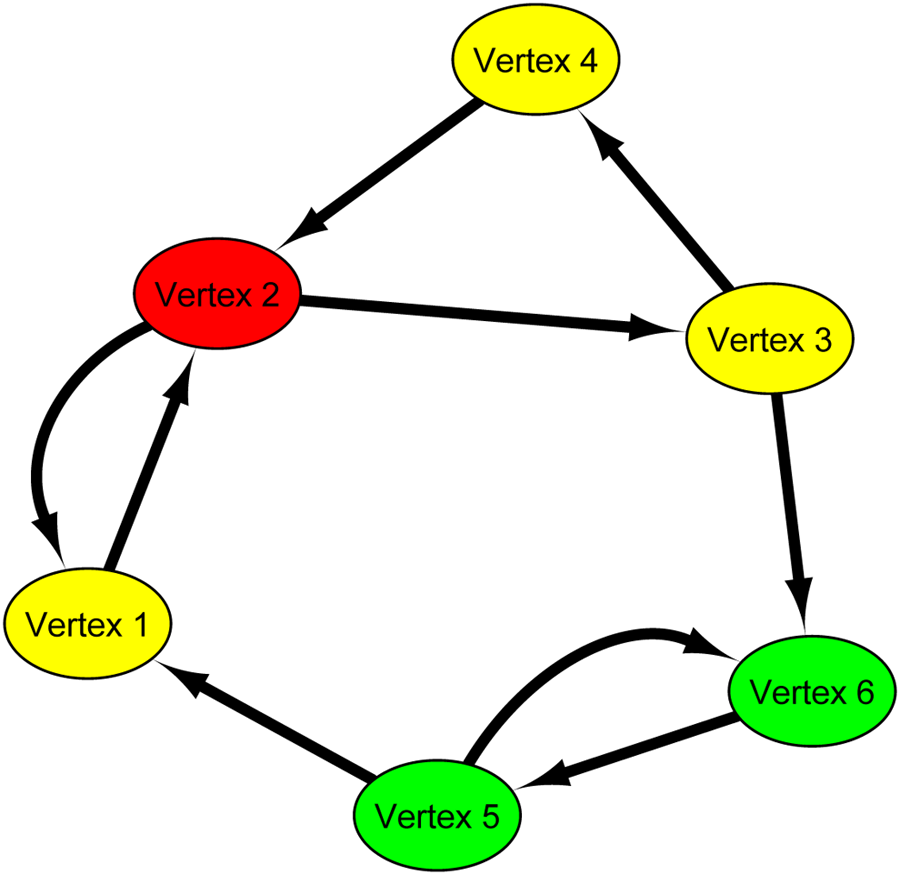
Illustrative example of critical vertices (red elliptical vertices), redundant vertices (yellow elliptical vertices), and intermittent vertices (green elliptical vertices). This graph contains two MFVSs,
Our algorithm consists of three parts in total: the preprocessing procedure (modified graph contraction procedure) of the critical/redundant MFVS calculation, the main algorithm of the critical/redundant MFVS calculation, and determination of the critical/redundant status of the remaining vertices of unknown status. The preprocessing section describes the modification of the graph contraction procedure developed by Levy and Low (1988) to suit our critical/redundant MFVS calculation, and we also provide the pseudocode of our modified preprocessing algorithm as
Modified IN0/OUT0/LOOP for critical/redundant MFVS calculation
Modified IN1/OUT1 for critical/redundant MFVS calculation
2.1. Preprocessing for critical/redundant vertex calculation
2.1.1. Graph contraction algorithm for MFVS calculation
Studies on graph contraction for calculating MFVS have already been carried out, and we start by briefly introducing the most widely known graph contraction steps described in Levy and Low (1988):
In Figure 2, we provide an example of the graph contraction procedure developed by Levy and Low (1988) In the original graph (left top graph), vertex 1 is contracted by the IN0 procedure. After vertex 1 is contracted, vertex 6 is contracted by OUT0 procedure (right top graph). After vertices 1 and 6 are contracted, vertices 2 and 4 are contracted by the IN1/OUT1 procedure (middle two graphs). Finally, vertices 3 and 5 are contracted by the LOOP procedure (bottom graph).
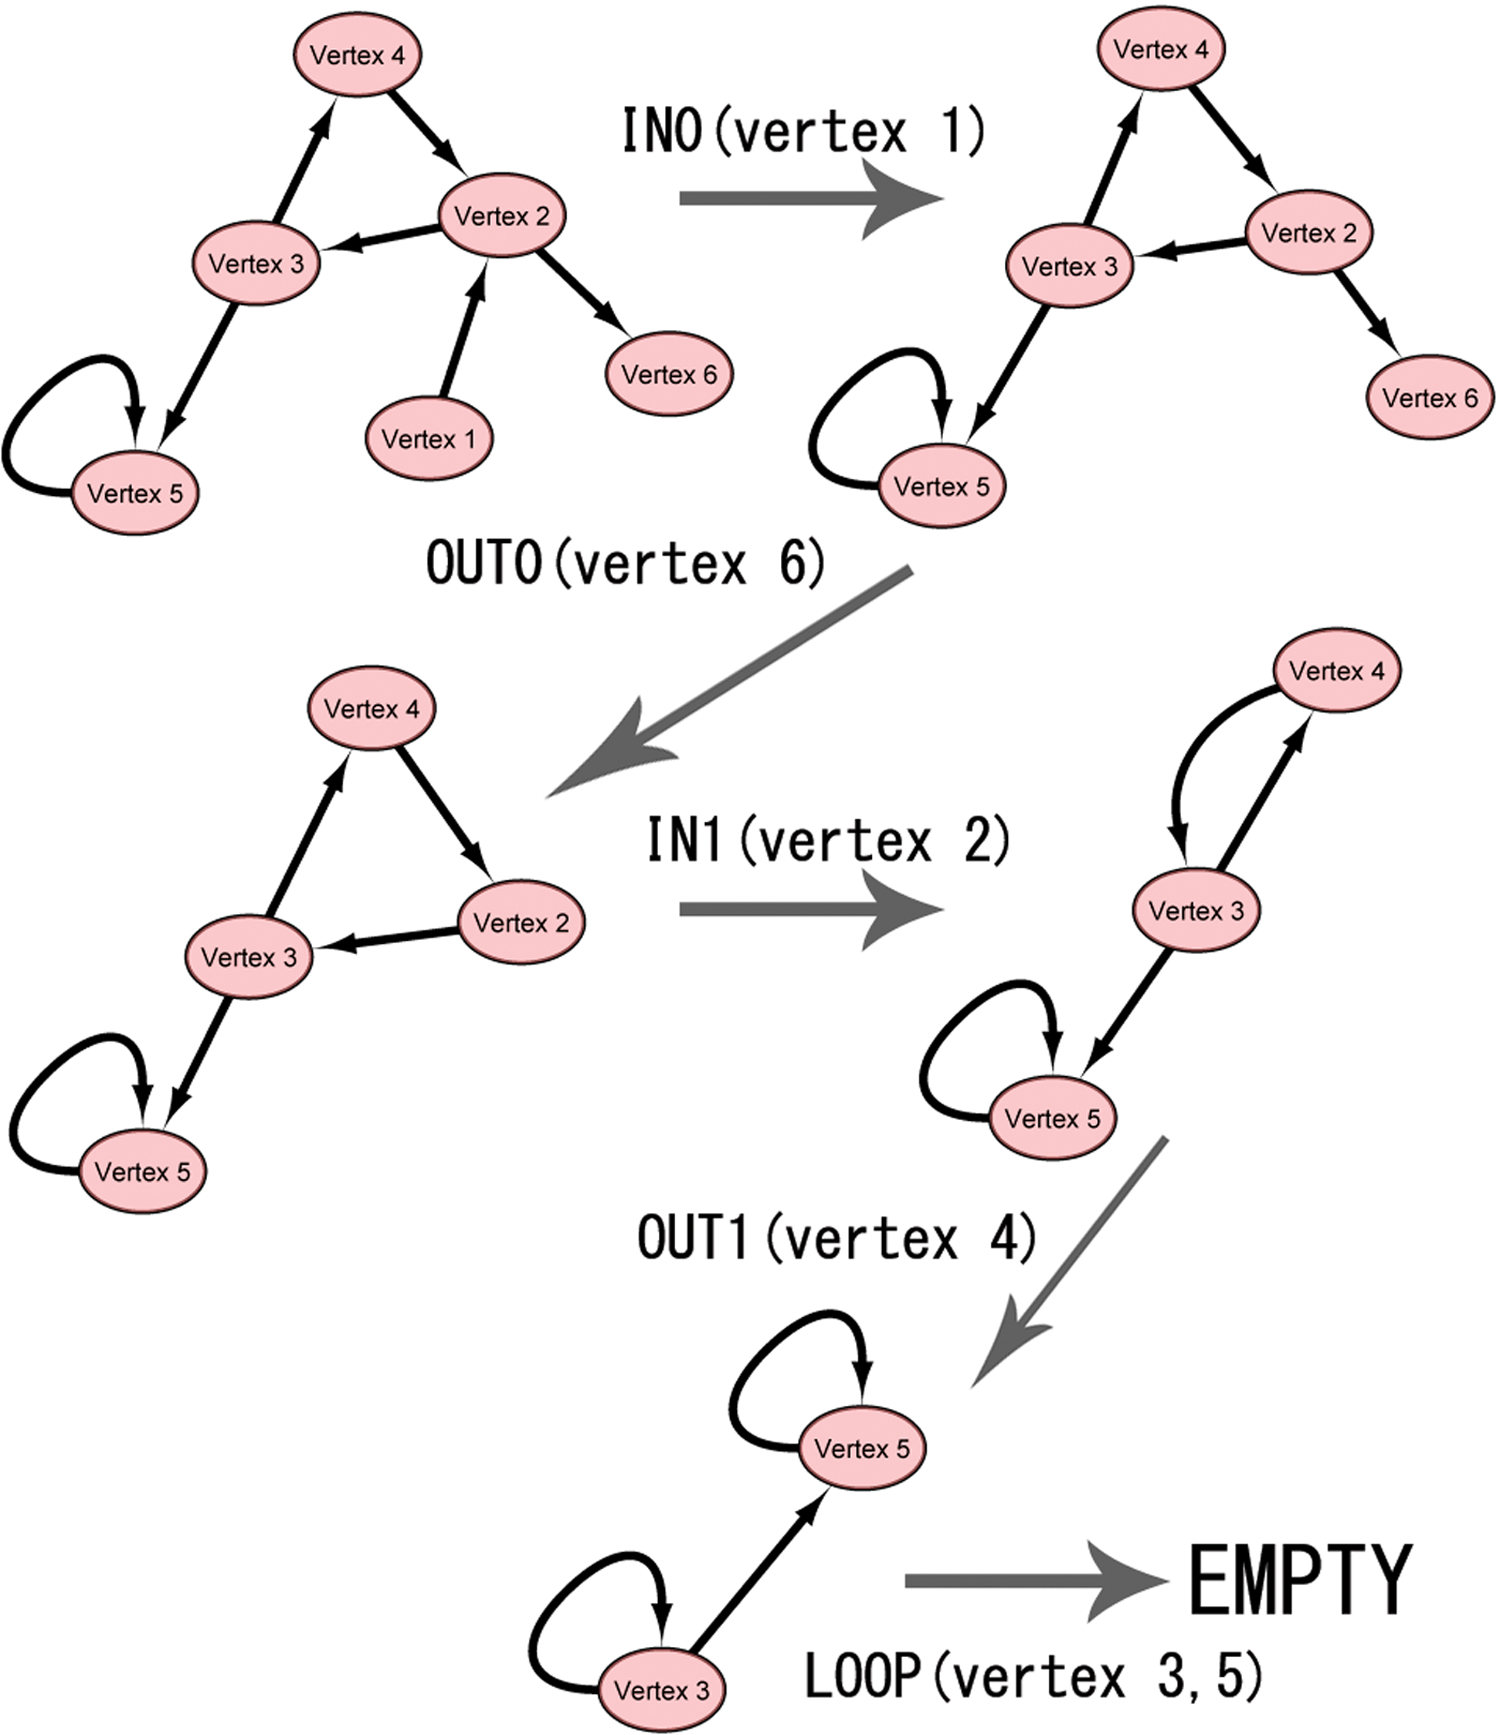
Example of graph contraction procedure developed by Levy et al. In the original graph (top left), vertex 1 is contracted by the IN0 procedure. Next, vertex 6 is contracted by the OUT0 procedure (top right), after which vertices 2 and 4 are contracted by the IN1/OUT1 procedure (middle two graphs). Finally, vertices 3 and 5 are contracted by a LOOP procedure (bottom).
The graph contraction algorithm illustrated in Figure 2 enables us to reduce the size of the graph without affecting the MFVS status.
As we want to use the graph contraction algorithm for the critical/redundant MFVS calculation, we need to alter this algorithm to accommodate our situation.
2.1.2. IN0/OUT0/LOOP for critical/redundant MFVS calculation
In this section we focus on introducing our modification to IN0/OUT0/LOOP. We present a theoretical discussion and the pseudocode of our modified algorithm as
Proof. Given a directed graph
In addition, we have Corollary 1 as a generalization of Theorem 1.
Proof. If a vertex v is contracted by the LOOP procedure, v necessarily contains a self-loop, which must exist in G before graph contraction. For any MFVS, we notice that vertex v must be selected into this MFVS to break the cycle
The pseudocode of the modified preprocessing algorithms for the IN0/OUT0/LOOP procedure of the critical/redundant MFVS calculation is shown in Algorithm 1.
2.1.3. IN1/OUT1 for critical/redundant MFVS calculation
In this section we continue introducing our modification to IN1/OUT1. As in the previous section, we start with some theoretical discussions before we provide a detailed introduction of our modified algorithm for IN1/OUT1. We additionally present the pseudocode as
Proof. First, we provide proof that u and v cannot appear in the same instance of
Assume that v is a critical vertex. Then, for any
Before introducing the next theorem, we define the concept of a chain map (CHM).
We have Theorem 4 and Corollaries 2 and 3 as follows:
Proof. We can prove that u and v are not in the same instance of
According to Theorem 3, neither u nor v is a critical vertex.
Suppose v is a redundant vertex and we assume that u is not a redundant vertex, then there must be some MFVSs that contain u. Notice that since all the loops passing u also pass v, we can create a new MFVS by replacing u with v, which means that there is an MFVS that contains v. Since we already know that v is not in any MFVS, u must be a redundant vertex. Suppose v is an intermittent vertex, that is, v must be in some MFVSs of G. We notice that all loops passing v also pass u, then we obtain a new MFVS by replacing v with u, which implies that u is also in some of the MFVSs. Since u is not a critical vertex, u must be an intermittent vertex. ■
Then, we introduce our modified algorithm for IN1/OUT1 critical/redundant MFVS calculation.
For the OUT1 critical/redundant MFVS calculation, let v be the vertex with out-degree 1 and let u be the successor of v. Then there are two states for u depending on whether u is a predecessor of v.
1: u is a predecessor of v.
2: u is not a predecessor of v.
For case 1, in which vertex u is a predecessor of v, there are three possible situations depending on 1-1: If 1-2: If 1-3: If
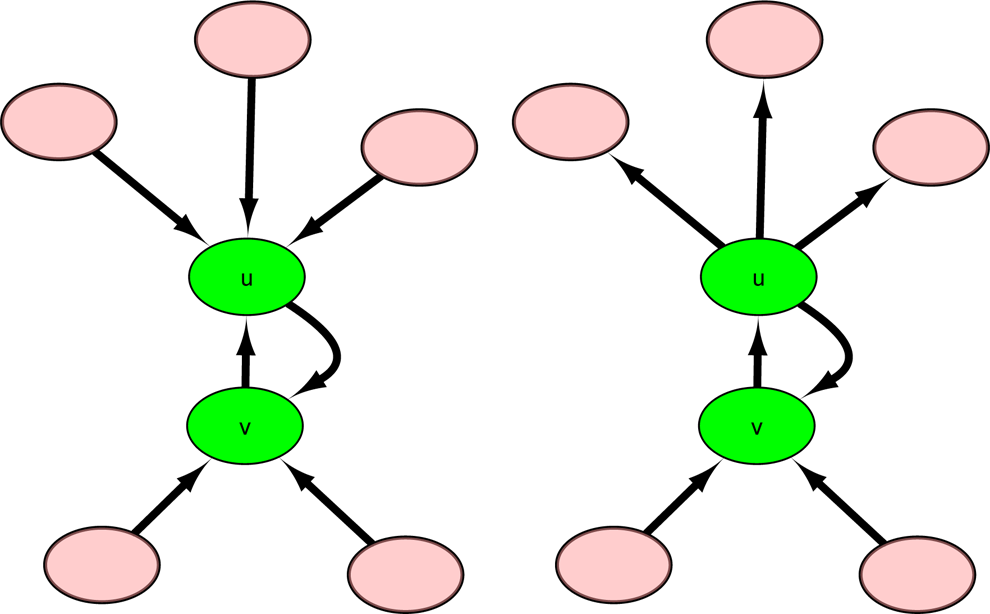
Illustration of graph containing vertex u in which the out-degree or in-degree of u equals 1 for cases 1-1 and 1-2. In these two cases, both u and v are intermittent vertices (green elliptical vertex), and we can remove u and v from the graph.
Before discussing the solution to case 1-3, first we provide the definition of noncritical MFVS as well as a self-connection (SC) (Fig. 4).
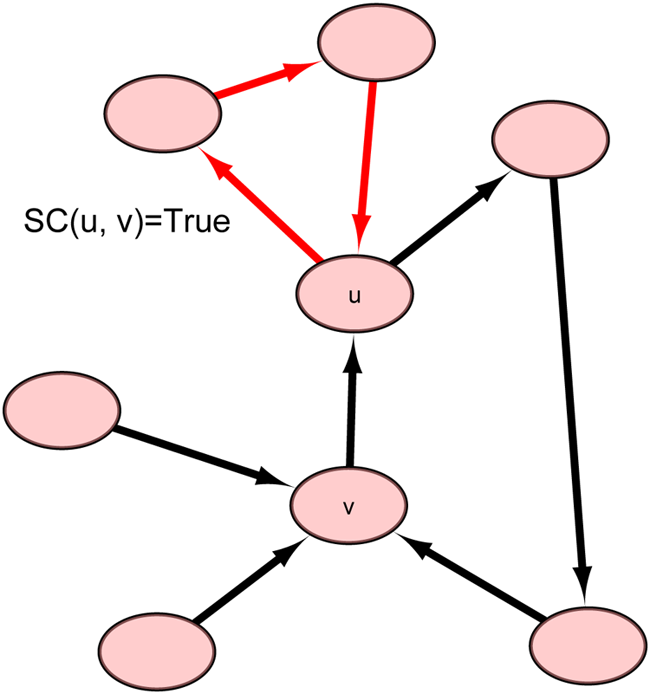
Illustration of self-connection of u except v [SC(
Then case 1-3 is divided into the following two situations according to whether 1-3-1: If 1-3-2: If

Illustration of graph containing vertex u in which neither the out-degree nor the in-degree of u equals 1. In the case on the left (case 1-3-1), v is covered by u and is represented by a red rectangular vertex, which means that v is not a critical vertex. In the case on the right (case 1-3-2), both u and v are marked as intermittent vertices and are removed from the graph (green elliptical vertex)
For case 2 wherein vertex u is not a predecessor of v, there are also three cases according to 2-1: if 2-2: if 2-3: if
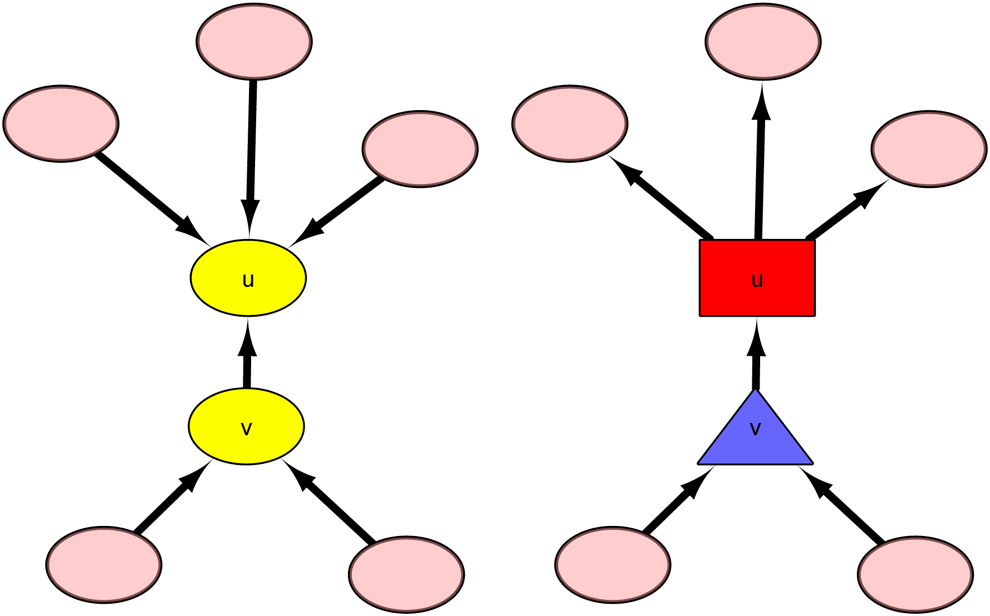
Illustration of graph containing vertex u for case 2-1 (on the left) and 2-2 (on the right). In the first case, both u and v are redundant vertices and can be removed from the graph. In the second case, v (blue triangular vertex) is chained by u, which is marked as a noncritical vertex (red rectangular vertex).
Before discussing case 2-3, we introduce the definition of a loop connection (LC) (Fig. 7):
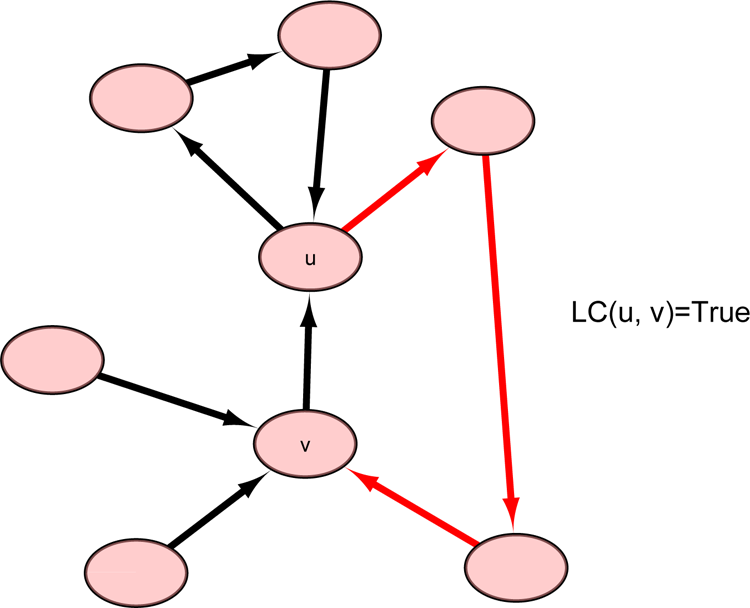
Illustration of a loop connection between u and v [LC(
Then case 2-3 can also be further divided into four situations according to whether 2-3-1: if 2-3-2: if 2-3-3: if 2-3-4: if
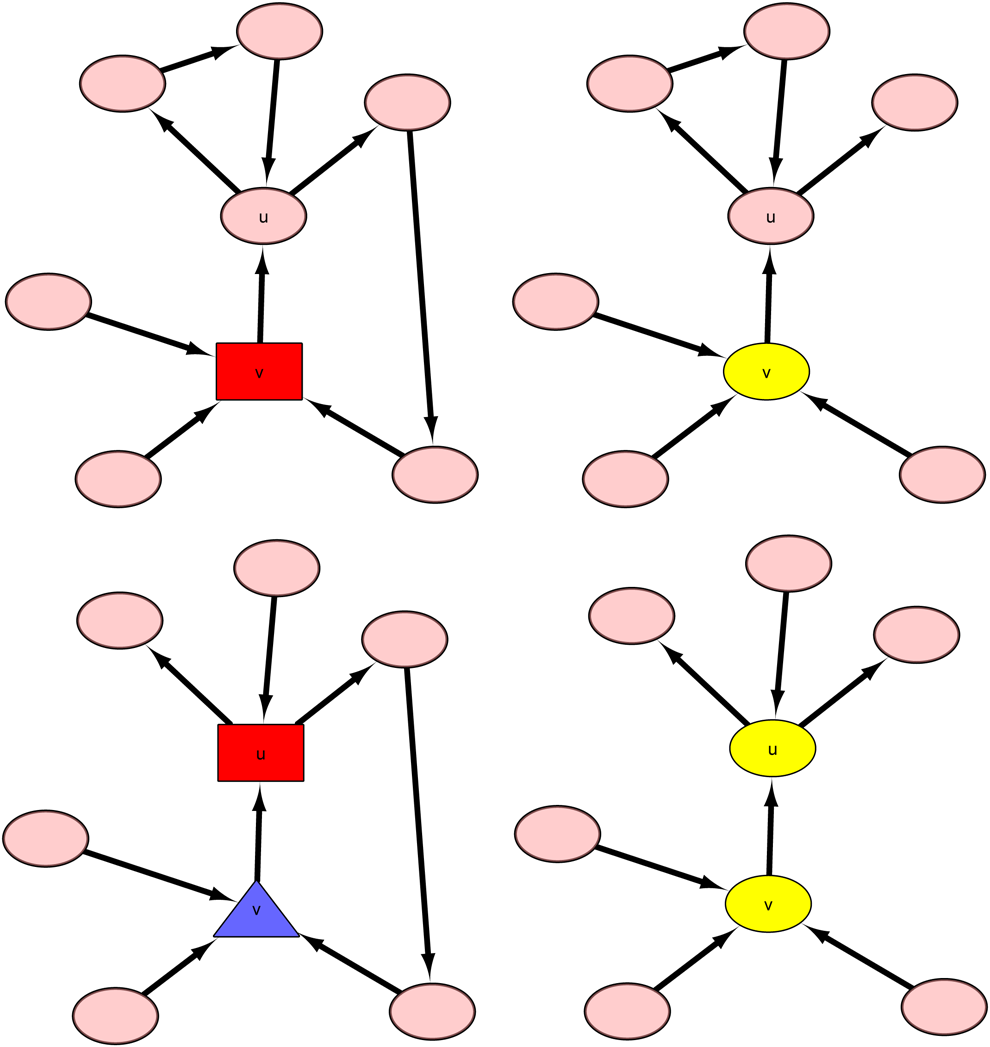
Illustration of a graph containing vertex u and in which neither the out-degree nor in-degree of u equals 1. In case 2-3-1 (top left), v (red rectangular vertex) is covered by u, which means that v is not a critical vertex. In case 2-3-3 (bottom left), v (blue triangular vertex) is chained by u and can be merged into u, and u is marked as a noncritical vertex (red rectangular vertex). In case 2-3-1 (top right), since v (yellow elliptical vertex) is not in any loops of G, v is a redundant vertex and can be removed from the graph. In case 2-3-4 (bottom right), since neither u nor v are in any loops of G, they are marked as redundant vertices and removed from the graph.
The
The pseudocode of the modified preprocessing algorithms for the IN1/OUT1 procedure of the critical/redundant MFVS calculation is shown in Algorithm 2.
Then we can iteratively use the modified IN0, OUT0, IN1, OUT1, and LOOP to contract the graph until no vertex can be contracted.
2.2. Critical/redundant MFVS calculation algorithm
After graph contraction, let all the vertices remaining in the contracted graph be 1. Calculate the MFVS of the contracted graph and let it be 2. Let 3. Repeat steps 4–6 for all v for which 4. Create an ILP instance Iv by adding a constraint of 5. Obtain the solution of Iv and let 6. If 7. Return
In addition, we perform the redundant calculation through the following steps:
1. Calculate the MFVS of the contracted graph and let it be 2. Let 3. Repeat steps 4–6 for all v for which 4. Create an ILP instance Iv by adding a constraint of 5. Obtain the solution of Iv and let 6. If 7. Return
2.2.1. ILP formalization for calculating MFVS
Since the critical/redundant driver vertices calculation algorithm already described utilized the MFVS calculation algorithm, we will further introduce the MFVS calculation algorithm.
Given a directed graph
where
Then we use the mentioned ILP formalization to perform the MFVS calculation in the critical/redundant MFVS calculation algorithm.
2.3. Determination of the critical/redundant status of the remaining vertices with unknown status
According to Corollary 3, for each pair
Until now all the vertices in
3. Results
3.1. Computational analysis using artificial networks
In this section we present the results of some computational analyses with our algorithm by using artificial networks of the ErdŐs-Rényi structure as well as artificial networks of the scale-free structure. A scale-free network is a network of which the degree distribution follows a power law, at least asymptotically. That is, the fraction
Firstly, we analyzed the relationship between
Because it is possible for the ErdŐs-Rényi model to generate dense graphs, to determine the performance of a dense graph, we decreased the graph size
Since we need to perform an MFVS calculation using an ILP optimization, we need to select an ILP optimizer to perform this task. In our implementation, we provided two kinds of ILP optimizing models using CPLEX from the IBM CPLEX Optimizer as well as glpsol from GLPK (GNU Linear Programming Kit) package; since the optimizing speed of CPLEX is much faster than that of glpsol, we select CPLEX as our ILP optimizer to obtain the following results.
The results are shown in Figures 9 and 10. The results show that for both of the two kinds of graph structures, as the graph becomes denser,

The top figure shows the relationship between pc and

The top figure shows the relationship between the number of edges and
3.2. Efficiency of preprocessing of critical/redundant MFVS calculation for networks with different structure
We continue to evaluate the efficiency of the preprocessing procedure of our algorithm. For a graph generated through the ErdŐs-Rényi model, we evaluated the time cost of our algorithm with and without the preprocessing procedure using random graphs with

Relationships between computational time and density of the graph. The top and bottom figures show the results for graphs with the ErdŐs-Rényi and scale-free structures, respectively. The results indicate that as the graph becomes sparse, the computational time of both kinds of graph is satisfactory with the preprocessing procedure; however, as the graph becomes denser, the efficiency of preprocessing for both kinds of graph diminishes until at some point there is no difference between the computational time with and without the preprocessing procedure.
The results indicate that the time complexity of the graph generated through the ErdŐs-Rényi model again shows the same tendency compared with that of the graph with a scale-free structure. As the graph becomes denser, the efficiency of the preprocessing procedure is reduced. This can be explained by the assumption that, as the graph becomes denser, there are fewer vertices in the graph that meet the condition for graph contraction, thus fewer vertices are contracted by the preprocessing procedure, and at some point the two lines representing the computational time with and without preprocessing coincide with each other, meaning that no further vertices are being contracted by the preprocessing procedure.
3.3. Computational analysis using real-world networks
The computational techniques already developed allow us to explore the impact of the MFVSs on real biological systems such as signaling networks. Intracellular signaling pathways are essential to coordinate developmental processes and cell responses to environmental changes in multicellular organisms composed of various tissues and organs. These organisms are referred to as metazoans (Pires daSilva and Sommer, 2003). A recent paradigm shift has fueled the biological role and importance of these pathways by expanding the conceptual signaling functionality beyond simple linear cascades (Papin et al., 2005). The resulting modern view also considers the complex interactions between pathways (cross-talks) as a functional part of the interdependent complex signaling network. Although the emergence of this new signaling network has encouraged further computational and statistical analysis, its importance has also been stressed by discoveries that link cancer, diabetes, and neurodegenerative disorders to specific failures in signaling pathways (Bauer Mehren et al., 2009).
Here, we used the SignaLink2.0 database to compile data for signaling proteins and directed signaling interactions between pairs of proteins of Caenorhabditis elegans, Drosophila melanogaster, and Homo sapiens organisms (Korcsmáros et al., 2010). The H. sapiens data correspond to the core of signaling proteins essential for transmitting the signal of its pathway. The multilayer structure of the SignaLink2.0 allows us to investigate several types of networks independently. Here, we considered a directed signaling protein interaction network, a network composed of transcriptional factors, and the integration of both of these networks. Table 1 gives the network statistics for each organism.
This table also shows the enrichment of the fraction of essential genes that are also identified as critical (Enrichment (C)) and intermittent control nodes (Enrichment (I)) by the MFV set algorithm. The statistical significance is assessed by performing Fisher's exact test and the two-tailed p-value is shown next to each enrichment value.
CMFVS, critical MFVS; IMFVS, intermittent MFVS; MFVS, minimum feedback vertex set; PPI, protein–protein interaction; RMFVS, redundant MFVS.
The computation of the MFVS and the associated control categories CMFVS, IMFVS, and RMFVS was performed on the three metazoan organisms and three types of networks already mentioned. Figure 12 shows that the MFVS fraction represents <10% of nodes in the directed PPI network and even around 5% or less for the integrated signaling network. This fraction decreases with biological complexity from human to C. elegans. Second, together with the absence of critical proteins in C. elegans, we observed that the critical fraction remains very small in D. melanogaster and H. sapiens organisms, less than 3% and 2%, respectively.
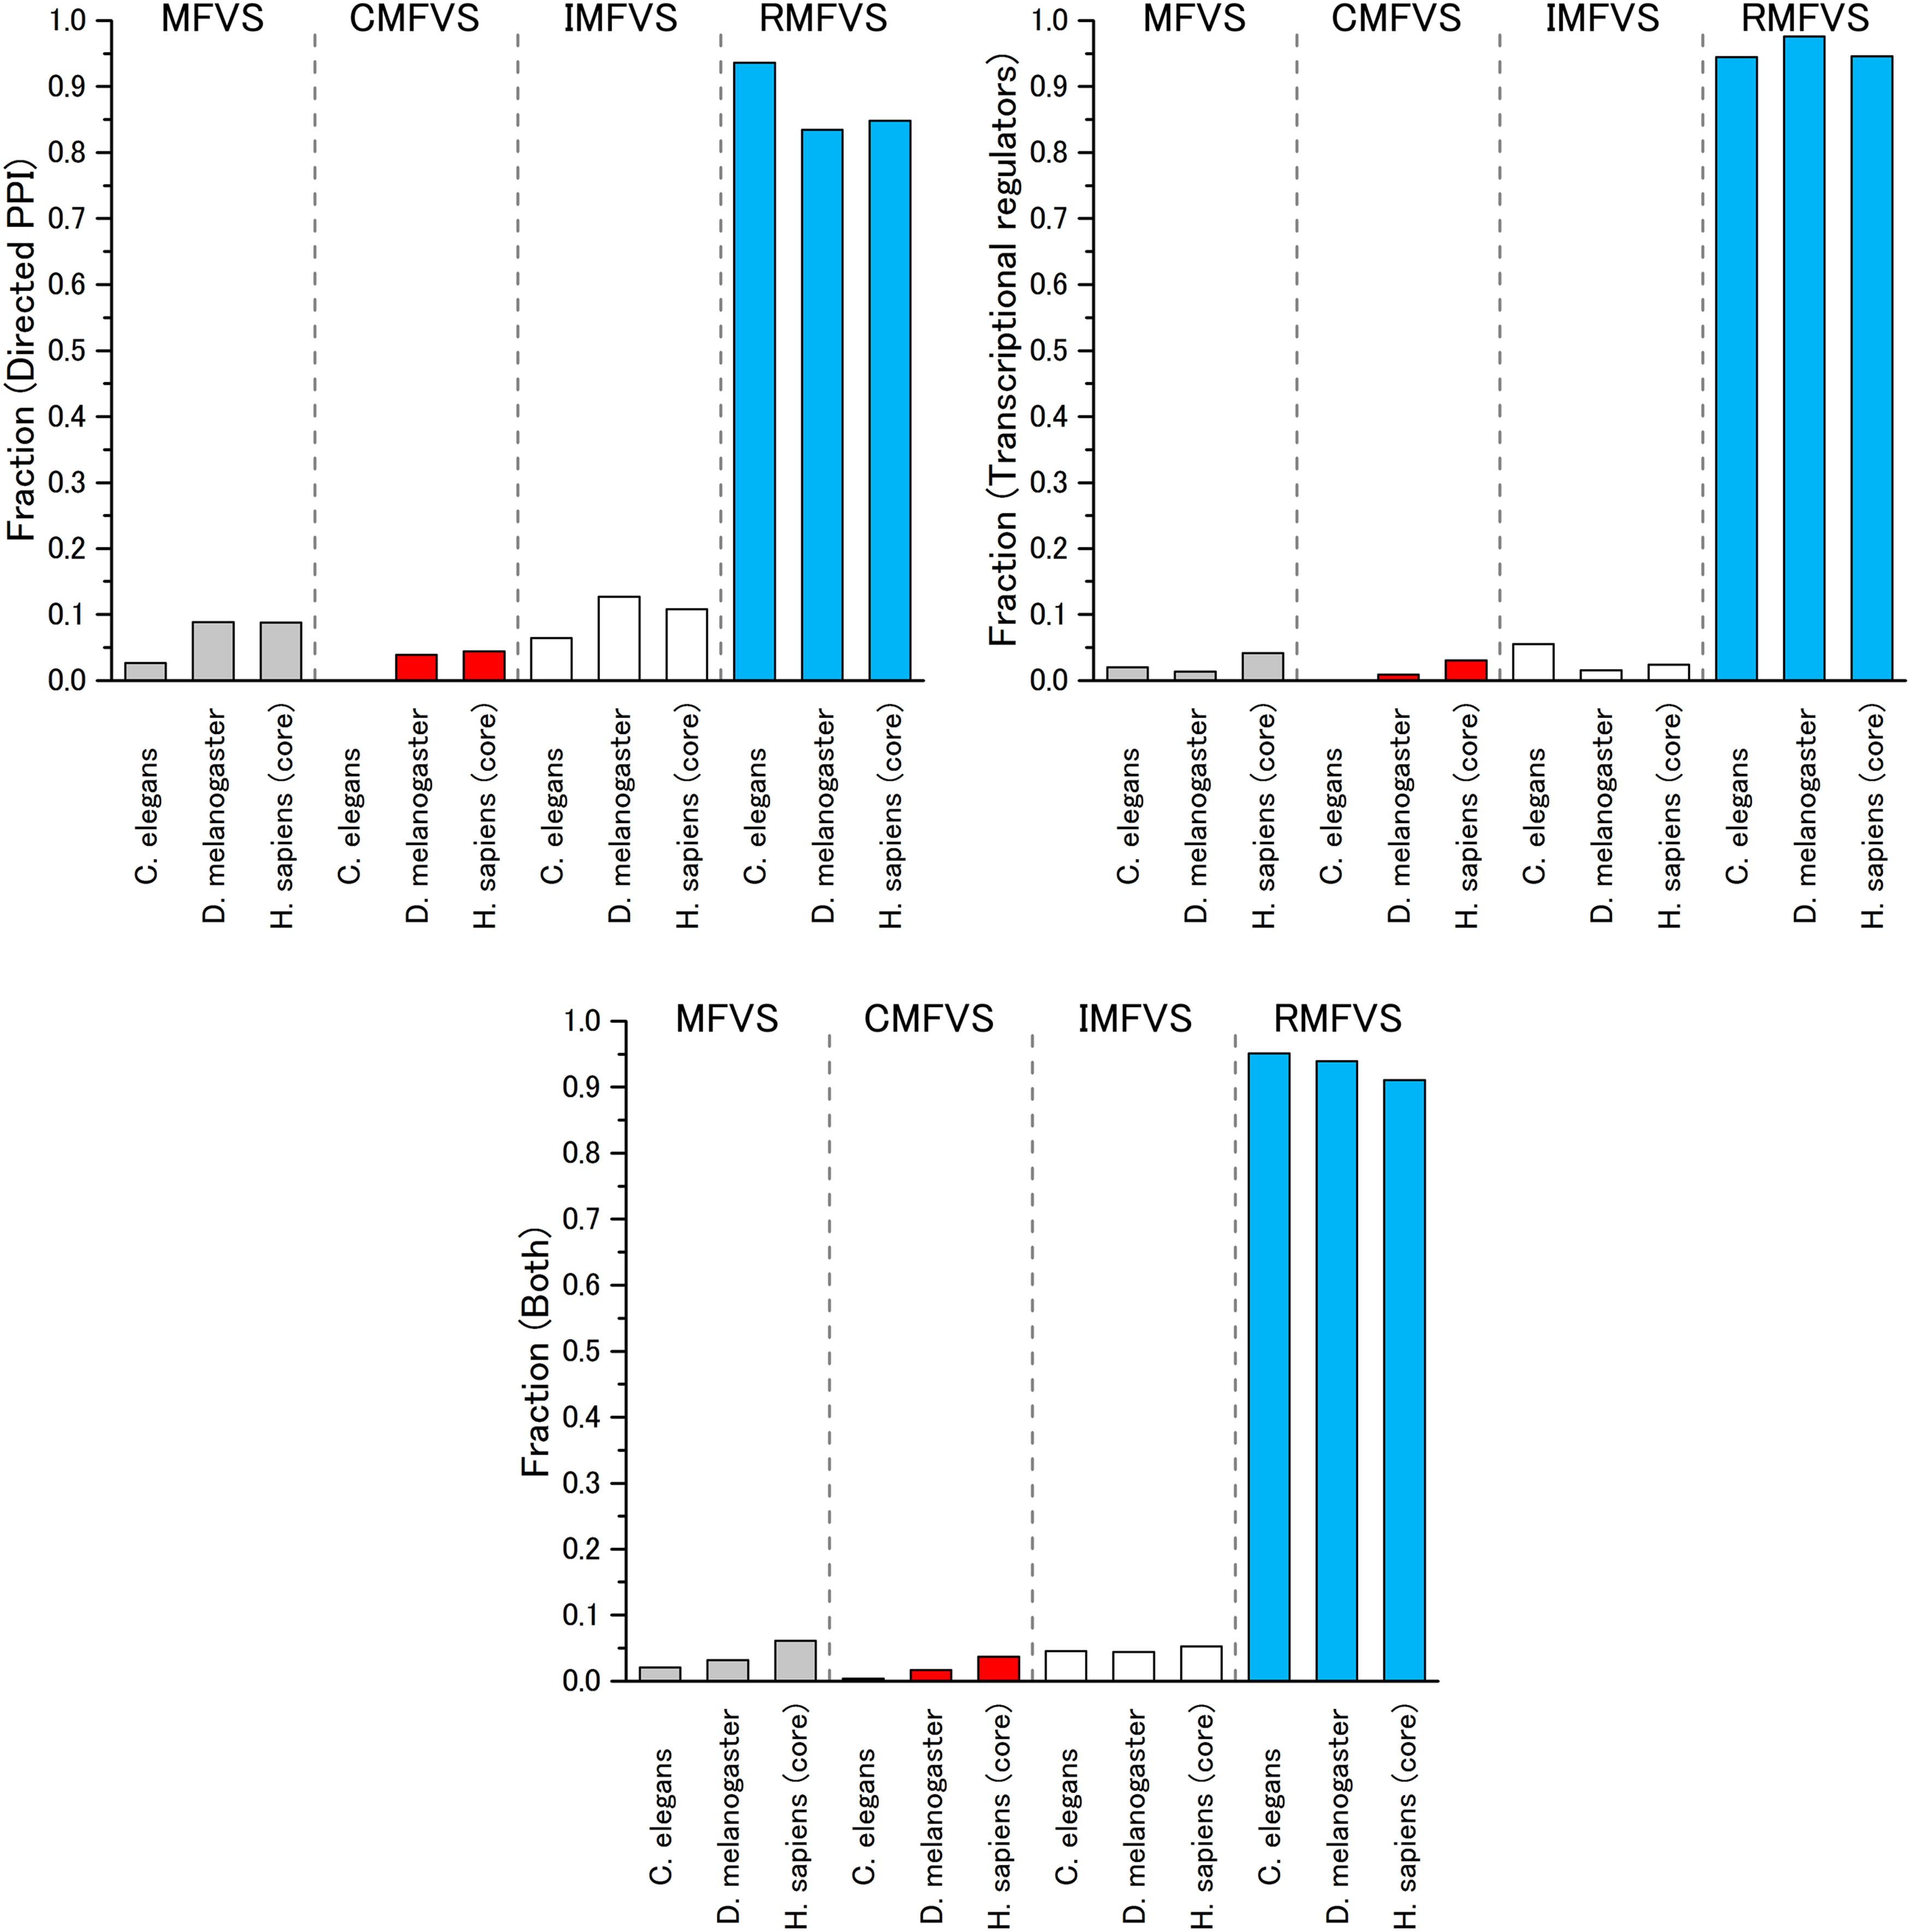
Fraction of nodes in each MFV set control category for each analyzed organism. The results are also classified by each type of network: (left) directed PPI network, (right) transcriptional regulators and (bottom) integrated network. PPI, protein–protein interaction.
Because the signaling network is responsible for continuous developmental processes, it is interesting to investigate the associations between essential genes and those proteins responsible for critical control. The enrichment results of essential genes associated with the CMFV and IMFV sets are given in Table 1. The results indicate that those proteins responsible for critical control tend to be significantly enriched by essential genes in both D. melanogaster and H. sapiens organisms.
Moreover, for each network type and organism, we divided the data sets into seven signaling pathways as follows: RTK (including EGF/MAPK and Insulin/IGF), TGF-β, Wingless/WNT, Hedgehog, JAK/STAT, Notch, and NHR (Nuclear hormone receptor). These pathways play important roles in cell development as well as in reprogramming different cellular responses to extracellular signals. Subsequently, the enrichment of each control category was computed for each pathway. Figure 13 shows that a fraction of the pathways, namely Wingless/WNT, TGF-β, and Hedgehog show a conserved enrichment of critical nodes (CFMVS) for the integrated directed PPI network with transcriptional regulators. Among the major functions shared by these three pathways, we found cell-fate and polarity determination, organ development, cell-fate determination, and proliferation. With the exception of the Notch pathway, the remaining pathways tend to have different major functions: EGF/MAPK involves growth, survival, differentiation, and cell-fate determination. JAK/STAT relates to proliferation, cell development, differentiation, apoptosis, and native and adaptive immune processes. NHR corresponds to development and growth, sex determination, and regulation of cell metabolism. Finally, the Notch pathway is associated with cell-fate determination, proliferation, apoptosis, and organ development.

Enrichment results of each MFV set control category for each signaling pathway. The results are shown for three analyzed organisms: Caenorhabditis elegans, Drosophila melanogaster, and Homo sapiens. The enrichment results are also displayed in three types of networks: directed PPI network, transcriptional regulators, and the integrated network. A functional description of each signaling pathway can be found in the main text.
4. Discussion and Conclusion
In this work, we developed an algorithm that we implemented to identify and evaluate the critical/redundant fraction of vertices in directed complex networks under the MFVS-based approach. The most important feature of our development is introduction of novel graph contraction operations to reduce the size of the original network by identifying many critical and redundant vertices. We also modified an existing ILP-based algorithm to enable us to introduce three categories of vertices under the MFVS-based approach.
The computational analysis we presented showed that, as a graph becomes denser, the fraction of redundant vertices decreases. After evaluating the efficiency of our preprocessing procedure, we found that, in the case of a sparse graph, our preprocessing step significantly affected the performance by reducing the computational time to 1/1000–1/100; however, with a dense graph, the efficiency of our preprocessing step was reduced. Therefore, improvements of our preprocessing procedure are important future work, especially those for dense graphs.
The results of the analysis of the signaling networks showed that the fraction of MFVS vertices is very small for all three of the examined organisms. Furthermore, the results revealed that proteins corresponding to critical vertices tend to be enriched by essential genes in both D. melanogaster and H. sapiens organisms, especially in D. melanogaster. The results also showed that proteins corresponding to intermittent vertices tend to be enriched in these two organisms. A detailed analysis of the specific subpathways indicated that critical vertices are enriched by essential genes in pathways related to cell-fate and polarity determination, organ development, and cell-fate determination and proliferation. This finding suggests that our proposed approach based on the critical/redundant MFVS is useful for finding proteins and genes that have important control roles in directed biological networks.
Footnotes
Acknowledgments
J.C.N., M.H. and T.A. were partially supported by JSPS KAKENHI grant no. JP25530351; grant no. 16K00392; and grant nos. 26420034 and 26540125, respectively. This work was also supported, in part, by research collaboration projects of the Institute for Chemical Research, Kyoto University.
Authors' Contributions
Conceptualization of this article was done by T.A.; data curation was by Y.B., M.I., and J.C.N.; methodology of this study was by Y.B. and T.A.; project administration was carried out by J.C.N. and T.A.; software was by Y.B.; validation was by Y.B., M.I., and J.C.N.; and writing of this article was done by Y.B., M.H., P.L., J.C.N., and T.A.
Author Disclosure Statement
No competing financial interests exist.