
Abstract
Abstract
Cryo-electron microscopy (Cryo-EM) imaging has the unique potential to bridge the gap between cellular and molecular biology by revealing the structures of large macromolecular assemblies and cellular complexes. Therefore, cryo-EM three-dimensional (3D) reconstruction has been rapidly developed in recent several years and applied widely in life science research; however, it suffers from reduced contrast and low signal-to-noise ratios with a high degree of noise under low electron dose conditions, resulting in failures of many conventional filters. In this article, we explored a modified wavelet shrinkage filter (with optimal wavelet parameters: three-level decomposition, level-1 zeroed out, subband-dependent threshold, soft thresholding, and spline-based discrete dyadic wavelet transform) and extended its application in the cryo-EM field in two aspects: single-particle analysis and cryo-electron tomography. Its performance was assessed with simulation data and real cryo-EM experimental data. Compared with the undenoised results and conventional denoising techniques (e.g., Gaussian, median, and bilateral filters), the modified wavelet shrinkage filter maintained the resolution and contrast but reduced the noise, leading to higher quality images and more accurate measures of the biological structure. We expect that our study can provide benefits to cryo-EM applications: 3D reconstruction, visualization, structural analysis, and interpretation. All these data and programs are available.
1. Introduction
C
For single-particle analysis (SPA) in cryo-EM, the ice-embedded specimen consists of many randomly oriented copies of a single-particle type. The 3D reconstruction method processes 2D projections of the particle boxed out from the cryo-EM micrographs, and then estimates the unknown orientations as it estimates the 3D structure (Frank et al., 1996; Fernandez-Leiro and Scheres, 2017). The poor SNR of the micrographs makes it difficult to extract millions of particles and precisely align them to determine their orientations (Vargas et al., 2016).
For cryo-electron tomography (cryo-ET) imaging, the 3D structure of the specimen, is generally resolved by reconstructing tomograms using the tilt series of the specimen's angle-oriented projection images with weighted back-projection (WBP) and simultaneous iterative reconstruction technique (SIRT) algorithms. To minimize the radiation damage and preserve as much resolution as possible, cryo-ET uses very low electron doses fractioned at different angle-oriented projections, usually tilt angles varying from [−70°, 70°], which would result in high noise in these images and the inaccuracies in tilt-series alignment and object reconstruction.
A wavelet transform can exploit the wavelet's natural ability to separate a signal from noise at multiple image scales, and thus has the potential to outperform conventional cryo-EM image denoising methods, such as Gaussian, median, and bilateral filters. In our research, we explored a modified wavelet shrinkage filter, which explicitly outperforms existing methods because of its ability to better preserve detail, while simultaneously suppressing noise on multiple scales. Therefore, we propose to extend its application in the cryo-EM field.
2. Methods
2.1. Modified wavelet shrinkage filter
As we know, a noisy cryo-EM image
where
The modified wavelet shrinkage filter that denoises a cryo-EM image can be described as
where
where i is an index over all the detail coefficients Wj.
Now, we apply soft thresholding for each
2.2. Data assessment
2.2.1. Simulation data assessment
For a global analysis of simulation data, except visual observation, we used a quantitative approach to help understand the resolution dependence of different methods based on several figures of merit; for example, to evaluate the noise reduction degree, we calculated the SNR, the mean-squared error (MSE), a cross-correlation coefficient (CCC), and the Fourier ring/shell correlation (FRC/FSC; van Heel and Schatz, 2005). In this study, the SNR, MSE, and CCC between the denoised data and the noise-free data were calculated with a suitable mask. The FRC/FSC between the denoised data and the noise-free data without the mask was calculated with the program “fsc.spi” in Spider software. All the results obtained by using the modified wavelet shrinkage filters were compared with those obtained using conventional filters (e.g., Gaussian, median, and bilateral).
2.2.2. Real experimental data assessment
Denoised images and reconstruction maps were visually inspected to assess whether the modified wavelet shrinkage filter processing method significantly changed some of the global properties, such as the shape, size, and position of the relevant structures in the images. Moreover, for SPA in cryo-EM, the resolution of the reconstructed 3D structure was assessed with an FSC. The resolution is cutoff at 0.5 in the FSC curve. Moreover, little resolution value means better discerning of two closer objects.
2.3. Simulation data test
2.3.1. 2D single-image test
To validate the robustness of a modified wavelet shrinkage filter for the very noisy cryo-EM 2D micrographs and the 2D projection images of extracted particles, we added Gaussian noise to a 2D image of GroEL molecular chaperones (referenced as the noise-free data) to generate four test data sets with different noise levels, that is, with different SNRs (SNR = 0.1, 0.4, 0.7, and 1.0). Then, we denoised these images with the 2D modified wavelet shrinkage filter.
2.3.2. 2D-projection tilt series test
In this study, the 2D-projection tilt series was generated from a TomoJ 3D phantom (Messaoudil et al., 2007) with tilt angle range [−70°, 70°], angle increment 1°, and a vertical tilt axis. We added Gaussian noise (SNR = 0.1, 0.4, 0.7, and 1.0) to the noise-free tilt series to generate the noisy tilt series. Each angle-oriented projection image underwent 2D wavelet denoising. This process was repeated independently for all projection images in the tilt series. The undenoised and denoised tilt series were reconstructed with WBP and the SIRT algorithm, respectively, using the TomoJ reconstruction software.
2.3.3. 3D volume data test
All reconstructed volumes contain a significant level of noise, which arises in part from the inherent limitations of current electron optics devices, for example, the camera detector, and in part from the computational manipulation of the data. Using a noise-reduced 3D reconstructed volume would lessen the chance of misunderstanding and obtaining an inappropriate biological structure. To identify the 2D/3D wavelet filter's effect on different noise levels, we added different levels of Gaussian noise (SNR = 0.1, 0.4, 0.7, and 1.0) to the noise-free TomoJ 3D phantom to obtain the noisy 3D volume data. The noisy 3D phantom data were denoised separately with the 2D and 3D modified wavelet shrinkage filters. In the 3D case, the entire volume of data underwent 3D denoising at once. In the 2D case, each y-axis-oriented slice underwent 2D denoising; this process was repeated independently for all slices in the volume. The results were visualized using the Chimera molecular-modeling software from the University of California, San Francisco (UCSF; Goddard et al., 2007).
2.4. Real cryo-EM data test
2.4.1. Single-particle data test
For this test, we used experimental electron micrographs of GroEL molecular chaperones to validate the performance of our optimal wavelet filter in single-particle data processing using the EMAN 1.9 single-particle reconstruction software (Ludtke et al., 1999). These data are a subset of the data used for the published 6Å-resolution GroEL structure (Ludtke et al., 2004).
2.4.1.1. Single-particle picking
A critical bottleneck in single-particle data processing is particle picking—the identification of particle images within micrographs. Raw EM micrographs are extremely noisy, which makes it hard to distinguish particles from the background. This not only makes human-interactive particle selection painful, but also has allowed only limited success in automated particle-picking methods (Nicholson and Glaeser, 2001). Thus, we use the 2D modified wavelet shrinkage filter to directly denoise the raw micrographs to assist in particle picking.
2.4.1.2. Single-particle reconstruction
For SPA, one of the most critical structure determination aspects is averaging the particle images to improve the SNR. To average millions of raw particle images, it is necessary to align the particle images with respect to each other so as to eliminate the “in-plane” translational and rotational degrees of freedom among them (Vargas et al., 2016). To validate the robustness of our filter for improving SPA reconstruction resolution, we selected 9196 particles from 12 micrographs to generate the final 3D structure. After applying contrast transfer function correction, these particles were preprocessed with the 2D modified wavelet shrinkage filter denoising each particle in the combined particle data set separately and independently. The resolution was determined using the FSC method and compared with those from the conventional filters.
To ensure we had the best and most reliable results from the original data, we asked Steven Ludtke (the developer of EMAN software) for help with the original data reconstruction to obtain the best results he could. Later on, a 3D electron density map of GroEL was generated using an X-ray structure from the Protein Data Bank (PDB; PDB ID: 3CAU) after using the EMAN “pdb2mrc” program, whose map size was 128 × 128 × 128 voxels, sampled at 1.9 Å/pixel. The availability of both the original 3D reconstruction and the X-ray structure makes our GroEL an appropriate model to validate the reconstruction performance affected by our filter. The 3D density map display, color rendering, and density interpretation were manipulated using UCSF's Chimera package.
2.4.2. Cryo-ET data test
2.4.2.1. Cryo-ET tilt series reconstruction
To verify the performance of the 2D modified wavelet shrinkage filter in cryo-ET reconstruction, a cryo-ET tilt series of Chlamydia trachomatis cells was used, after downloading from the Protein Data Bank in Europe (PDBe; Accession Code: EMPIAR-10047; Nans et al., 2015). This tilt series data set (named as “tilt7.st”) were collected automatically at 3° increments over an angular range of [−52°, 54°]. The total electron doses were about 54 electrons/Å2. Nominal defocus was 10 microns. This single-axis tilt series were collected on a 300-kV Tecnai Polara electron microscope equipped with a K2 Summit direct electron detector and a Quantum energy filter (Gatan). The reconstructed data (named as “tilt7.rec”) are a cryo-ET of host-free Chlamydia trachomatis with type III secretion system (T3SS). With the aid of colloidal 10-nm gold fiducial markers mixed before the specimen preparation, the original tilt series were aligned and reconstructed with the WBP method using IMOD software. Thus, the denoised tilt series were also processed like the original tilt series for comparison.
2.4.2.2. Cryo-tomogram visualization
To verify the performance of the modified wavelet shrinkage filter in cryo-tomogram visualization, the original cryo-tomogram of host-free Chlamydia trachomatis and the cryo-tomograms generated by us were denoised with the 2D and 3D modified wavelet shrinkage filters separately. The results were compared and assessed by visualization.
3. Results
3.1. Results of the simulation data test
3.1.1. Results of the 2D single-image test
Compared with the conventional filters, the 2D modified wavelet shrinkage filter performed well in high noise conditions (Supplementary Figs. S1 and S2). After denoising, the GroEL profile can be seen even in the noisiest image in Supplementary Figure S1 because it is based on a subband-dependent threshold. The threshold depends on the detail of the image rather than the entire image. Thus, in terms of the SNR, MSE, CCC, and visual quality, we clearly validate the robustness of the 2D modified wavelet shrinkage filter for high noise images. Notably, the SNR is calculated from the image with a tight mask, and is bigger than the SNR of the input image. The FRC measurements presented in Table 1 also help verify that the high-resolution information of the images denoised by the 2D modified wavelet shrinkage filter is still preserved.
In this study, the Fourier ring correlation values were calculated with the images shown in Supplementary Figure S1.
3.1.2. Results of the 2D-projection tilt series test
Inspecting Supplementary Figure S3 and comparing the visual results of the 3D reconstruction models using the tilt series denoised with different filters, the 2D modified wavelet shrinkage filter was visually found to be the best compromise between noise suppression and detail preservation. Moreover, in this situation, the WBP result was apparently improved due to noise suppression. The SIRT result appeared mildly improved. The resolutions of FSC measurements presented in Table 2 help quantitatively verify this phenomenon. The results in Supplementary Figure S4 also illustrate clearly that noise reduction visually enhances reconstruction images. In addition, we observe that the SIRT produces better results than WBP. Although the 3D structure may be affected by “missing wedge” of electron tomography and has elongation compared with the noise-free phantom, which does not affect clarifying our filter's contribution to cryo-ET reconstruction.
In this study, the Fourier shell correlation values were calculated with the reconstruction maps shown in Supplementary Figure S3.
SIRT, simultaneous iterative-reconstruction technique; WBP, weighted back projection.
3.1.3. Results of the 3D volume data test
The synthetic noisy volume data sets of the TomoJ phantom, containing four noise-level types (SNR = 0.1, 0.4, 0.7, and 1.0), were denoised using the 2D/3D modified wavelet shrinkage filter (Supplementary Fig. S5). The SNR, MSE, and CCC values were obtained for the denoised images (Supplementary Fig. S6). From Supplementary Figure S5, it is obvious that the image denoised using the 3D wavelet filter is better than the image denoised using the 2D wavelet filter. Furthermore, for the same noise-level image, 3D denoising provides better SNR, MSE, and CCC values. As the noise level increases, the noise is smoothed out more, indicating that the SNR, MSE, and CCC measures inevitably deteriorate, but not severely. This is evident from Supplementary Figure S6. Compared with conventional filters, the 2D/3D modified wavelet shrinkage filter shows a slightly stronger noise suppression ability comparing the high noise level with the low noise level, as well as good detail preservation. It is evident that applying the modified wavelet shrinkage filter can recover more of the intrinsic image structure embedded in the noise, and the 3D filter's ability is better. Moreover, besides suppressing high noise, the modified wavelet shrinkage filter can improve the quantitative resolution, especially for the 3D case (Table 3).
In this study, the Fourier shell correlation values were calculated with the volumes shown in Supplementary Figure S5.
2D, two-dimensional; 3D, three-dimensional.
3.2. Results of the real cryo-EM data test
3.2.1. Results of the single-particle data test
3.2.1.1. Single-particle picking
Figure 1a shows the image cutting from a micrograph at 2.13 μm under focus. In the original unfiltered image, the GroEL particles are barely visible in the high noise background. By applying the 2D modified wavelet shrinkage filter, we show that the noise in the raw image is significantly reduced, whereas the contrast between the particle and the background is significantly enhanced (Fig. 1b). The GroEL particles are much more readily recognizable. Furthermore, the noise smoothing achieved is not at the expense of blurring the particle image details. The detailed features of the GroEL particle, for example, the striations in the side views and the empty ring in the top view, are still maintained. Thus, the 2D modified wavelet shrinkage filter can offer manual and automatic particle picking with faster, accurate, and less subjective picks.

Testing the 2D modified wavelet shrinkage filter's performance on single-particle picking.
3.2.1.2. Single-particle reconstruction
The original structure from the undenoised single-particle stack image is the best reconstruction Steven Ludtke could perform with a reasonable amount of effort using the provided GroEL sample data set. The structure is evaluated to be approximately a 9.1 Å resolution (Fig. 2a). After preprocessing the single-particle stack image with the 2D modified wavelet shrinkage filter, the resolution improved from 9.1 Å to 7 Å. The experimental results show that the reconstructed GroEL structure was almost unaffected by the proposed wavelet denoising method; however, considerable noise was removed and the image quality was improved (Fig. 2b). The X-ray structure was basically perfect out to near-atomic resolution. We applied the X-ray map to the final filtration of the cryo-EM reconstruction at 7 Å (Fig. 2c). The results illustrate that the GroEL is a double-ring complex of two heptameric rings stacked back-to-back, practically exhibiting seven-fold (D7) symmetry. Although the denoised result deviates slightly from the D7 symmetry in the known X-ray structure, it is negligible, as generating the X-ray map ignores the azimuthal smearing present in the cryo-EM reconstruction. A visual inspection clearly reveals that using the 2D modified wavelet shrinkage filter in the preprocessing step can produce reliable 3D reconstructions versus that directly from extremely noisy experimental data sets.
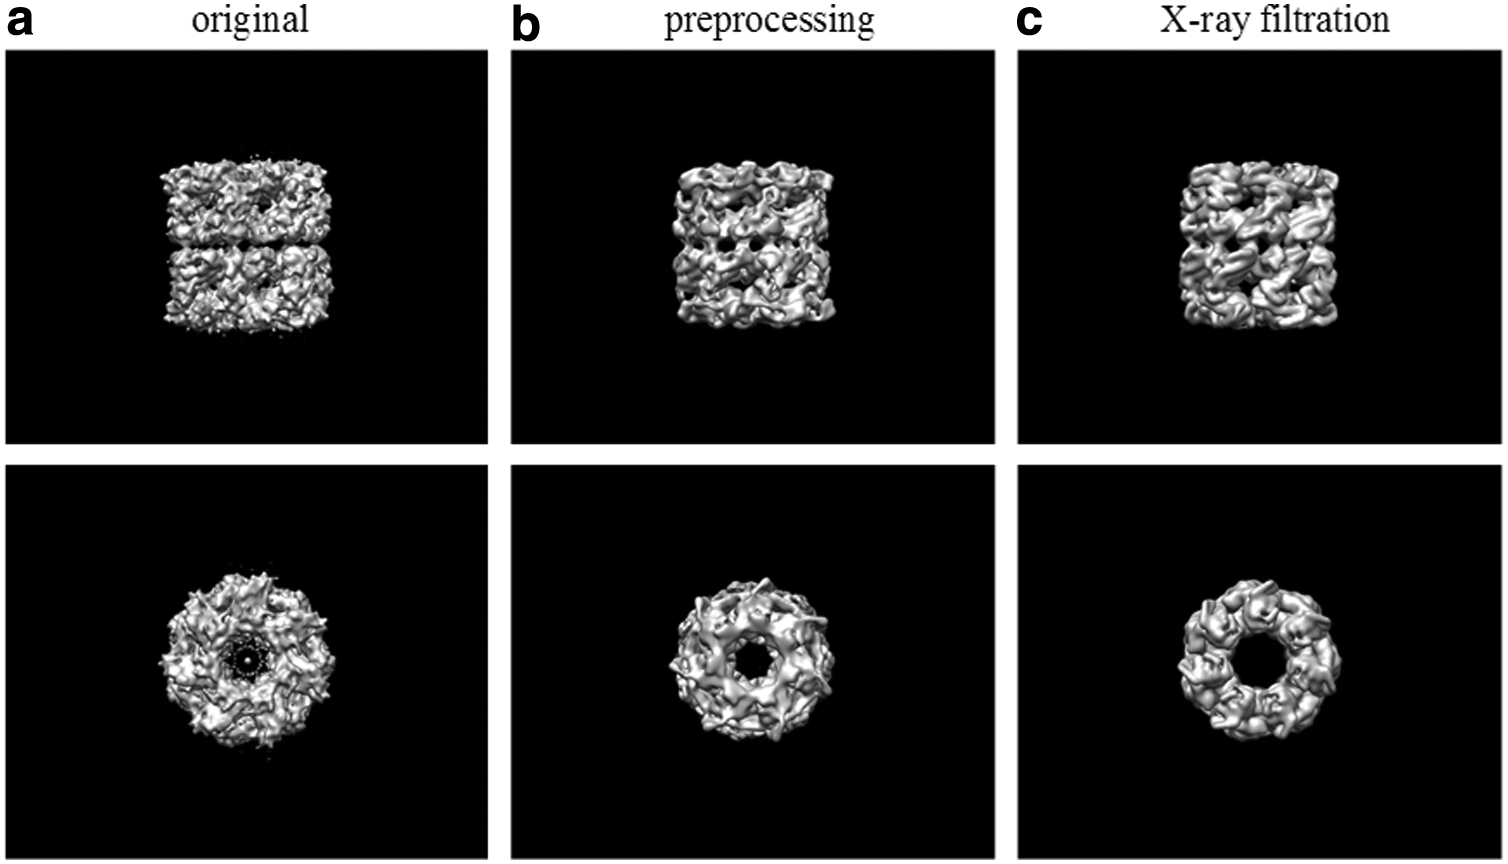
Testing the 2D modified wavelet shrinkage filter's performance on single-particle reconstruction.
The FSC curves of the experiment data results obtained by preprocessing the 2D particle data sets with different filters are presented in Supplementary Figure S7. Comparing the results obtained from the conventional filters with that from undenoised data, we found that the resolution was possibly improved; however, the actual detail of GroEL was destroyed compared with the result obtained from X-ray structure filtered at that resolution.
3.2.2. Results of the cryo-ET data test
3.2.2.1. Cryo-ET tilt series reconstruction
After using the 2D modified wavelet shrinkage filter to preprocess the tilt series of Chlamydia trachomatis cells and evaluate the reconstruction results, the proposed method outperformed the undenoised methods in terms of visual quality. Our reconstruction results show that considerable noise was removed and the cryo-ET image quality was improved (Fig. 3b). The detection, clustering, and spatial distribution of the host-free Chlamydia T3SS, outer and inner membranes, and peptidoglycan layer are obvious. The 2D modified wavelet shrinkage filter significantly improved the SNR and image contrast, while retaining the same overall spatial architectural information as that in the original cryo-tomogram (Fig. 3a).
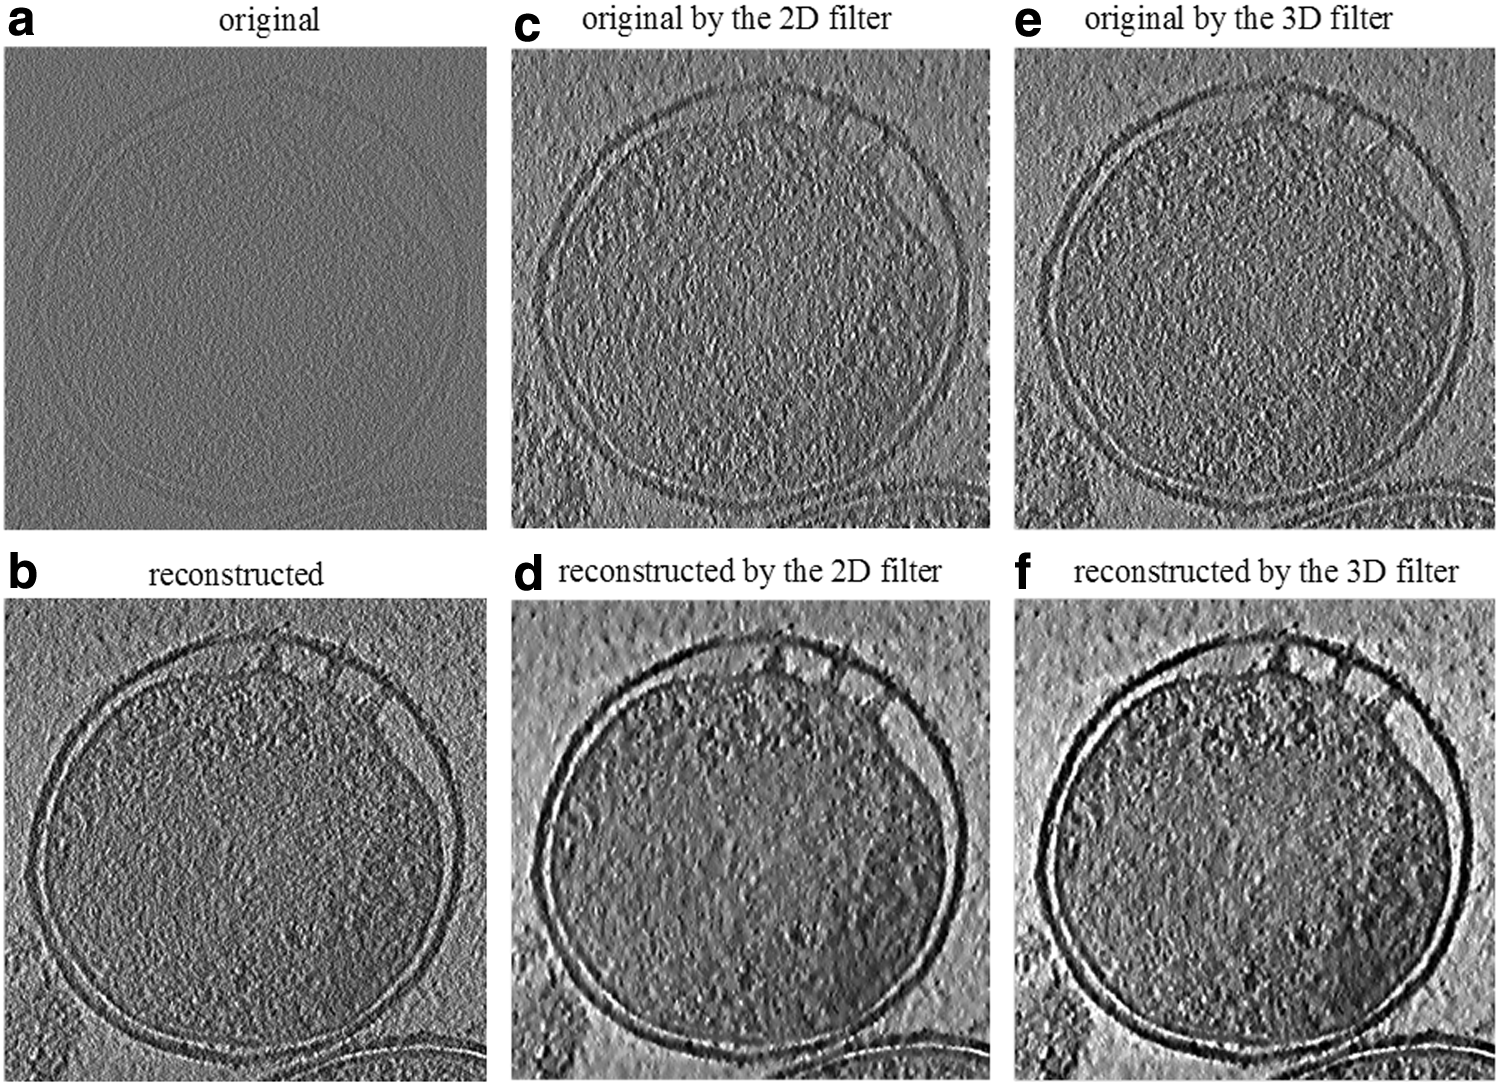
Testing the modified wavelet shrinkage filter's performance on cryo-electron tomography reconstruction and cryo-tomogram visualization.
3.2.2.2. Cryo-tomogram visualization
In Figure 3, the original raw tomogram shows significant levels of residual noise, obscuring the detail (Fig. 3a). However, for the denoised tomogram, the noise is significantly reduced and the Chlamydia T3SS is much more clearly visible (Fig. 3c–f). In addition, the 3D filter returned individual components in the cell that were more highly obvious with reduced noise, unlike the raw version, which was difficult to interpret clearly. This phenomenon was especially observed when using the 3D filter postprocessing the tomogram reconstructed from the tilt series preprocessed with the 2D filter (Fig. 3f).
4. Conclusions
According to the presented objective performance analysis and visual assessment, the modified wavelet shrinkage filter offered a remarkable image-quality improvement with a good compromise between detail preservation and noise smoothing. We expect that our study can benefit cryo-EM applications and biological structure interpretations.
All the data, results, and programs (coded in MATLAB R2014a) mentioned above can be downloaded from our FTP (ftb://mpe.bjmu.edu.cn/).
Footnotes
Acknowledgments
Financial support for this research is provided by the National Natural Science Foundation of China (Grant No. 61671026), the Natural Science Foundation of Beijing, China (Grant No. 7162112), and the Fund for Fostering Young Scholars of Peking University Health Science Center (Grant No. BMU2017PY003). This work has benefited from discussions with Changcheng Yin (Department of Biophysics, Peking University Health Science Center, Beijing, China). The authors wish to thank Steve Ludtke (National Center for Macromolecular Imaging, Baylor College of Medicine) for the GroEL original data and sharing his results.
Author Disclosure Statement
No competing financial interests exist.
References
Supplementary Material
Please find the following supplemental material available below.
For Open Access articles published under a Creative Commons License, all supplemental material carries the same license as the article it is associated with.
For non-Open Access articles published, all supplemental material carries a non-exclusive license, and permission requests for re-use of supplemental material or any part of supplemental material shall be sent directly to the copyright owner as specified in the copyright notice associated with the article.