
Abstract
Abstract
We designed and implemented simulation models of bacterial growth and antibiotic resistance to determine the appropriate antibiotics to use against antibiotic-resistant bacteria. Simulation models were designed using individual-based modeling, and a simulation tool, ARSim, was developed to conduct experiments using the models. Simulations of bacterial growth were conducted by virtually growing Klebsiella pneumoniae bacteria in a virtual environment with predefined parameters. Other experiments included predicting the effects of antibiotics when added to two different groups, one group of nonresistant bacteria and another group of both resistant and nonresistant bacteria. Carbapenem class antibiotics such as Imipenem were used for the simulation. The simulation results showed that the biological principles of bacteria and their antibiotic resistance mechanisms were correctly designed and implemented. Using the computational approaches developed in this study, we hope to provide researchers with a more effective method for finding new ways to fight antibiotic resistance.
1. Introduction
A
The modeling methods are classified into two types according to the simulation flow. One is the top-down modeling approach in which global rules affect all agents in the model, and the properties of individual cells within the bacterial population are completely excluded. This model is also referred to the “population model,” and using a logistic growth model is the most popular technique for implementing this model. A variable called “carrying capacity” is set to the maximum number of cells that the logistic growth model can hold in its environment. Once the variable is set, tracking the changes of bacterial growth in real time and comparing the results with the numbers derived from laboratory experiments become possible (Grimm, 1999). The top-down approach to simulations is relatively simple with short computation times, but is insufficient for real-world applications such as modeling the dynamic interactions between bacteria and antibiotics. To explain the actions not only between bacteria and antibiotics but also between individual bacterial cells or enzymes, a more complex model is needed. The bottom-up approach has strengths in that simulations similar to real-world settings can be performed by modeling individual properties and interactions of bacteria.
Individual-based modeling (IBM), also known as agent-based modeling, is typically used for bottom-up modeling methods (Gorochowski et al., 2012). These types of approaches can also be referred to as “rule-based approaches” since rules reflecting the mechanisms are set for all entities (Vlachosa et al., 2006; Michel et al., 2009). In IBM, parameters are set for each agent in the model, and heterogeneous factors of agents are all applied to the simulation (Macal and North, 2006). In this study, we selected IBM as the appropriate method for our simulation model, since each bacterium in the model must retain various properties such as antibiotic resistance, cell size, and so on. We assumed carbapenem-resistant Enterobacteriaceae (CRE) to be the bacterial agents in our simulation study. CRE are Gram-negative bacteria that inhabit the human intestines and exhibit broad resistance to carbapenems. The global spread of CRE has been one of the most troublesome causes of antibiotic-associated infections since 2000 (Nordmann et al., 2011). In recent years, CRE strains with NDM-1-encoding genes were isolated from Europe, the Americas, Africa, and Asia (Poirel et al., 2011; Nordmann et al., 2012; Molton et al., 2013). In Asia, resistance genes such as NDM-1, KPC-1, KPC-3, VIM-1, and so on were isolated from medical institutions in India, China, and South Korea (Jeana and Hsueh, 2011).
This study aimed to design simulation models of bacterial growth and resistance to antibiotics using IBM and to implement a framework for monitoring and predicting the results of antibiotic resistance. Furthermore, we compared the results with traditional laboratory experiments under the same minimum inhibitory concentration (MIC) values and predicted the effects of antibiotics when added to a bacterial population with or without antibiotic resistance.
2. Methods
2.1. Population dynamics
Quantifying the bacterial population is an extremely important process in bacterial growth simulation. In our study, we used population dynamics to predict the number of bacteria in the simulation model. Exponential growth and logistic growth models are generally used to explain population changes in a group from a macro perspective, and the greatest advantage of top-down models is the simplicity of describing all entities in a population as one large entity. Despite the strength of its conciseness, it is unsuitable in our study because measuring the death of bacterial cells after the addition of antibiotics, which is the most important feature in our study, is not perfectly describable. In addition, top-down models are unable to account for the individual aspects of the bacterial population, explain biological interactions within the population, or explain interactions between bacteria and antibiotics at a molecular level.
2.2. Individual-based modeling
In the IBM method, individual entities are modeled, and these entities' activities are tracked to observe how they act on the whole population (Bonabeau, 2002; Crooks and Heppenstall, 2012). In contrast, most models using population dynamics are unable to track individual entities and instead average the value among entities within the population (Study Group on Modeling of Physical/Biological Interactions [SGPBI], 2002).
The first component of IBM, which primarily consists of two components, is a set of variables that is further grouped into inner variables and outer variables. Inner variables represent the inner states of entities; in this study, flags represent dead or alive, antibiotic resistance, generation time, etc. Outer variables represent the environmental states with which the entities are affiliated and affect all entities within the population. In this study, variables such as nutrient concentration, pH or acidity, temperature, and diameter were included in the outer variables. The second component is the set of functions that define the actions of all entities, whether they interact with each other or the environment. Some of the limitations of population dynamics models can be resolved using IBM. By including variables of survival state for each bacterium, it is possible to switch the status from alive to dead when the bacterium cannot grow and divide due to environmental conditions such as insufficient nutrients or spatial limitations. If any bacterium does not meet the expected conditions, the survival flag changes to “unable to grow” or “dead” in extreme circumstances. Counting the states of all bacteria in the population gives us insights into what happens inside the population. However, IBM lacks standardized models like those of top-down approaches and focuses on individual actions rather than the population as a whole. As the number of entities increases, accumulation can be a major risk in a simulation as the computational processes become heavier.
In our study, we designed models of bacteria, antibiotics, and enzymes using IBM and, finally, devised an environment model that included all entities with specific conditions determined to be suitable for bacterial growth. We included bacterial growth at the molecular level, the spread of enzymes, bacteria–antibiotic interactions, and other biological mechanisms to monitor and predict the consequences of adding antibiotics under various conditions.
2.3. Modeling antibiotic resistance
The aim of this study was to simulate the growth and resistance of CRE. First, basic information on carbapenemase-encoding genes, including gene names and sequences, was retrieved from the National Center for Biotechnology Information (NCBI) website for database construction. Second, we defined the rules for gene transfers, assuming that the mechanism of horizontal gene transfer was bacterial conjugation (Gregory et al., 2008). Three gene transfer mechanisms were implemented, including one vertical and two horizontal mechanisms. According to previous studies, recipient bacteria cannot acquire genes by conjugation when the cell size is 60%–70% of the full-grown size. Approximately 75% of horizontal gene transfers by conjugation occurred when cell sizes exceeded 80% of the size of a full-grown normal cell (Seoane et al., 2011). Consequently, our first rule enabled conditional gene transfers through plasmids when the recipient cell exceeded 80% of its original full-grown size. We also set a parameter controlling the frequency of gene transfer occurrences between bacteria. This parameter was called the transfer frequency or conjugation rate, which defines the successful transfer rate of genes acquired through plasmids. Based on an experiment conducted with carbapenem-resistant Klebsiella pneumoniae strains possessing NDM-1 genes, we set the transfer frequency to (1.3 ± 0.5) × 10–4 for the simulation in this study (Potron et al., 2011).
To quantify and calculate the rate at which carbapenemase hydrolyzes carbapenem molecules, we used the Michaelis–Menten kinetics equation. We set the reaction rate (mM/s) of enzymes and substrates, as well as the turnover rate, which indicates the amount of substrate molecules transformed into products. In this study, we calculated V0 based on the Michaelis–Menten kinetics equation and applied it to the simulation model. The kcat and Km values were set based on previous experiments on K. pneumoniae and Escherichia coli that produce carbapenem-resistant NDM-1 (Kim et al., 2011; Shen et al., 2013).
2.4. Modeling molecular movements
As bacteria pass through the binary fission process, computational cost becomes a very important issue. Efficient algorithms for cell movements are required as newly divided bacterial cells grow and occupy space. In our simulation tool, we implemented a quadtree data structure similar to various tree data structures such as B− trees, B+ trees, and octrees (Meagher, 1982; Samet et al., 1984).
Bacteria were designed to divide into adjacent areas with the highest nutrient concentrations instead of in any random direction. Bacteria could divide into eight directions, and in rare cases, bacteria were allowed to divide into random directions when two or more directions had the exact same nutrient values. We also considered this as a collision between cells and applied actions to all bacteria involved, so that when bacteria shared the same space, they pushed each other out by a quantity proportional to their molecular mass. In the case of nutrient molecules, as nutrient uptake gradually increased in certain areas of the virtual plate, the concentration of nutrients decreased, resulting in concentration differences inside the plate. For the diffusion of nutrients and antibiotics, we implemented a diffusion mechanism using the discretized version of Fick's first law of diffusion (Ginovart et al., 2002).
2.5. Implementation of the simulation tool
A simulation tool was developed to run simulations of the designed models of bacteria, antibiotics, enzymes, and their interactions. The first step was to design IBM-based simulation models. We designed four models that constitute the processes of antibiotic resistance, bacteria–antibiotic interactions, enzymes, and the environment. All functions and variables of these objects were implemented through an object-oriented approach. We developed the program ARSim and conducted various simulation model experiments using our program (Fig. 1).
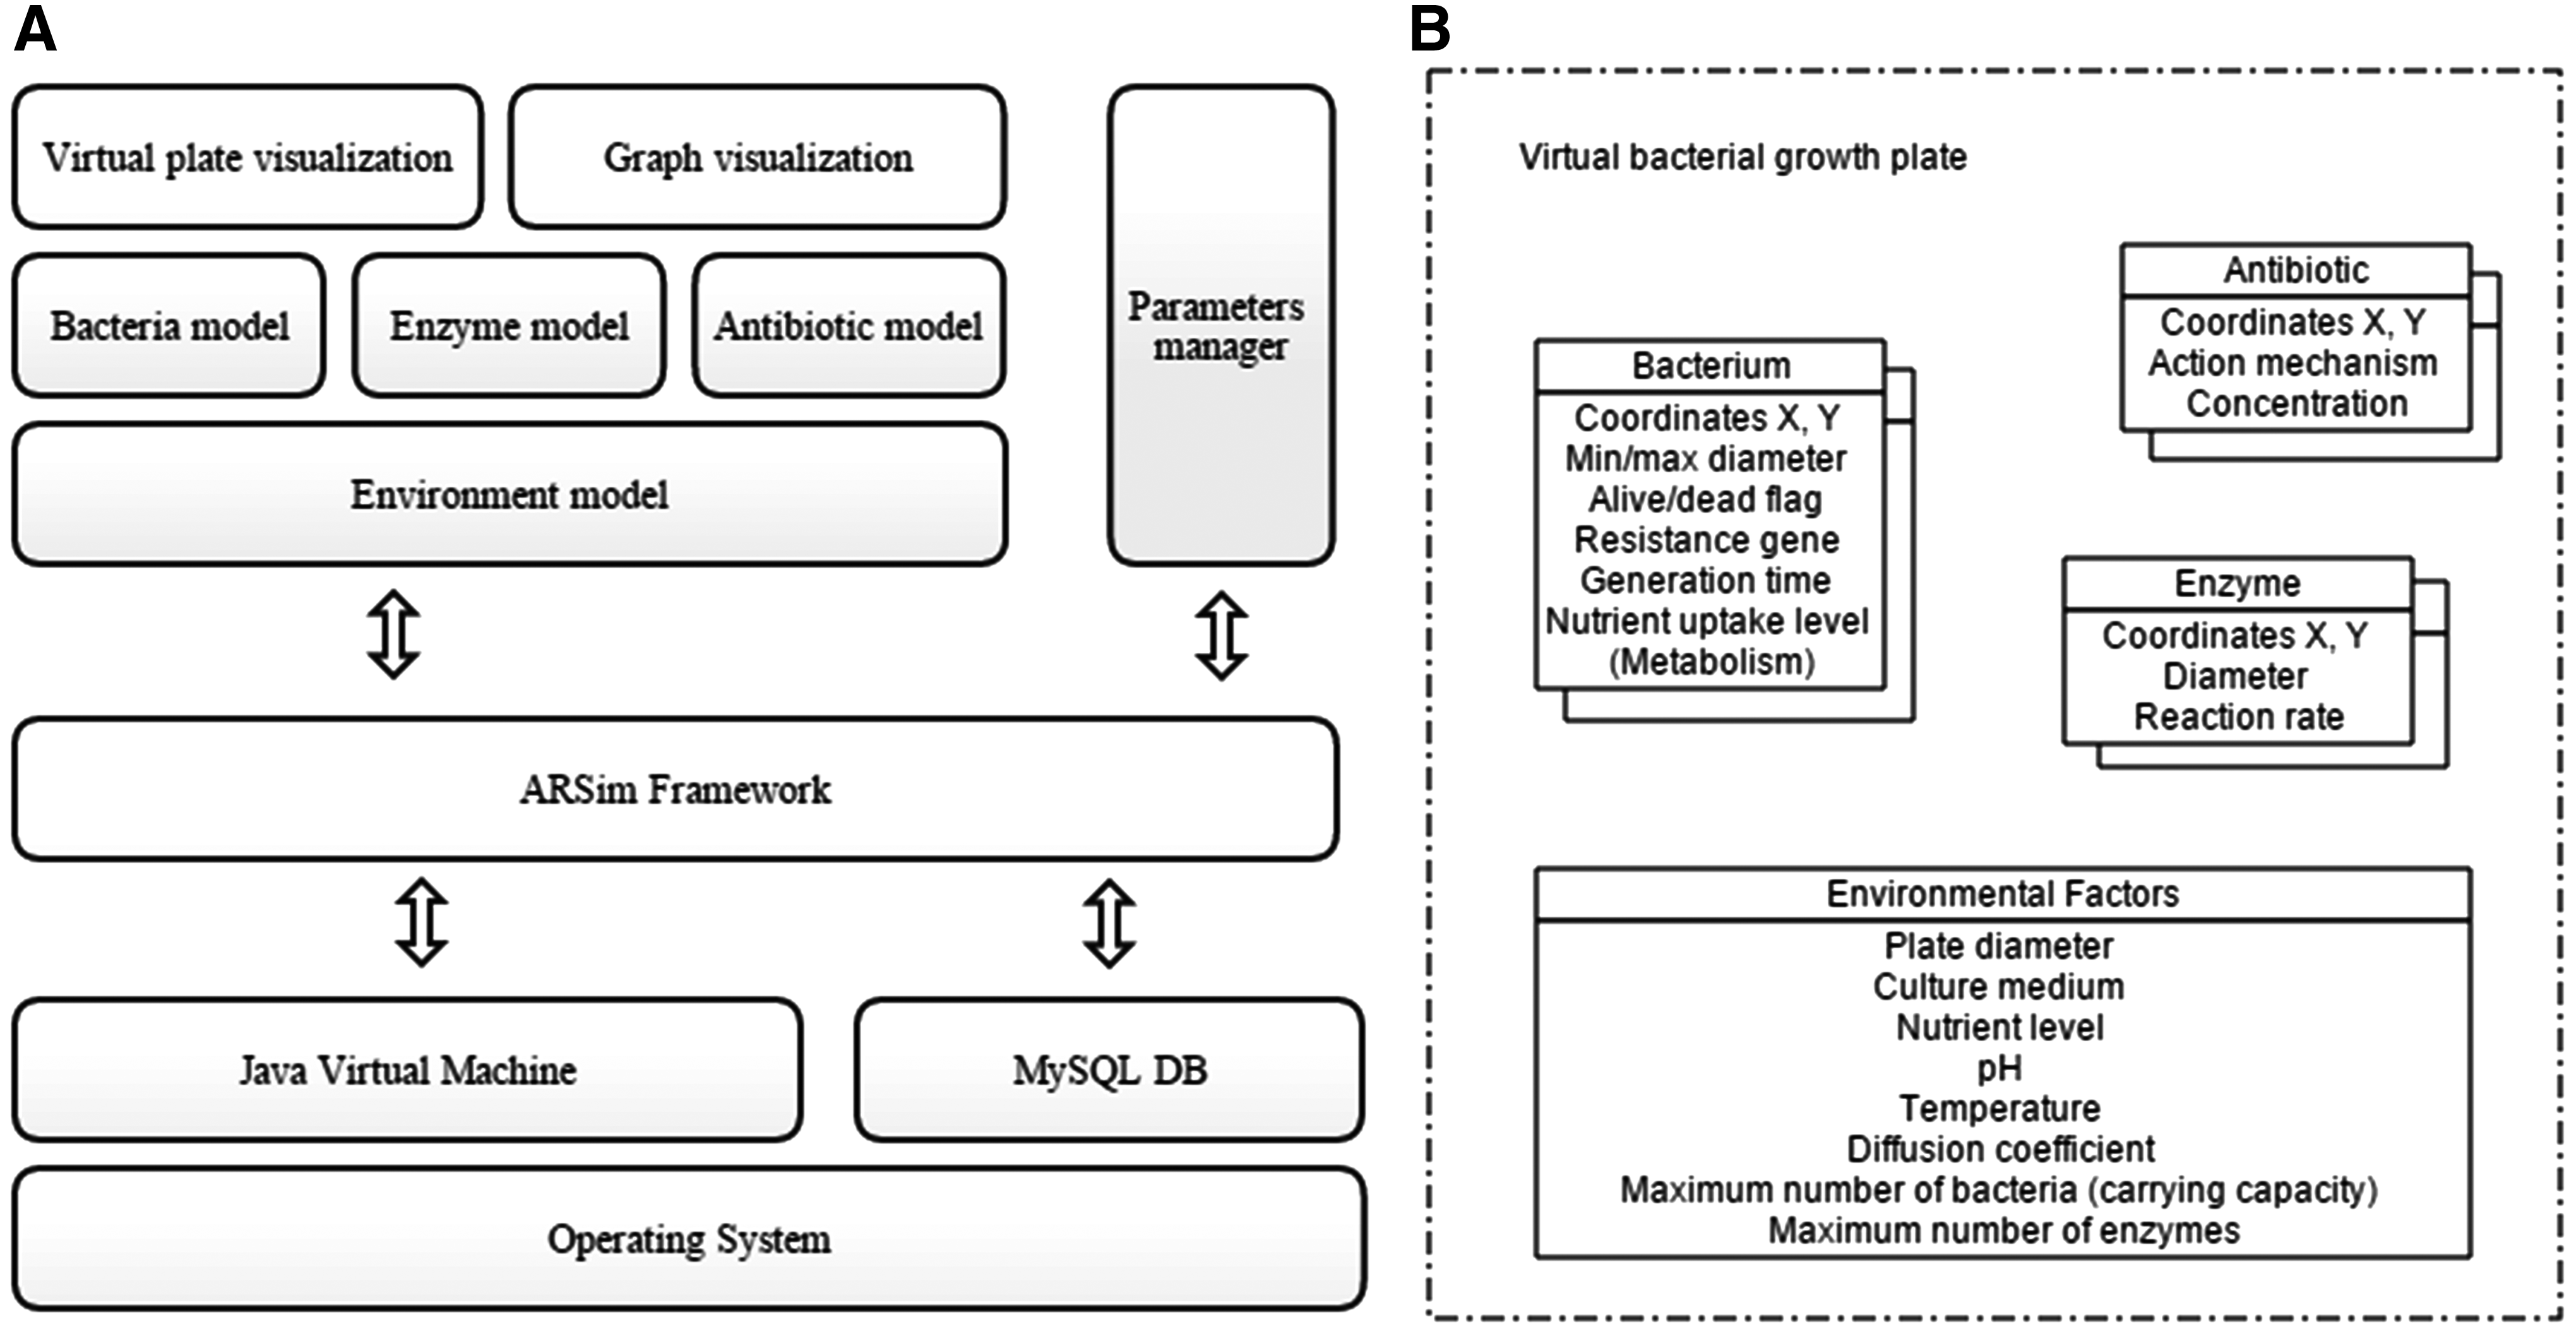
A stack diagram of the ARSim simulation tool and a diagram of models designed.
3. Results
Simulations were classified into two experimental groups in this study. The first set of simulations was the implementation and observation of bacterial growth; the second set was the prediction of consequences of antibiotic addition to multiple bacterial groups.
3.1. Simulation of bacterial growth
The bacterial growth simulation results showed that changes in the bacterial population were similar to the four phases of the typical bacterial growth curve. The bacterial population entered a deep exponential curve for 6 hours after adapting to the environment for ∼3 hours. Following was the stationary phase in which the number of dead and newly divided cells met equilibrium, then the population finally entered the death phase as the number of cells gradually decreased. The entire process continued for 18 virtual hours in the simulation and ∼3 minutes in real-world time.
3.2. Simulation of antibiotic–bacteria interactions
For the second part of the simulation, we conducted a set of experiments for bacteria–antibiotic interactions. We ran simulations for two bacterial groups as follows: one group was absolutely susceptible to antibiotics; the other group was mixed with both antibiotic-resistant and nonresistant bacteria.
We added antibiotics to growing bacteria without antibiotic resistance and predicted the simulation consequences. In this simulation, the carbapenem class Imipenem was used as the antibiotic, and the concentrations were 0.05 and 0.1 μg/mL. In a previous study, experimental results of K. pneumoniae without resistance to carbapenems showed an MIC of 0.094 μg/mL against Imipenem (Yong et al., 2009); we referred to this study for the designation of concentrations. We assumed that bacteria would be not susceptible to antibiotics at a concentration of 0.05 μg/mL and that most bacteria would be killed at a concentration of 0.1 μg/mL, which exceeds the MIC of 0.094 μg/mL.
After ∼7.5 hours of bacterial growth, we added the two different concentrations of antibiotics. Antibiotics were added to the same bacterial group (susceptible or mixed) at the same time at concentrations of 0.05 and 0.10 μg/mL, respectively. Most bacteria survived when the concentration was 0.05 μg/mL, whereas most bacteria were predicted to be exterminated within 20 minutes when the concentration was 0.1 μg/mL.
3.3. Simulation of antibiotic resistance
We conducted simulations to predict the consequences of adding two types of antibiotics when antibiotic-resistant bacteria were present. In the first experiment, antibiotics were added individually to a mixed population of carbapenem-resistant K. pneumoniae with an NDM-1 gene at a given time and bacteria without any resistance. We added antibiotics after 4 hours of simulation. As a result, bacteria without any resistance died out in ∼10 minutes, lowering the competition level for nutrients and space among bacteria, which allowed resistant bacteria to grow and spread dramatically as expected (Fig. 2).

Bacterial growth simulation by ARSim.
The second experiment was to conduct a simulation to observe the mechanism of action of antibiotic resistance. The addition of antibiotics to the bacterial population sets up a resistance mechanism to produce an enzyme called carbapenemase that hydrolyzes antibiotic molecules. Horizontal gene transfer was observed over time as the distribution of antibiotic-resistance genes increased during bacterial growth. We also observed vertical transfer of resistance genes to daughter cells in cases of binary fission. If the concentration of antibiotics was higher than the threshold, enzymes that degrade antibiotic molecules were produced after a certain time when antibiotics were added.
For the third part of the simulation, antibiotics were added to a bacterial population consisting of a mixture of both antibiotic-resistant and nonresistant bacteria to predict changes in the population and determine the effectiveness of antibiotics on certain bacteria. Carbapenem class antibiotics were used against CRE bacteria as done in previous experiments. One simulation was the untreated control, which is the same as the bacterial growth simulation without adding any antibiotics in the first experiment. The next simulations consisted of three experiments with Imipenem and other three with Meropenem. Imipenem and Meropenem were used in each test to observe the differences in antibiotics used in accordance with their parameters. Four parameters, the Michaelis constant (Km), the catalytic conversion efficiency or turnover rate (kcat) from Michaelis–Menten kinetics, the molecular mass, and half-life, represented the properties of the antibiotics. The Michaelis constant and turnover rate were set to 127 μM and 10.8 s–1 for Imipenem and 68 μM and 4.0 s–1 for Meropenem, respectively. The molecular masses of the antibiotics were set to 299 and 383 Da (g/mol) for Imipenem and Meropenem, respectively, to calculate the concentration in the Michaelis–Menten kinetics equation. Parameters for the simulations are listed in Table 1.
A simulation tool was developed to simulate designed models of bacteria, enzymes, antibiotics, and their interactions. We designed four models that constitute the processes of resistance to antibiotics, bacteria–antibiotic interactions, enzymes, and the environment. All functions and variables were implemented through an object-oriented approach.
MIC, minimum inhibitory concentration.
Simulations using Imipenem showed instant population decreases at three different antibiotic concentrations (Fig. 3), and the degree of decrease was the least at 16 μg/mL and the most at 64 μg/mL. However, when 16 μg/mL of Imipenem was added, a rebound in growth was observed after ∼2 hours. This also occurred when Imipenem was added at 32 μg/mL, which is reported as the MIC of Imipenem against NDM-1-producing K. pneumoniae. Therefore, the rebound time was predicted to be longer than the simulation at 16 μg/mL. We observed that the bacterial population was inhibited from growing as it was almost eliminated when 64 μg/mL of Imipenem was added, which is twice the MIC for K. pneumoniae. After 6 hours of simulation, the population of the untreated control began to decrease.
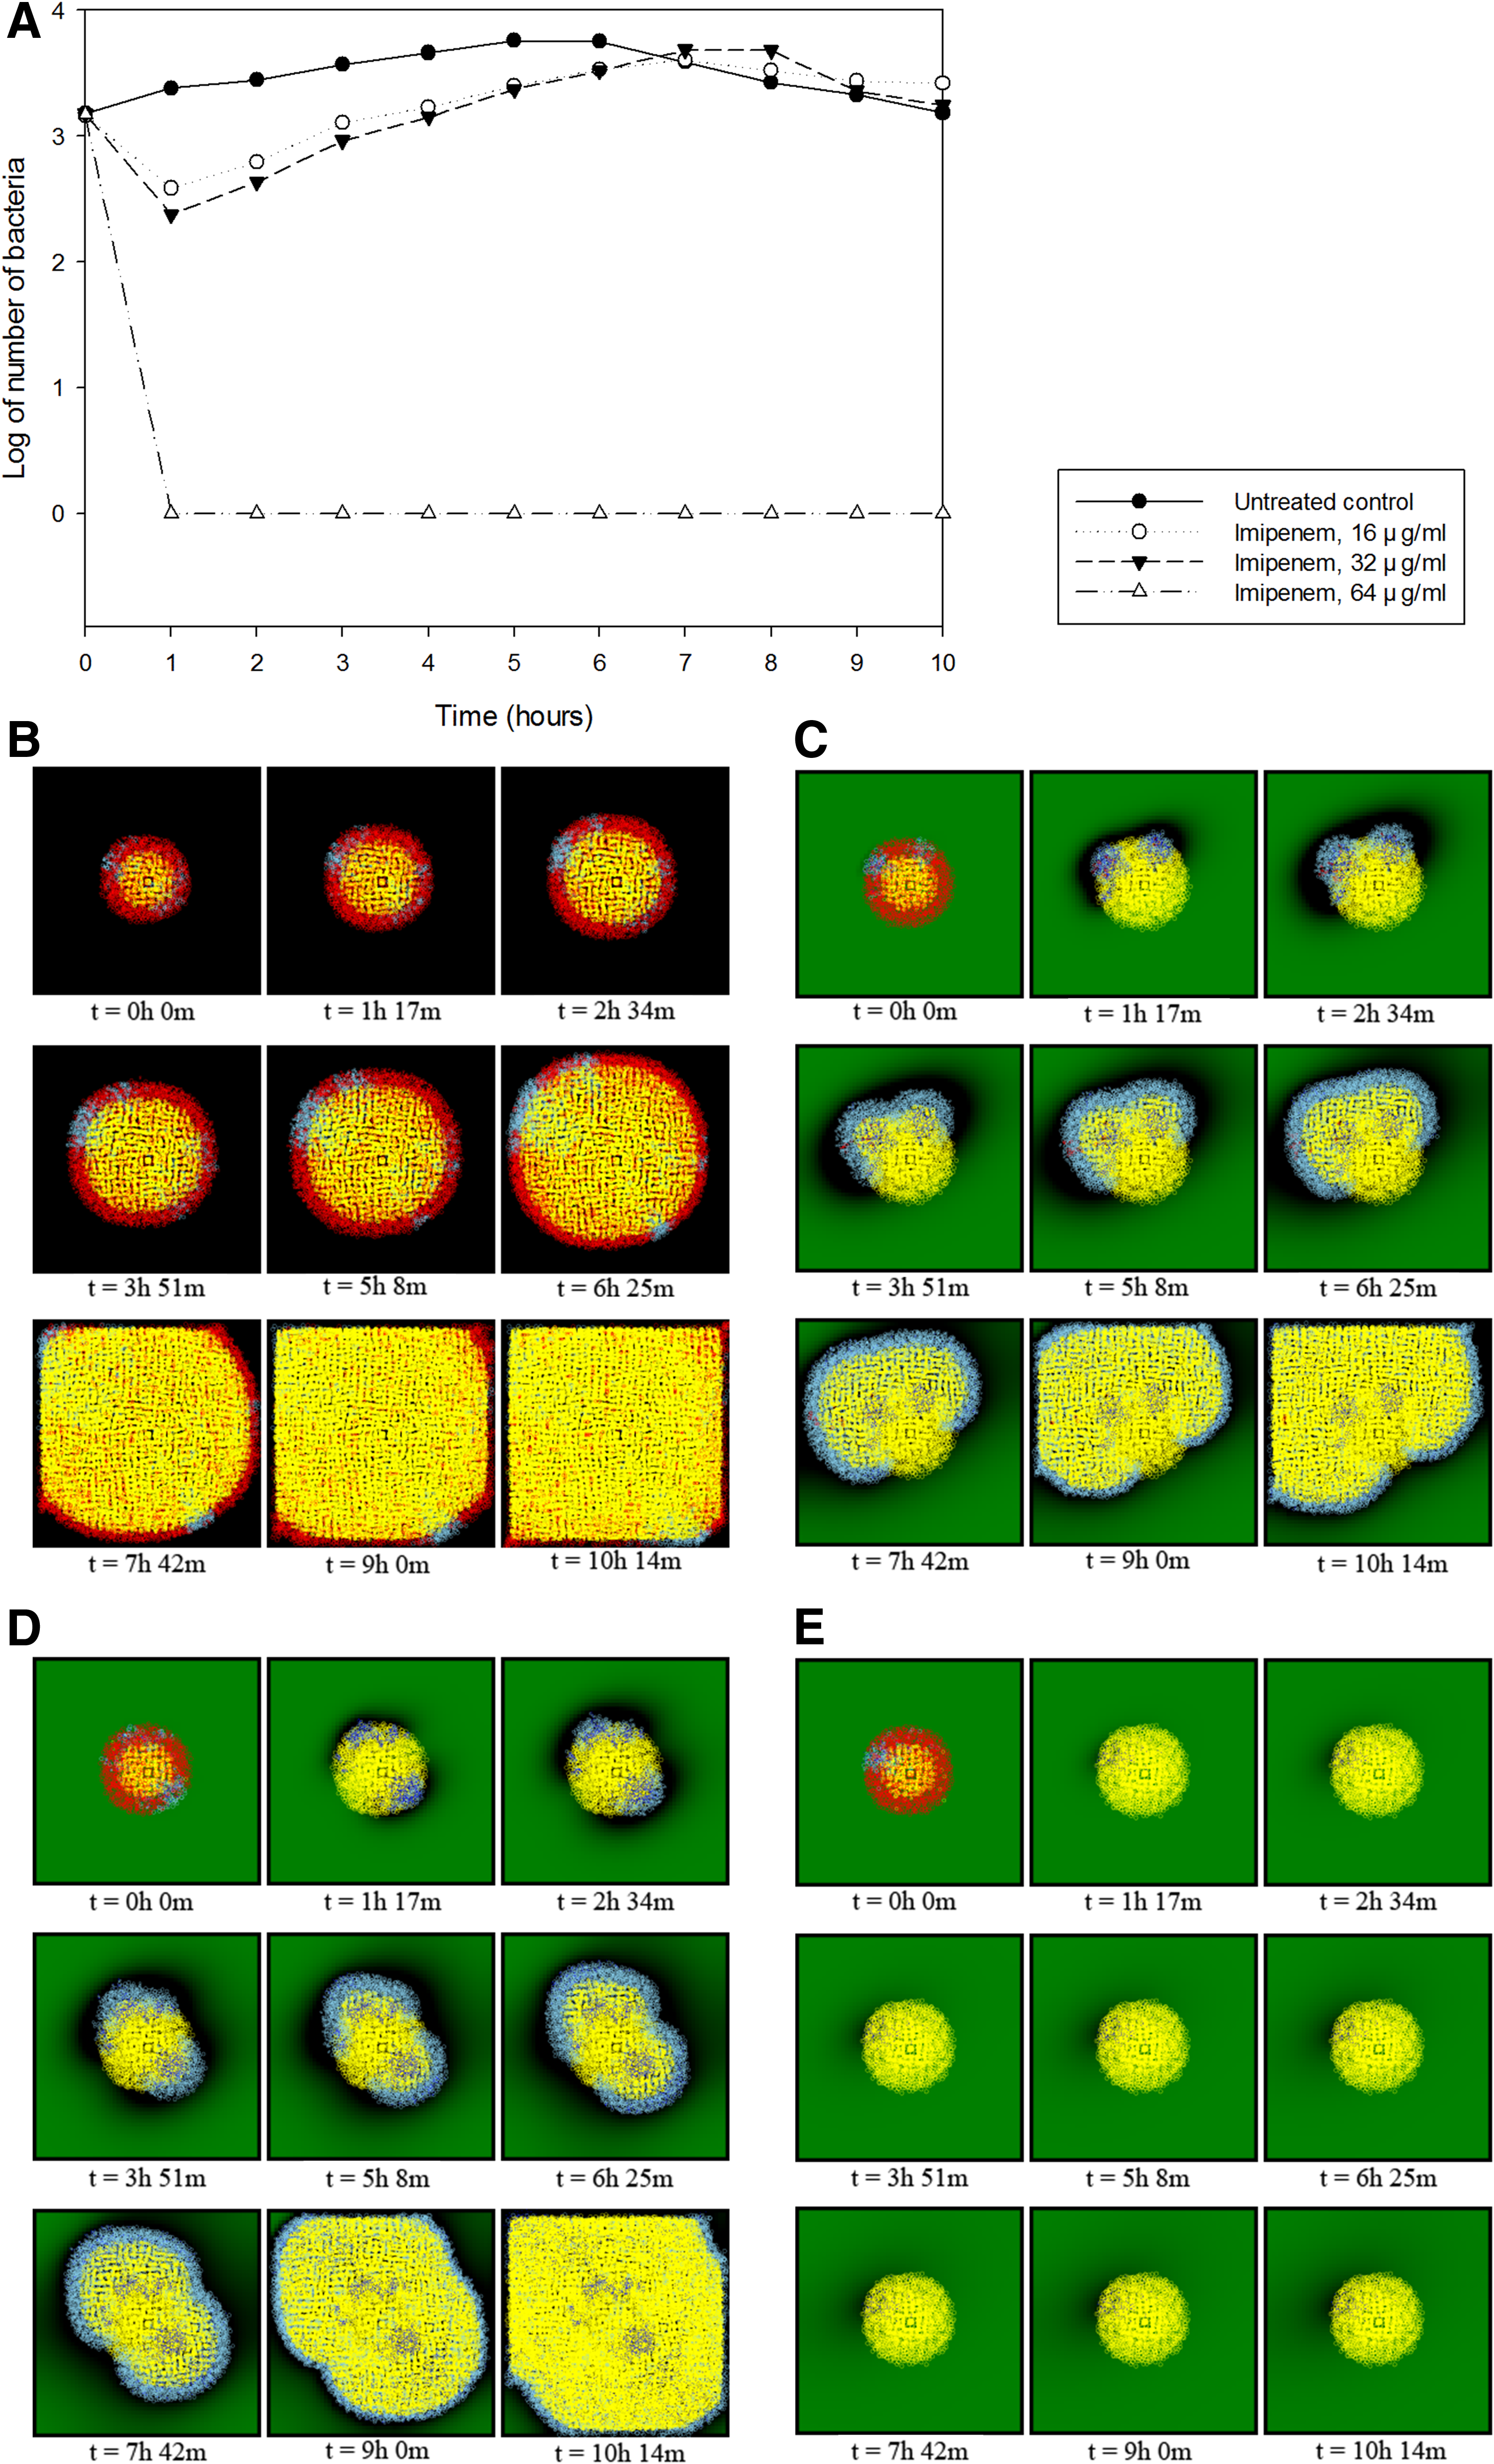
Predicted time-kill curves and visualization of Imipenem against carbapenem-resistant Klebsiella pneumoniae with the NDM-1 resistance gene.
The first 6 hours of simulations from t = 0 to t = 6 were similar to time-kill curves in previous studies (Worthington et al., 2012; Tang et al., 2014). Simulations using Meropenem on the same bacterial population containing both carbapenem-resistant bacteria and nonresistant bacteria showed dramatic population decreases at all 3 concentrations of 16, 32, and 64 μg/mL. Like the previous results with Imipenem, the entire population began to steadily increase after ∼2 hours of simulation at concentrations of 16 and 32 μg/mL, but was annihilated at a concentration of 64 μg/mL (Fig. 4). The time-kill curve was predicted to be similar overall to the graph for Imipenem, but the rate of increase slowed when the concentration was 32 μg/mL. We estimated that this difference was related to the parameters explaining the catalytic efficiency, kcat/Km. The parameters for kcat and Km were 10.8 and 127 for Imipenem and 4.0 and 68 for Meropenem, respectively, which can be written as (kcat/Km)Imipenem = 10.8/127 = 0.085 and (kcat/Km)Meropenem = 4.0/68 = 0.059. Therefore, we can assume that Meropenem has a lower efficiency than Imipenem against K. pneumoniae due to the smaller value of kcat/Km. This resulted in a decreased rate of antibiotic degradation by carbapenemase, which eventually caused the delay in bacterial growth. The results of seven simulations using Imipenem and Meropenem are shown in Table 2.
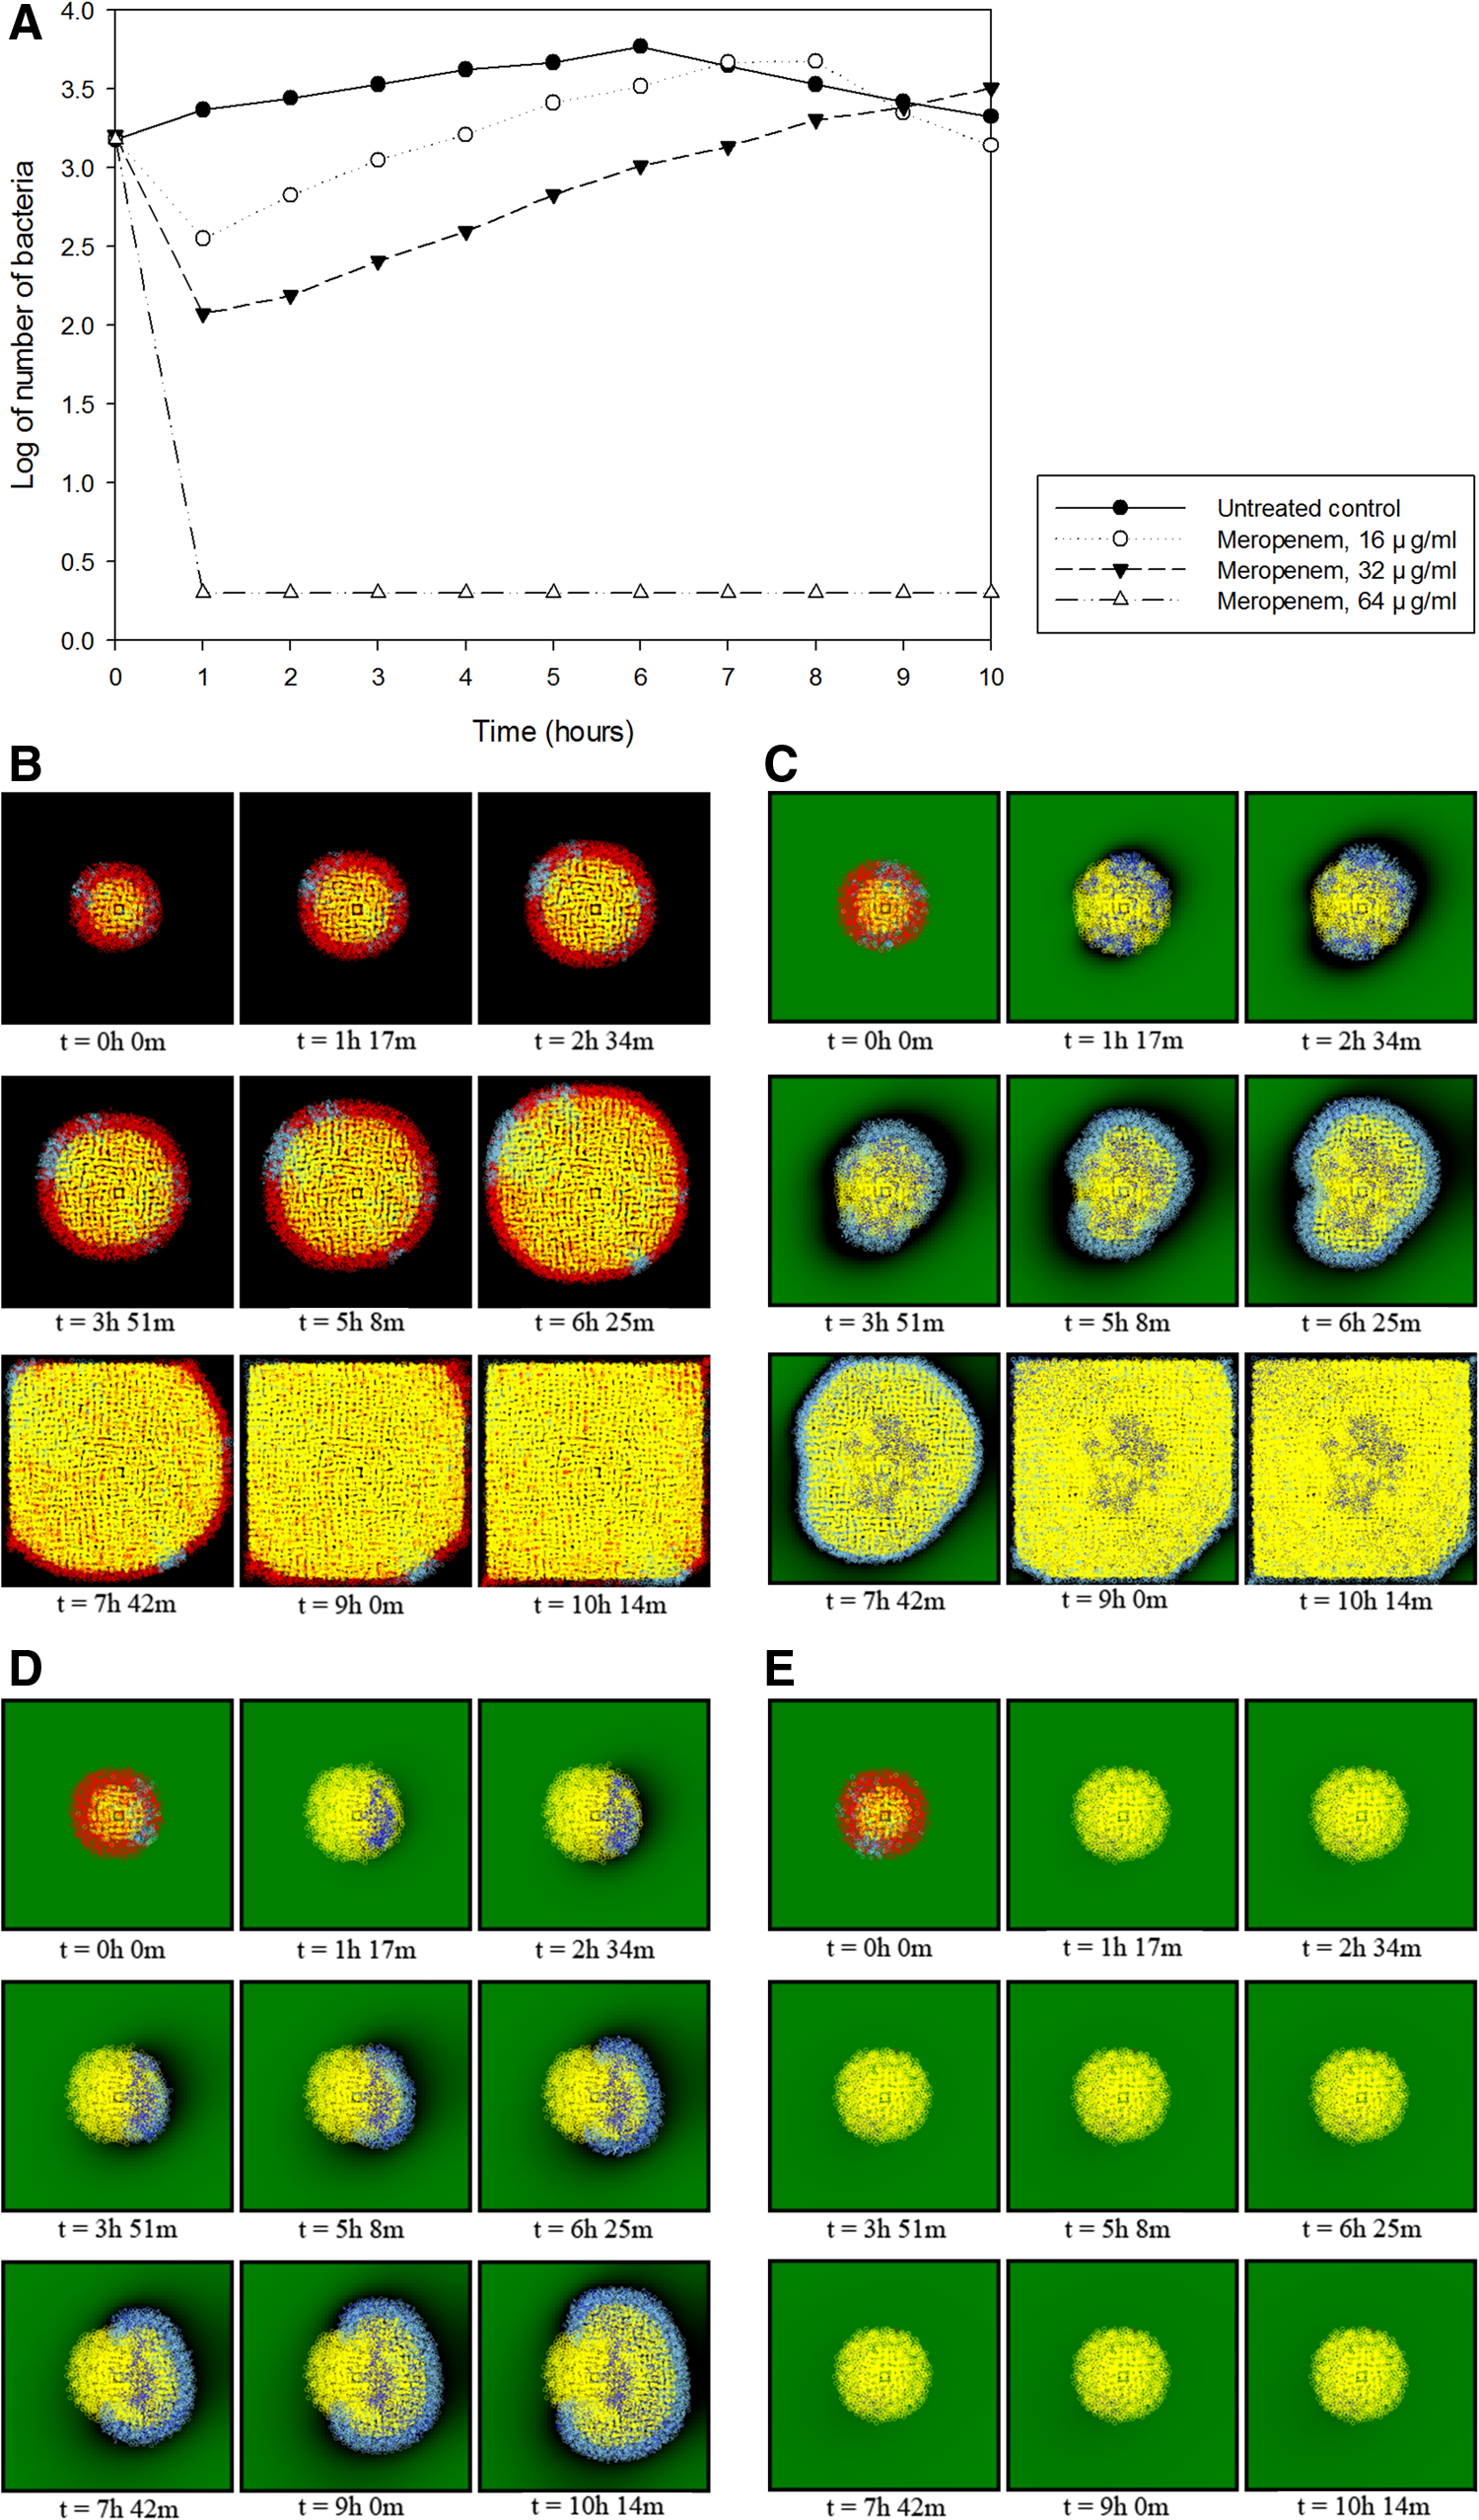
Predicted time-kill curves and visualization of Meropenem against carbapenem-resistant K. pneumoniae with the NDM-1 resistance gene.
The results of seven simulations using Imipenem and Meropenem are shown in this table. Concentrations chosen for simulations were based on laboratory results of K. pneumonia against both antibiotics. The untreated control was used for the comparison of the other six simulations.
4. Discussion
In this study, we performed virtual experiments using simulation models of bacterial growth and antibiotic resistance. The models consisted of four major entities, including bacteria, antibiotics, enzymes, and the environment, for which all molecular objects were modeled and programmed into the ARSim simulation tool. We implemented horizontal and vertical transfer mechanisms of antibiotic resistance genes. The horizontal gene transfer was implemented as passing genes on plasmids to other bacterial cells when two cells were close enough to be connected by pili. The vertical gene transfer was implemented by passing resistance genes to inheritor cells during cell division. We implemented quadtrees for the data structures of bacteria and enzymes considering efficiency issues. We saved and loaded parameters applied to the simulation model in JSON format for ease of use.
The main difficulty in implementing the biological mechanisms of bacteria and antibiotics was determining the parameters to be used and exploring their underlying scientific accuracy. It was impossible to implement all underlying physical actions and biochemical pathways when modeling bacterial growth or antibiotic resistance, thus we chose to utilize several basic biochemical equations and parameters based on the results of previous laboratory experiments. In addition, various biological principles such as the enzyme production rate after addition of antibiotics to bacteria and the effect of a dead bacterial cell on the whole population were not found in previous literature. In addition, the MIC values of antibiotics can vary from study to study, sometimes resulting in defects in the outcome of simulation results.
Looking at the functional aspects of the simulation program, there were limits to the various parameters that could be applied. The consequences of changes in temperature, acidity, and nutrient concentrations during bacterial growth could not be confirmed, so these parameters were excluded. For the same reason, all parameters regarding antibiotics were also simplified. Therefore, the unique advantage in simulation studies of adjusting various parameters and observing the outcome was restricted to some degree. However, when new antibiotics are added, implementing their mechanisms of action based on the literature will make it possible to run simulations with the new drugs because the program itself was designed to use flexible parameters.
For further improvements of the simulation model, accurately validated data acquired in traditional experiments are essential. Simulation models are designed based on theoretical knowledge and principles, but the parameters used in the simulation must be able to accurately reflect the phenomena occurring in the real world. Although simulation models have the potential to provide better options for increasing efficiency during wet-laboratory experiments, these computational approaches are not meant to replace existing traditional methodologies, but rather to complement them. Considering that only one antibiotic was used in each simulation in this study, additional antibiotics could be simultaneously added to predict the combined effect of antibiotics to make further improvements (Tängdén et al., 2014). As gene or genome sequencing costs decline annually, we should also prepare to use more sequence data from bacterial strains in our program to provide the most similar model based on phylogenetic trees and eventually conduct general simulations using the model.
5. Conclusion
The main purposes of this study were to design realistic models of bacterial growth and antibiotic resistance, implement the simulation models to observe and predict the effectiveness of antibiotics, and compare them to previous laboratory experimental results. We designed a bacterial population growth model and verified its validity by comparing the results to the four phases of bacterial growth. For the antibiotic resistance model, we implemented mechanisms of actions and interactions carried out by the bacteria, enzymes, and antibiotic molecules.
Currently, there are various public health issues related to AMR. One is the lack of preparedness for newly evolving resistant pathogens. In the case of influenza viruses, which are known as the major causative agents of periodic pandemics, public health agencies such as the World Health Organization (WHO) strictly analyze diverse emerging and reemerging viral strains. Thus, candidates of mutants that might cause global influenza pandemics are predicted, leading to the early stage of vaccine development to control and counteract newly generated species or subtypes. However, in the case of antibiotic resistance, the number of species that can potentially evolve and become resistant to antibiotics is very large.
Research, development, and clinical trials to discover or develop new antibiotics involve significant financial risks and are expected to have very low returns on investment. New methodologies must be developed to find new antibiotics. The computational approaches used in this work may provide an appropriate method for drug development. We hope the simulation models and tools developed in this study will provide researchers with new and effective methods to combat antibiotic resistance.
Footnotes
Acknowledgments
Portions of this work were presented and published in thesis form in fulfillment of the requirements for the M.ph. for Student J.Y.P. from Seoul National University. This work was supported by the National Research Foundation of Korea (NRF) grant funded by the Korea government (MSIP) (No. 2016R1C1B2015511) and the Ministry of Education (No. 2017R1D1A1B03033413).
Author Disclosure Statement
No competing financial interests exist.