
Abstract
Abstract
Previous studies on quality score compression can be classified into two main lines: lossy schemes and lossless schemes. Lossy schemes enable a better management of computational resources. Thus, in practice, and for preliminary analyses, bioinformaticians may prefer to work with a lossy quality score representation. However, the original quality scores might be required for a deeper analysis of the data. Hence, it might be necessary to keep them; in addition to lossy compression this requires lossless compression as well. We developed a space-efficient hierarchical representation of quality scores, QScomp, which allows the users to work with lossy quality scores in routine analysis, without sacrificing the capability of reaching the original quality scores when further investigations are required. Each quality score is represented by a tuple through a novel decomposition. The first and second dimensions of these tuples are separately compressed such that the first-level compression is a lossy scheme. The compressed information of the second dimension allows the users to extract the original quality scores. Experiments on real data reveal that the downstream analysis with the lossy part—spending only 0.49 bits per quality score on average—shows a competitive performance, and that the total space usage with the inclusion of the compressed second dimension is comparable to the performance of competing lossless schemes.
1. Introduction
S
FASTQ files include four lines per read. The first and the third line, beginning with the @ and + symbols, respectively, indicate the read identifier and an optional description. The second line lists the read-out nucleotides. For each nucleotide in the second line, a corresponding quality score (QS) Q is stored in the fourth line. The quality scores indicate the accuracy of the base calling by
So far, efforts in compressing raw sequencing data stored in FASTQ files have been focusing on compressing the nucleotide sequences, quality scores, and read identifiers separately. This approach yields a better performance than jointly compressing the different streams since these streams have divergent statistical properties. Previous studies on quality score compression can be further separated into two categories: lossy schemes and lossless schemes. The lossy methods achieve much better compression ratios by sacrificing some information. This is done by reducing the alphabet size of the quality scores according to specific quantization methods. Although these lossy approaches help a lot in terms of storage and transmission of the data, the original values might still be required for further analyses (Van der Auwera et al., 2013).
The daily practice in sequencing data analysis starts with regular routines. In further steps of the analysis, deeper investigations are performed on the reads that are mapped to regions of interest detected by these regular routines. Quantized quality scores may work well during the initial processing unless the incorporated quantization does impact further steps significantly. Thus, when the target regions regarding the tested hypothesis become clear, necessity to access the original quality scores of the selected reads may become unavoidable during further downstream analyses. Yet another reason to keep the original values stems from the underlying thought that the original quality scores might be required by new methods in the future. Specifically, in large population genomics projects, the owners of the data may prefer lossless compression techniques. Thus, an approach would be preferable where the users have the choice to work effectively in the first stage with quality scores represented with a lossy scheme, but at the same time have the choice to reach the original values in following analysis steps.
Motivated by this demand, we explore in this study a two-level approach for the compact representation of the quality scores. By using a novel decomposition scheme
2. Previous Studies
In a FASTQ file the alphabet for the nucleotides (i.e., A, C, G, T, and N) is usually much smaller than that of the quality scores, which typically stem from an alphabet of size 40 or 41 (Cock et al., 2010). Thus, quality scores at full resolution are, in general, more difficult to compress. Therefore, the overall success of compressing an input FASTQ file depends more on the representation of the quality scores than on the compression of the nucleotide sequences.
Lossless compression techniques focus on detecting regularities in quality score streams (Wan et al., 2012). For instance, some of the quality scores are likely to be more frequent than others, or several biases may appear in some positions of the reads due to the underlying sequencing technology. Remember that a compression scheme can be viewed as a two-step process, where the first phase is to devise a context model describing the data, and the second phase is to encode the data that are represented with that model using an entropy coder. General-purpose FASTQ compressors mainly differ in their context modeling approaches. The DSRC scheme defines three models for quality score streams, and represents a given quality score sequence according to its best-fitting model (Deorowicz and Grabowski, 2011). SCALCE (Hach et al., 2012) and Quip (Jones et al., 2012) make use of a single standard order-3 context model, and encode every quality score according to its three immediate predecessors. Fastqz (Bonfield and Mahoney, 2013) applies a more complex scheme that uses relations in the near predecessors to define the context of the current quality score.
Lossy compression was considered based on the assumption that the resolution of raw quality scores is much higher than required for accuracy evaluation, and that the tools in the analysis pipelines will not be affected much from a lossy representation. It was proven that this assumption is true, and more than that, actually lossy representations improve the efficiency of downstream analyses in many cases (Yu et al., 2015; Ochoa et al., 2016). The authors (Wan et al., 2012) explored different binning strategies and their effects on the compression efficiency. Besides simple bucketing that uses fixed-length intervals, variable-length intervals inferred through a number of different statistical measures have also been proposed (Cánovas et al., 2014).
Another statistical approach has been introduced with QualComp (Ochoa et al., 2013). QualComp fits a Gaussian distribution to the quality score sequences (i.e., vectors), and provides users with the ability to define the level of acceptable distortion during encoding. According to the specified number of bits to be used per quality score, QualComp performs the optimal alteration of the quality scores such that the mean squared error is minimized according to the precomputed Gaussian model. This idea has been further improved by the more recent QVZ and QVZ 2 compressors (Malysa et al., 2015; Hernaez et al., 2016). Besides the binning and statistical inference approaches, there are other efforts which exploit the information contained in the read-out nucleotide sequences (Janin et al., 2014; Yu et al., 2015; Voges et al., 2017). For example, the Quartz compressor (Yu et al., 2015) sets the quality scores of the most frequent k-mers to a predefined high value with the motivation that if a specific nucleotide sequence is observed many times, then its correctness does not need any further verification from the quality scores. Thus, the quality scores can be set to a fixed value. This way the entropy is reduced and higher compression performance is achieved.
3. Proposed Methods
When an analysis pipeline automatically returns results for a set of reads (stored in a FASTQ file), the analyst usually feels the necessity to perform a verification of these results by investigating the reads together with their associated quality scores. A bioinformatician working on such reads might become suspicious when she observes low-quality scores since those indicate a possible error in the base-calling process, which could have then caused problems in the automatically produced results. Similarly, when quality scores are larger than a threshold, it does not tell much to the analyst in most cases as there appears to be not much practical difference between the 99.999% accuracy with
Therefore, it seems that a simple bucketing approach with short intervals for the small quality scores and larger intervals for the higher quality scores might work well in practical analyses. Hence, we propose to decompose a quality score Q into the tuple
such that
Notice that given q1 and q2, the inverse decomposition yields the original quality score as
This decomposition is inspired by the representation of integers in an Elias gamma code (Elias, 1975; or its generalization, the Exp-Golomb code, Ostermann et al., 2004). Assume
Table 1 shows the decomposition of quality scores in the interval
The corresponding squared q1 value is highlighted in bold.
Without incorporating the q2 values, the representation of quality scores (only by their corresponding q1 values) creates a simple lossy scheme. In that sense, a FASTQ file in which all quality scores are changed to their
4. Experimental Results
In this section, we provide experimental results for the evaluation of the proposed compression scheme QScomp. We compare QScomp to three competitors, namely Crumble (https://github.com/jkbonfield/crumble), Quartz (Yu et al., 2015), and QVZ 2 (Hernaez et al., 2016). Table 2 lists the tools, including QScomp, which were selected for the evaluation in this work.
Note that QScomp is the only tool which truly is able to operate in the lossless and in the lossy mode.
The data sets used to evaluate the performance of the selected compression tools originate from the same individual, namely NA12878. For this individual, the National Institute of Standards and Technology (NIST) released a consensus set of variants, which we used for our analyses (Zook et al., 2016). Note that similar analyses were conducted in other works (Alberti et al., 2016; Ochoa et al., 2016; Voges et al., 2017). The selected data sets are shown in Table 3. For more information on the used data sets we refer the reader to the Supplementary Data.
Moreover, for the evaluation of the proposed compression scheme QScomp, we selected three different variant-calling pipelines. The first pipeline is composed of GATK (Van der Auwera et al., 2013) variant calling (using the HaplotypeCaller tool) and SNP extraction with subsequent filtering of variants using GATK Vector Quality Score Recalibration (VQSR) with four different filter values. The second pipeline is also composed of GATK variant calling using the HaplotypeCaller tool and SNP extraction, but followed by the more traditional hard filtration of variants instead of VQSR. The third pipeline uses Platypus (Rimmer et al., 2014) for variant calling. For the individual commands and tools and auxiliary files used, we refer the reader to the Supplementary Data.
Each of the mentioned pipelines outputs a set of variants in the VCF file format. Subsequently, each set of variants is compared with the consensus set of variants. We perform this comparison using the tool hap.py (https://github.com/Illumina/hap.py) released by Illumina and adopted by the Global Alliance for Genomics and Health (GA4GH). This benchmarking tool outputs the following values for each comparison:
True Positives (T.P.): All those variants that are both in the consensus set and in the set of called variants. False Positives (F.P.): All those variants that are in the called set of variants but not in the consensus set. False Negatives (F.N.): All those variants that are in the consensus set but are not in the set of called variants. Non-Assessed Calls: All those variants that fall outside of the consensus regions defined by a BED file.
These values are used to compute the following two metrics:
Recall/Sensitivity: This is the proportion of called variants that are included in the consensus set; that is, Precision: This is the proportion of consensus variants that are called by the variant calling pipeline; that is,
Finally, we measured the maximum memory usage and the execution time of each tool on each dataset with GNU time.
4.1. Performance analysis of the proposed scheme
In this section we first show the compression ratios of all tools and for all datasets from Table 3.
Figure 1 shows the compression results for all tools in bits per quality score. In addition to the compression results for the mentioned tools, we also show the memoryless entropy per original quality score, which is 3.62 bits per quality score, averaged over all data sets. Furthermore, we show the gzip and bzip2 compression results for the raw quality scores, which are 3.54 bits per quality score and 3.27 bits per quality score, also averaged over all data sets.
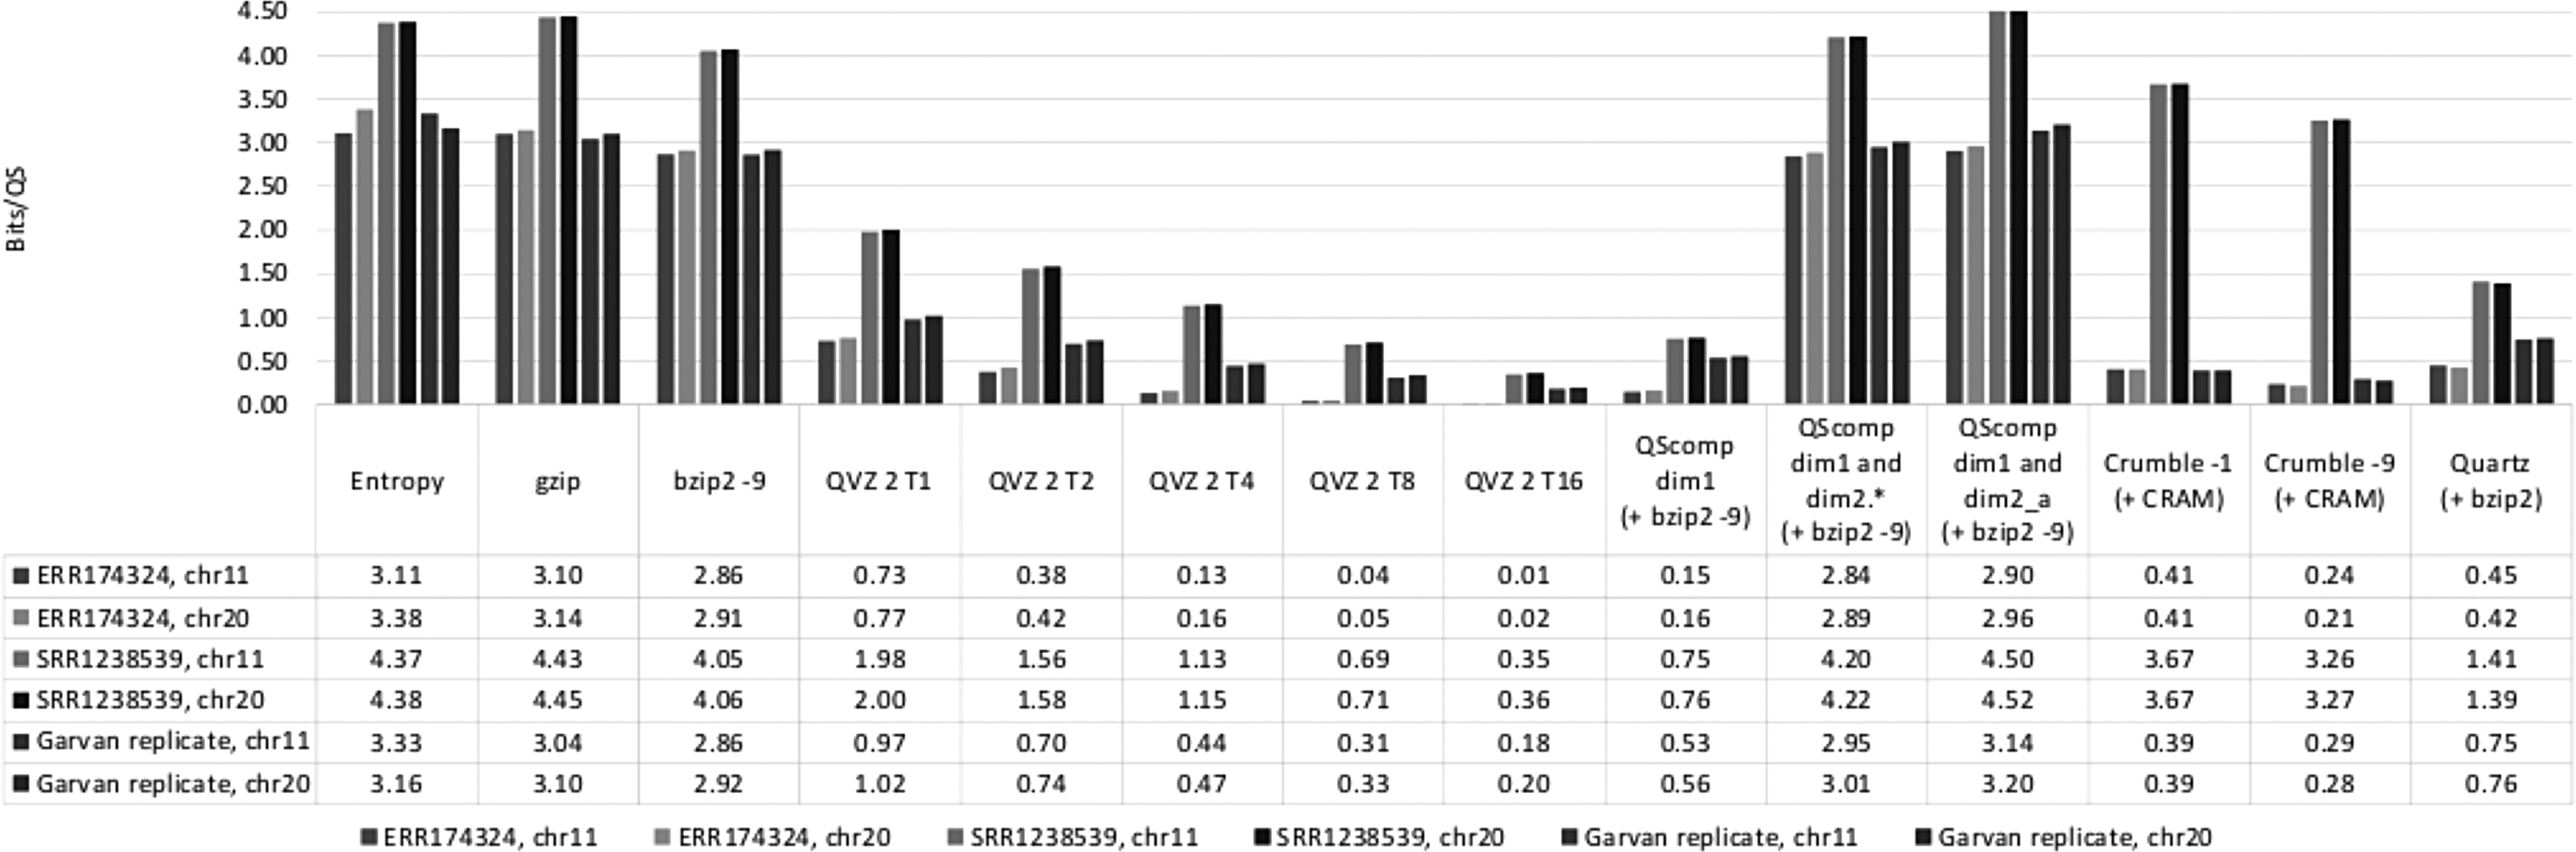
Compression ratios results.
As shown in Figure 1, the lossy quality score representation obtained using QScomp with subsequent bzip2 compression (i.e., “QScomp dim1 (+ bzip2 −9)”) yields 0.49 bits per quality score on average. This result is comparable to the results obtained with QVZ 2 when a target mean squared error (MSE) of 8 (i.e., “QVZ 2 T8”) is specified, which yields 0.35 bits per quality score on average.
We can observe from the figure that the lossless quality score representation of QScomp with subsequent bzip2 compression (i.e., “QScomp dim1 and dim2.* (+ bzip2 −9)”) is capable of delivering 3.35 bits per quality score, which is slightly below the entropy, as expected. The two-level scheme of QScomp with conditional compression of the second level with respect to first level is slightly superior to just compressing the quality scores with gzip, and comparable to compressing the quality scores with bzip2. Thus, QScomp does not sacrifice the lossless compression performance, while combining the lossless and lossy compression through its unique two-level scheme. We finally show in Figure 1 the results of compressing the joint single sequence of q2 values (i.e., “QScomp dim1 and dim2_a (+ bzip −9)”). This experiment yields 3.53 bits per quality score. These results suggest that the proposed separate compression of multiple q2 sequences is superior to just compressing the q2 residues as a single stream.
Furthermore, we measured the maximum memory usage and the execution time of each tool with GNU time 1.7.
The complete performance results for all tools and datasets are shown in Figure 2.
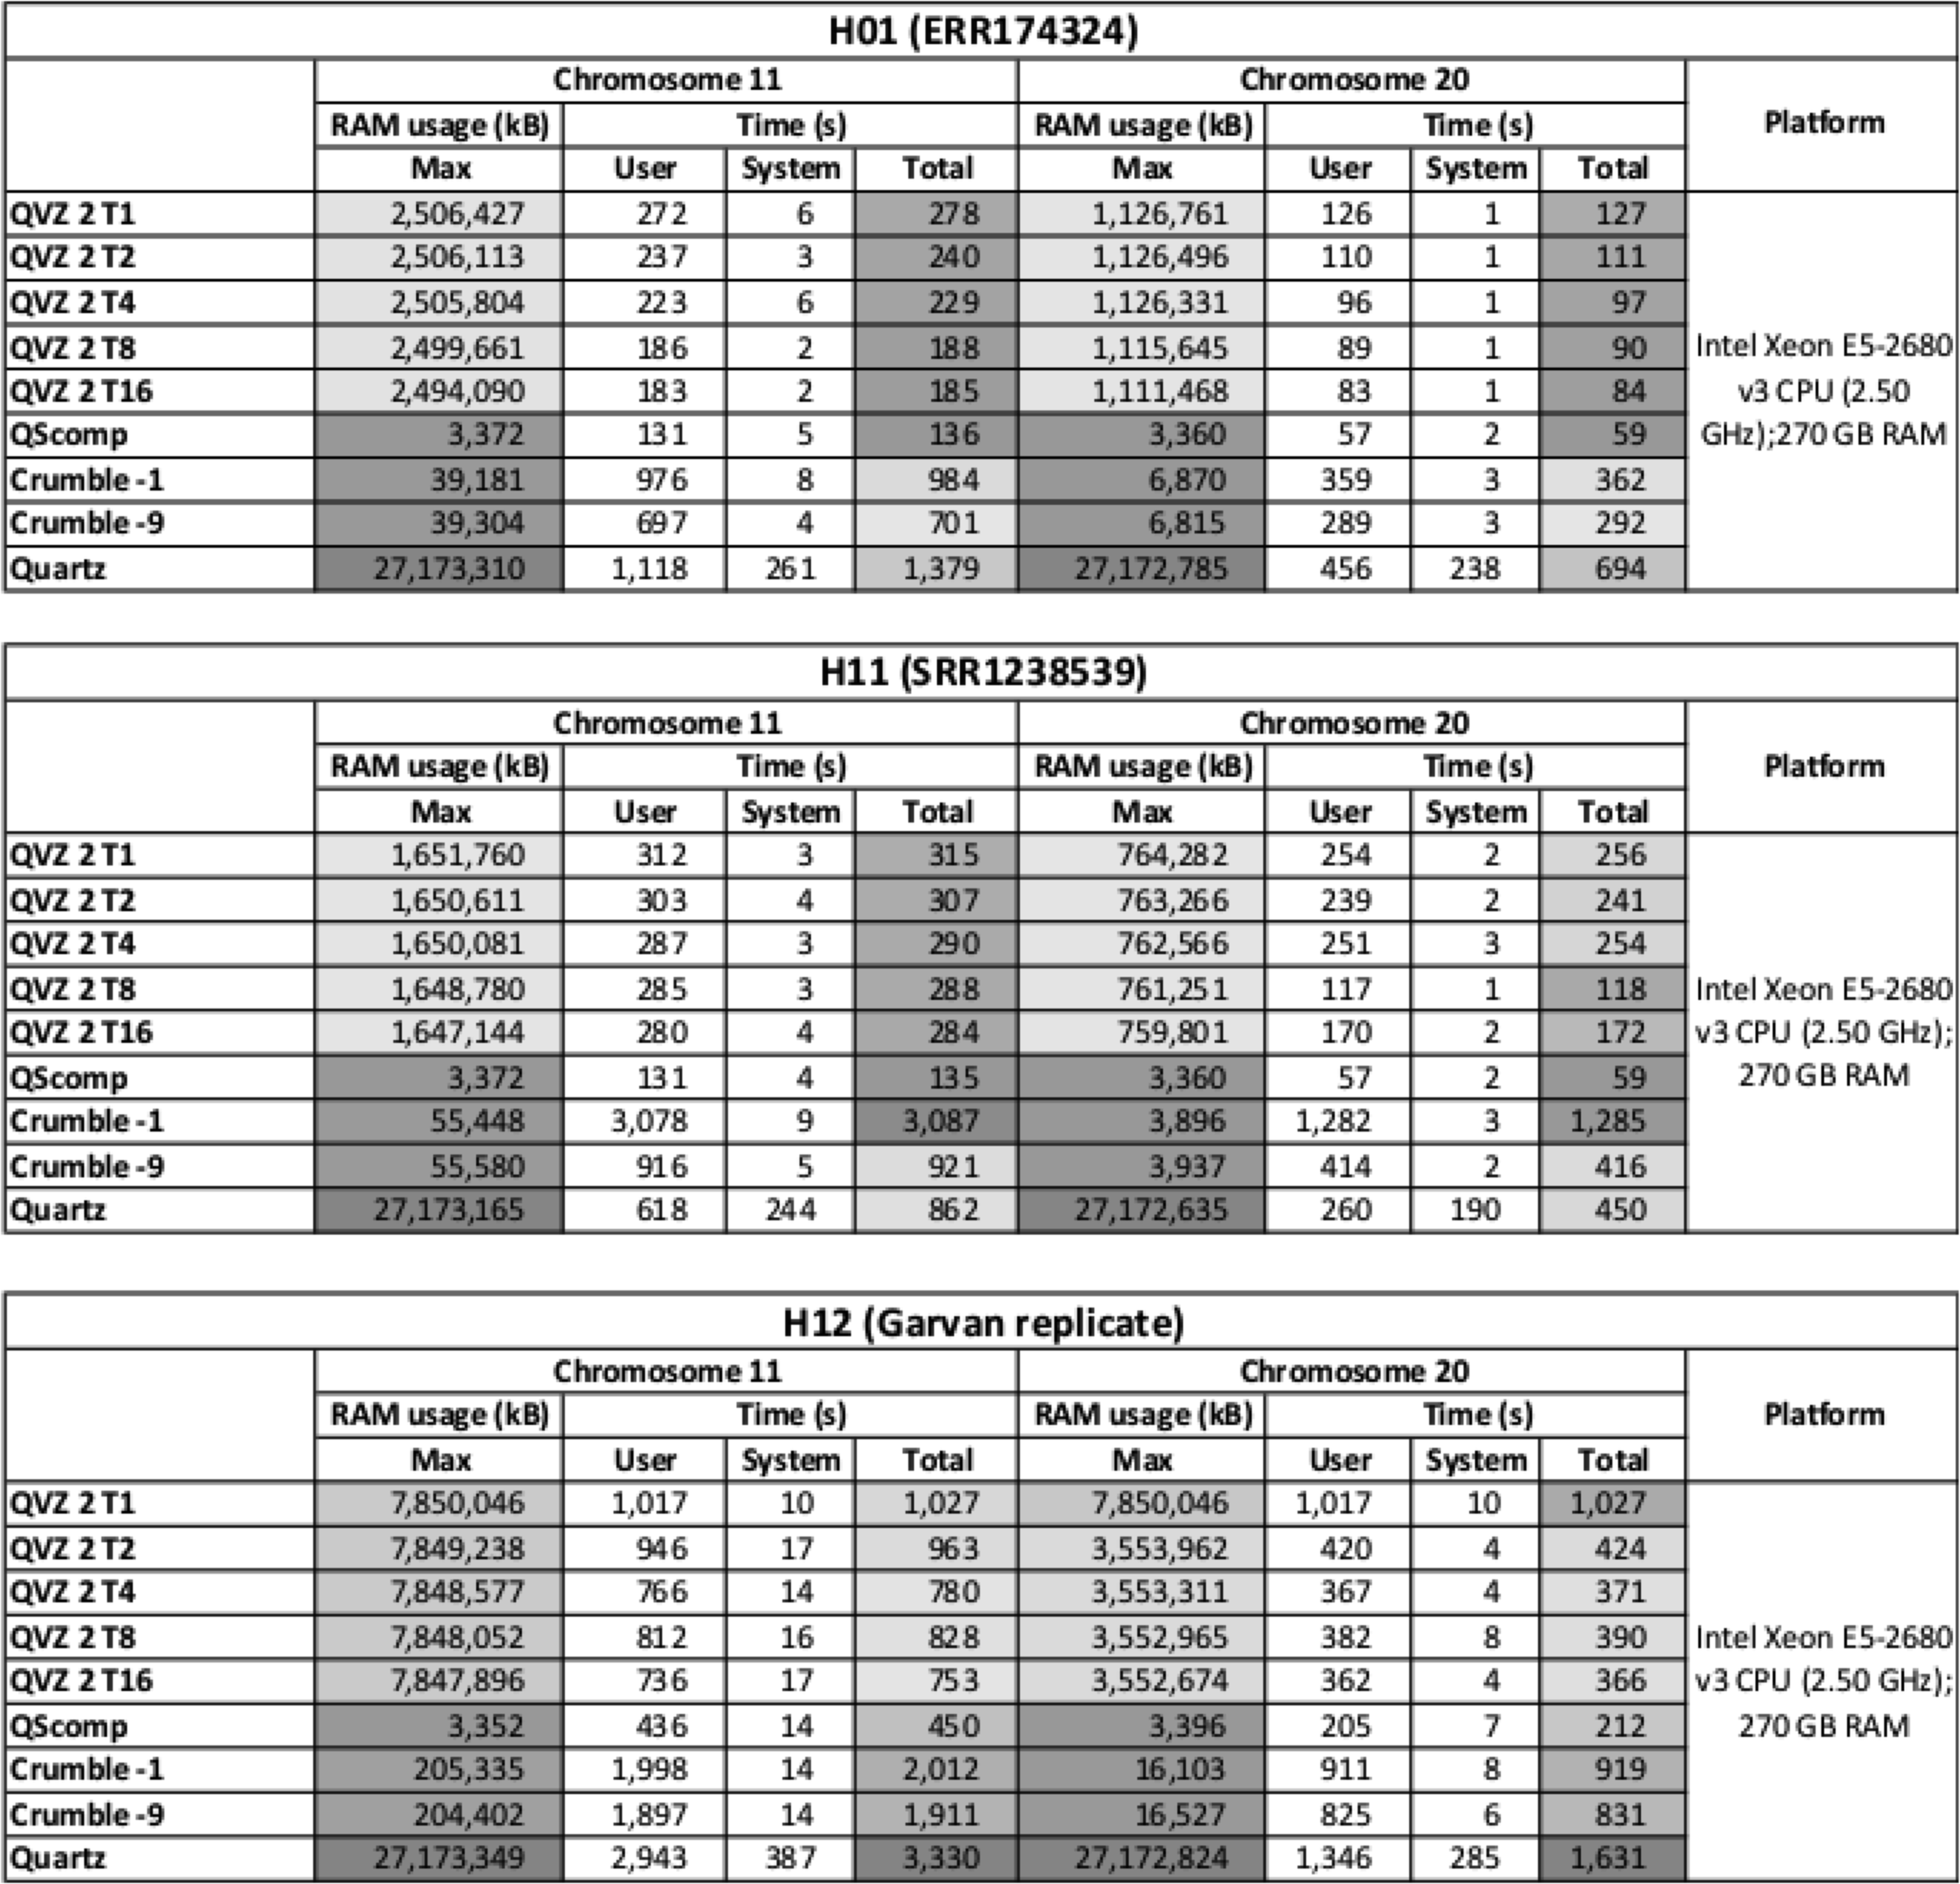
Performance measurements results.
The maximum RAM usage results for all tools and datasets are shown in Figure 3. Note that we applied a logarithmic scaling to the Y-axis.
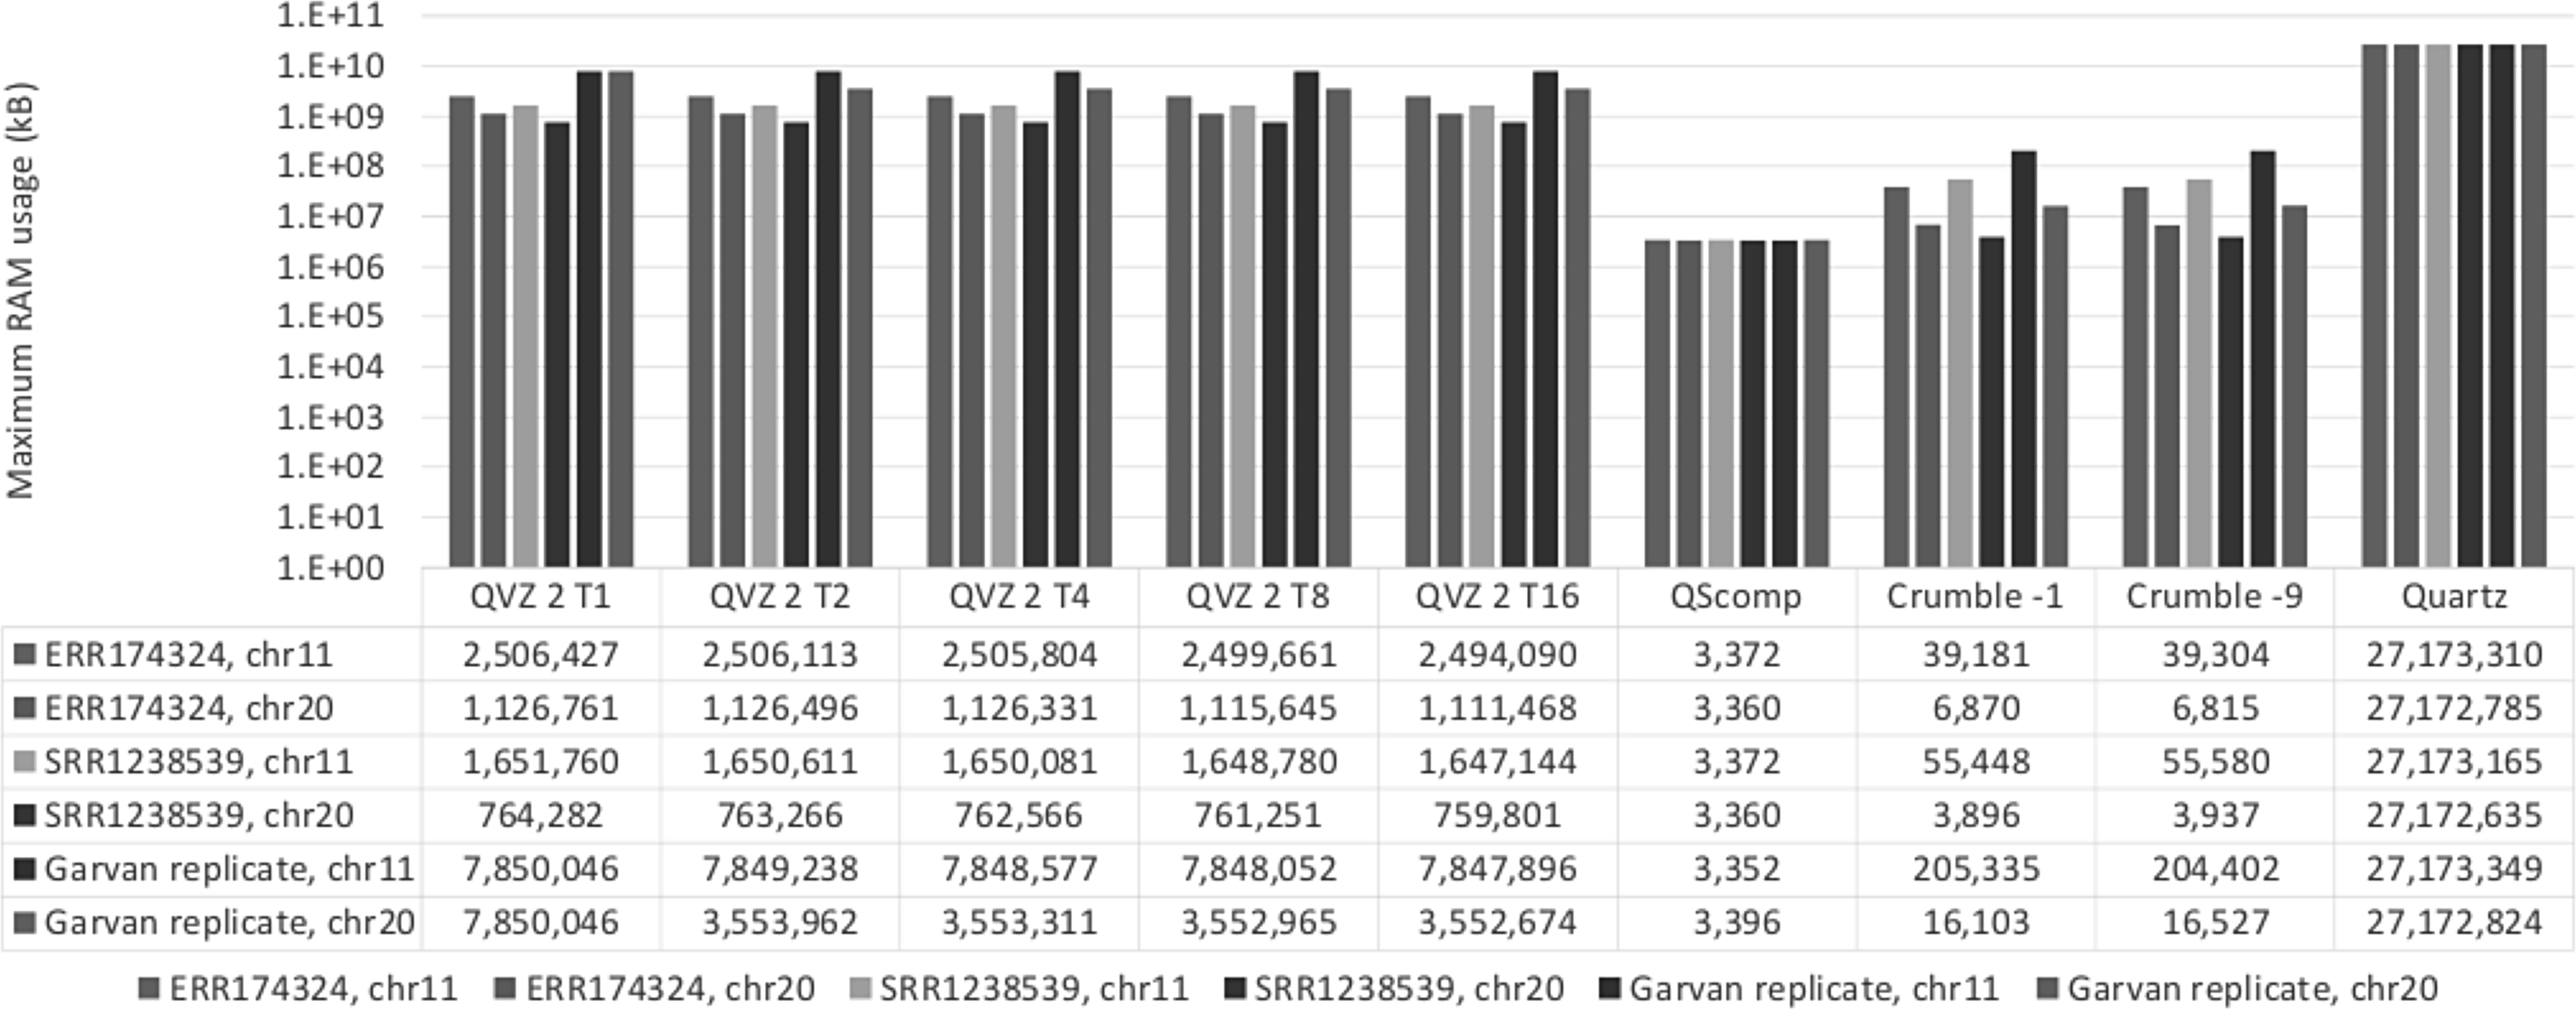
Maximum RAM usage results.
The running times for all tools and datasets are shown in Figure 4.
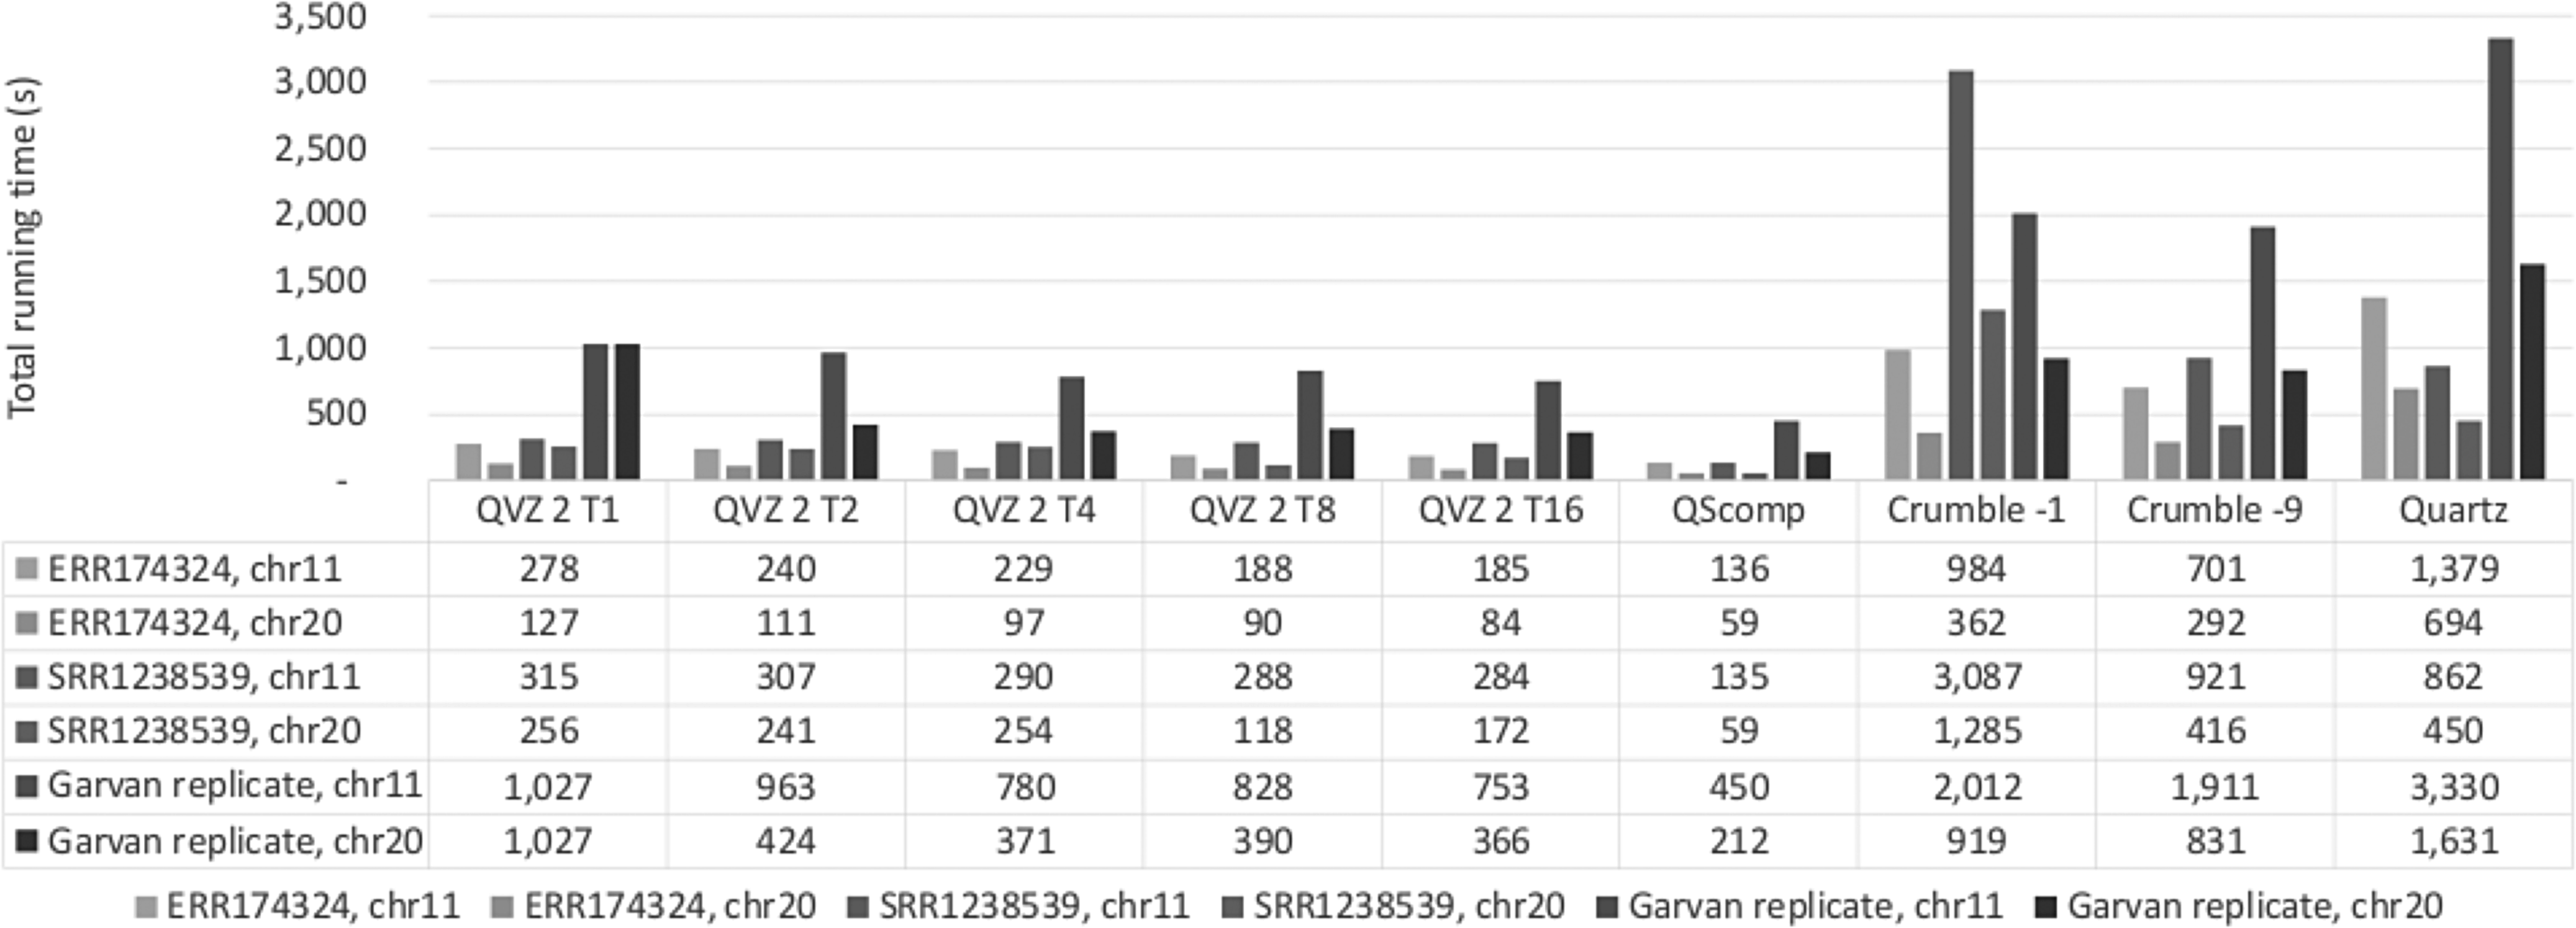
Total running time results.
QScomp exhibits the least RAM usage of all tools, with 3.4 MB on average, due to its low algorithmic complexity. The running times of QScomp are comparable to that of the different runs of QVZ 2 and even two orders of magnitude lower than that of Quartz.
4.2. Variant calling results
In this section, we show the results of variant calling with the GATK + VQSR pipeline. For further results obtained from running the other two pipelines, we refer the reader to the Supplementary Data. For the first set of simulations we used the paired-end run ERR174324 of the NA12878 individual. This run was sequenced by Illumina on an Illumina HiSeq 2000 system as part of their Platinum Genomes project. The coverage of this data set is 14
We can observe from Figure 5 that QScomp compresses the quality scores down to 0.16 bits per quality score while the Precision is retained. However, we also observe a slight drop in Recall, compared with the results for the uncompressed data.
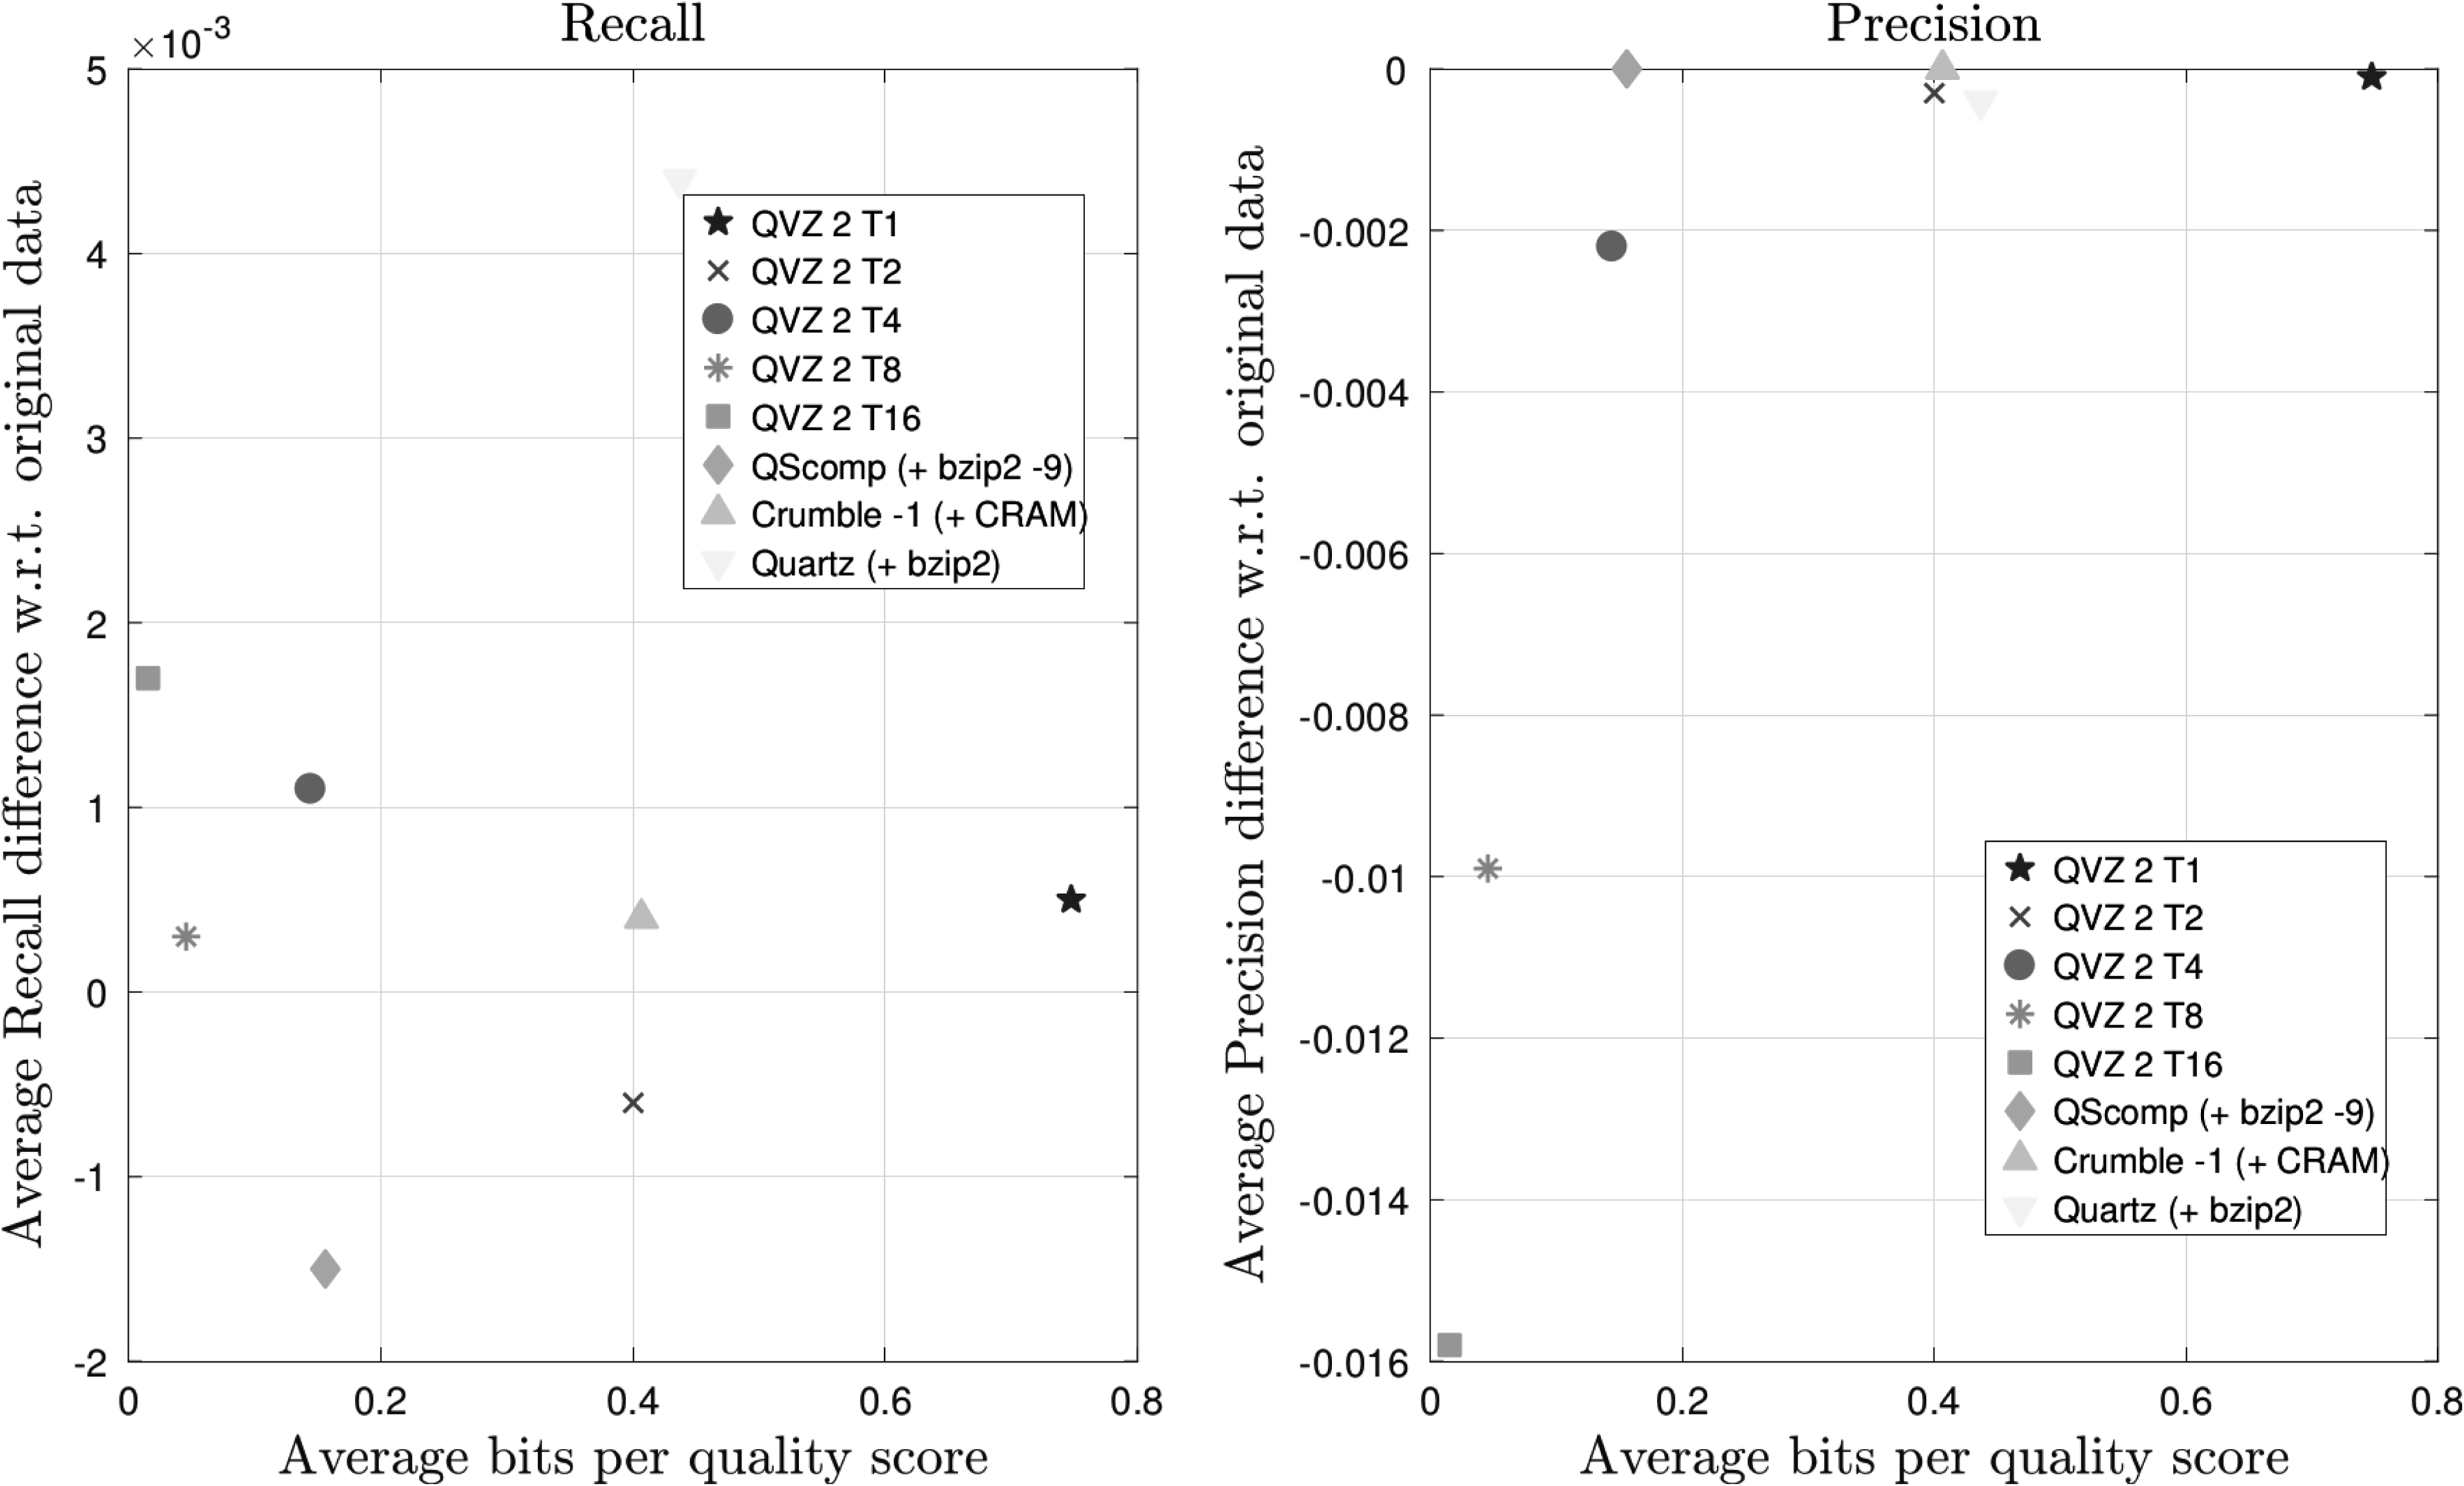
Recall and Precision results averaged over both chromosomes (11 and 20) and all four VQSR filter values for the Illumina HiSeq 2000 data set (ERR174324) with a coverage of 14 × . VQSR, Vector Quality Score Recalibration.
Next, we show the results for the SRR1238539 run on the NA12878 individual for which an Ion Torrent sequencing machine was used. The coverage of this data set is 10 × . Again, chromosomes 11 and 20 were considered due to the size of the data. Moreover, the results shown are also the results of averaging over the same four filter values and both chromosomes. Figure 6 shows that QScomp is the worst performer in terms of both Recall and Precision. Since all other tools exhibit a similar performance, we must conclude that the assumptions used for the construction of the binning scheme implemented in QScomp do not seem to hold for the quality score statistics produced by Ion Torrent sequencing machines.
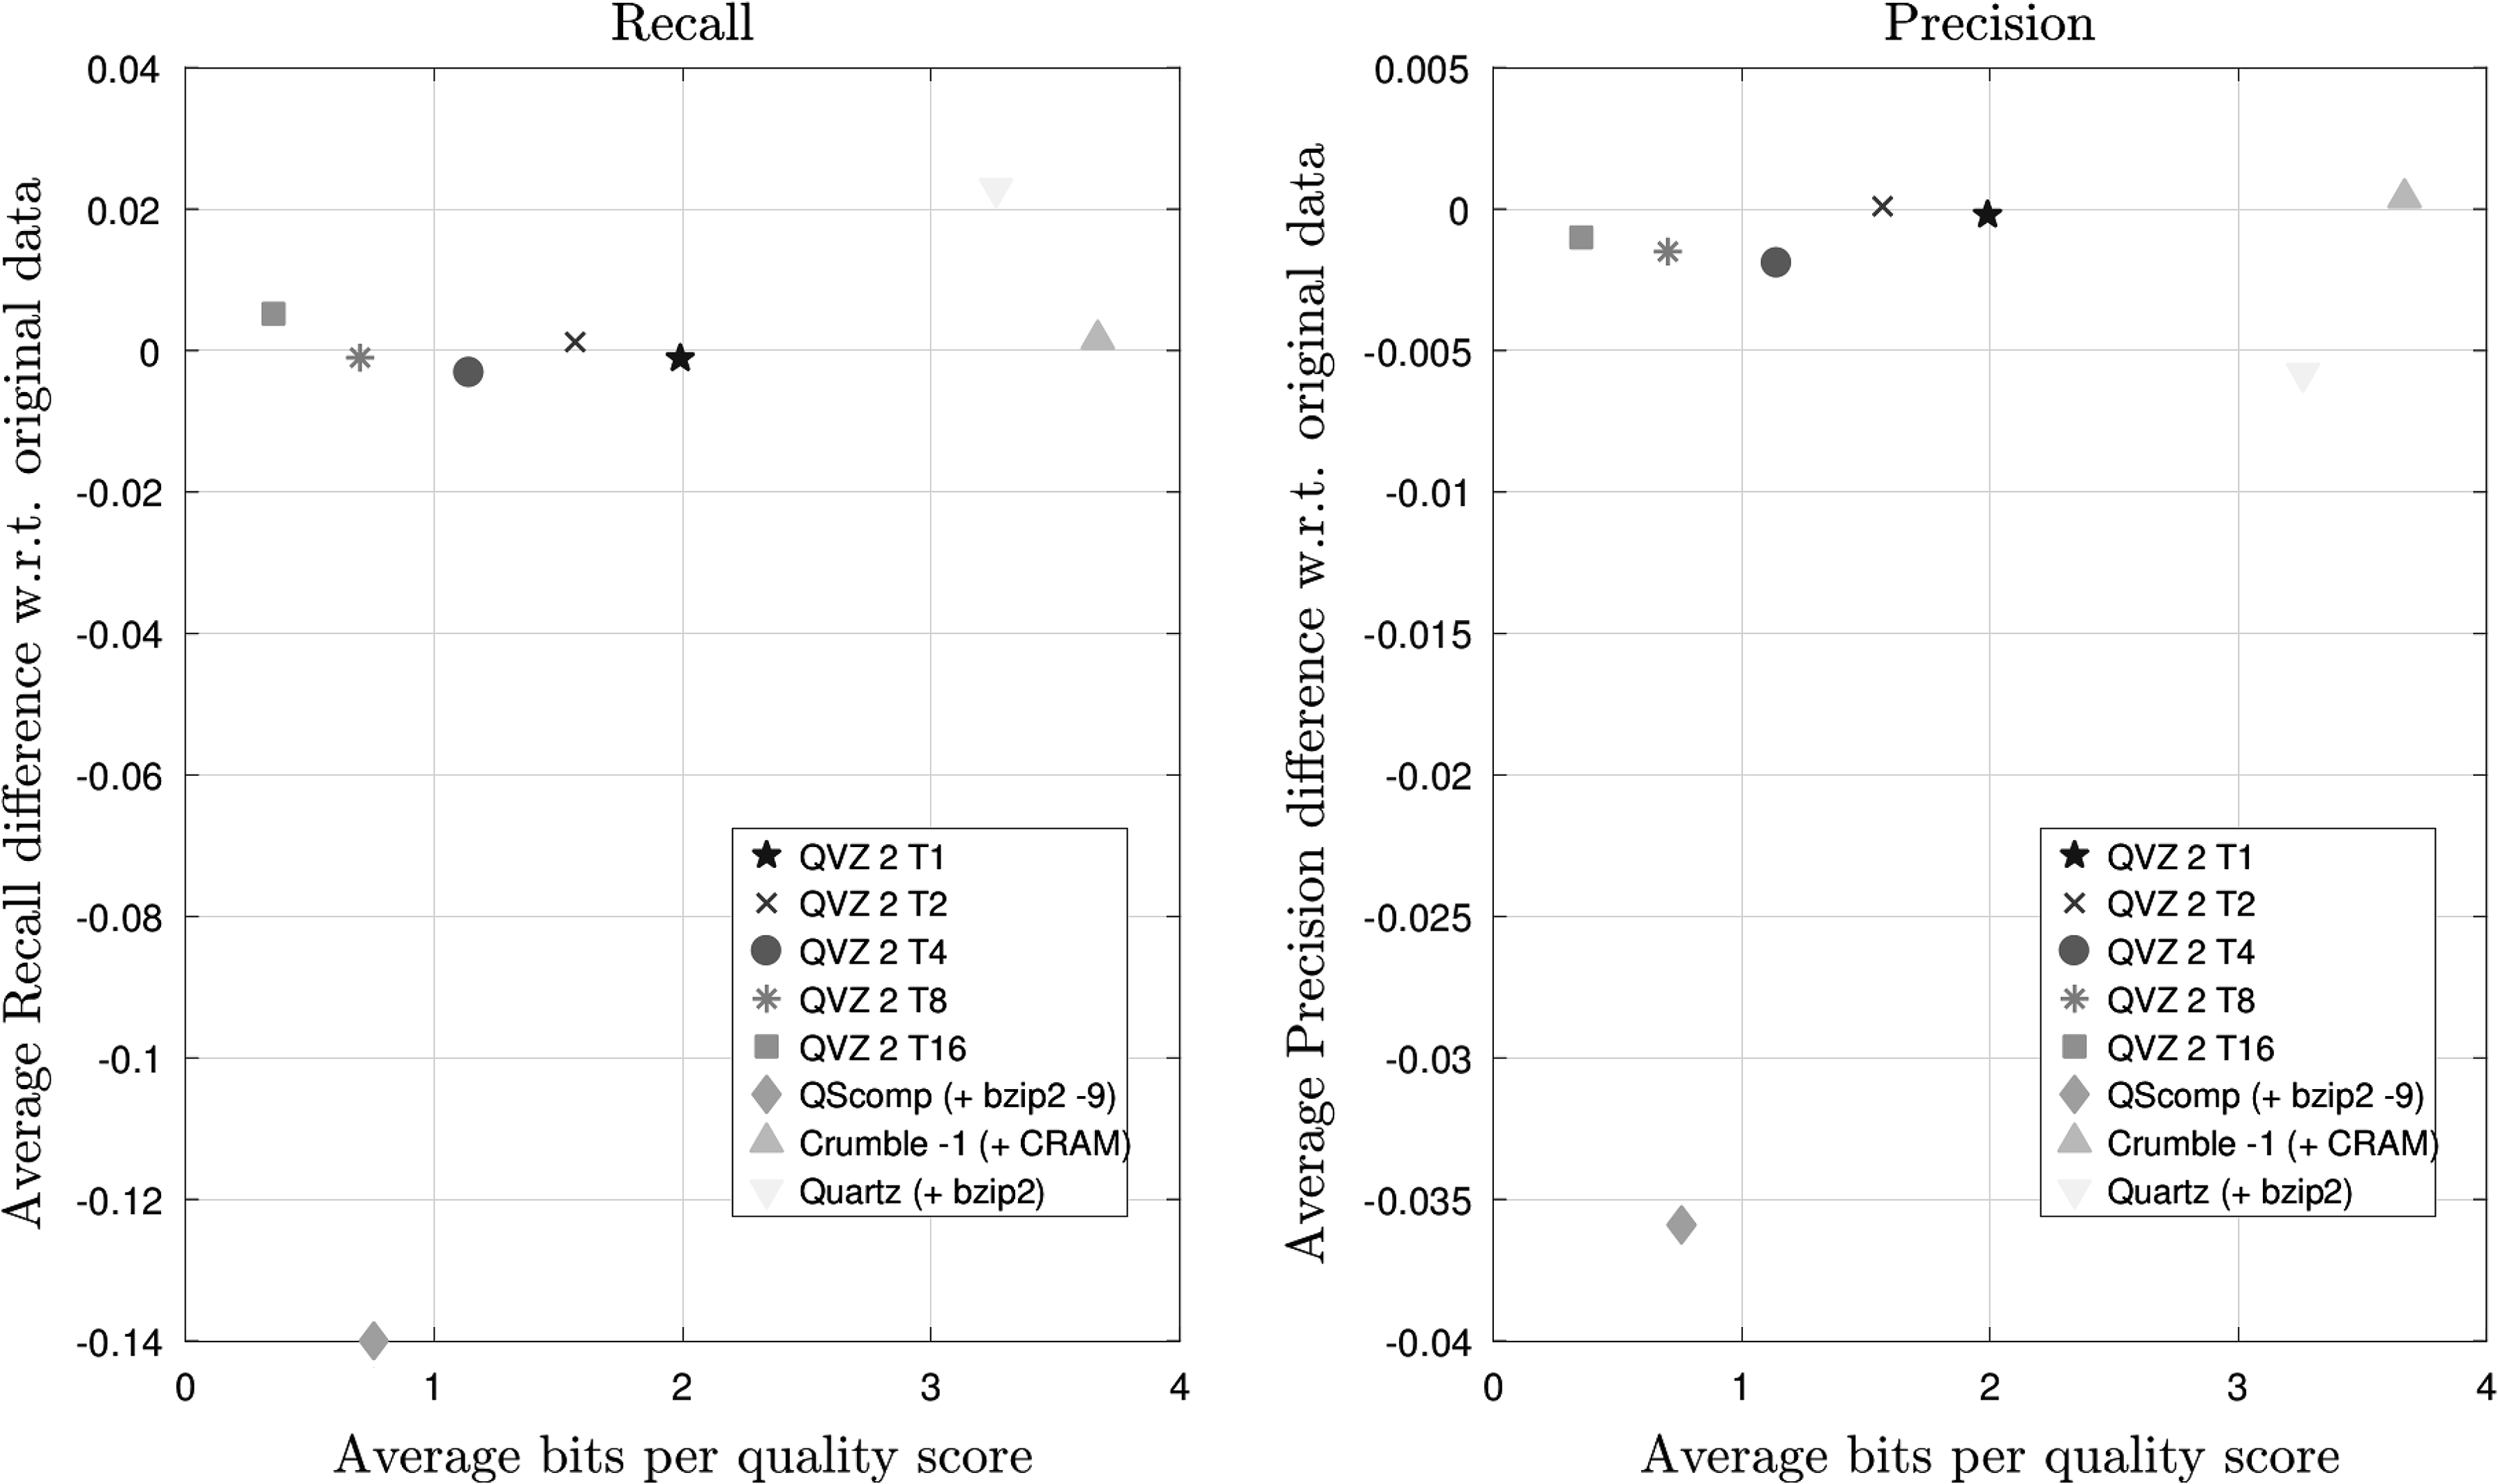
Recall and Precision results averaged over both chromosomes (11 and 20) and all four VQSR filter values for the Ion Torrent data set (SRR1238539) with a coverage of 10 × .
Finally, we used the first replicate of the sample data set generated by the Garvan Institute from the Coriell Cell Repository NA12878 reference cell line. These data were sequenced on a single lane of an Illumina HiSeq X machine. The coverage of this data set is 49 × . These results are shown in Figure 7. In terms of Recall and Precision, QScomp exhibits a similar performance as for the data set ERR174323, which is shown in Figure 5. Again, the Precision is retained. However, for this data set, a better Recall can be observed for all tools, including QScomp. Due to the high coverage of this data set, the competing tools are able to spend less bits per quality score than QScomp. Nevertheless, QScomp compresses the quality scores down to 0.55 bits per quality score, yielding a compression factor of 5.9 with respect to the entropy of the uncompressed data.
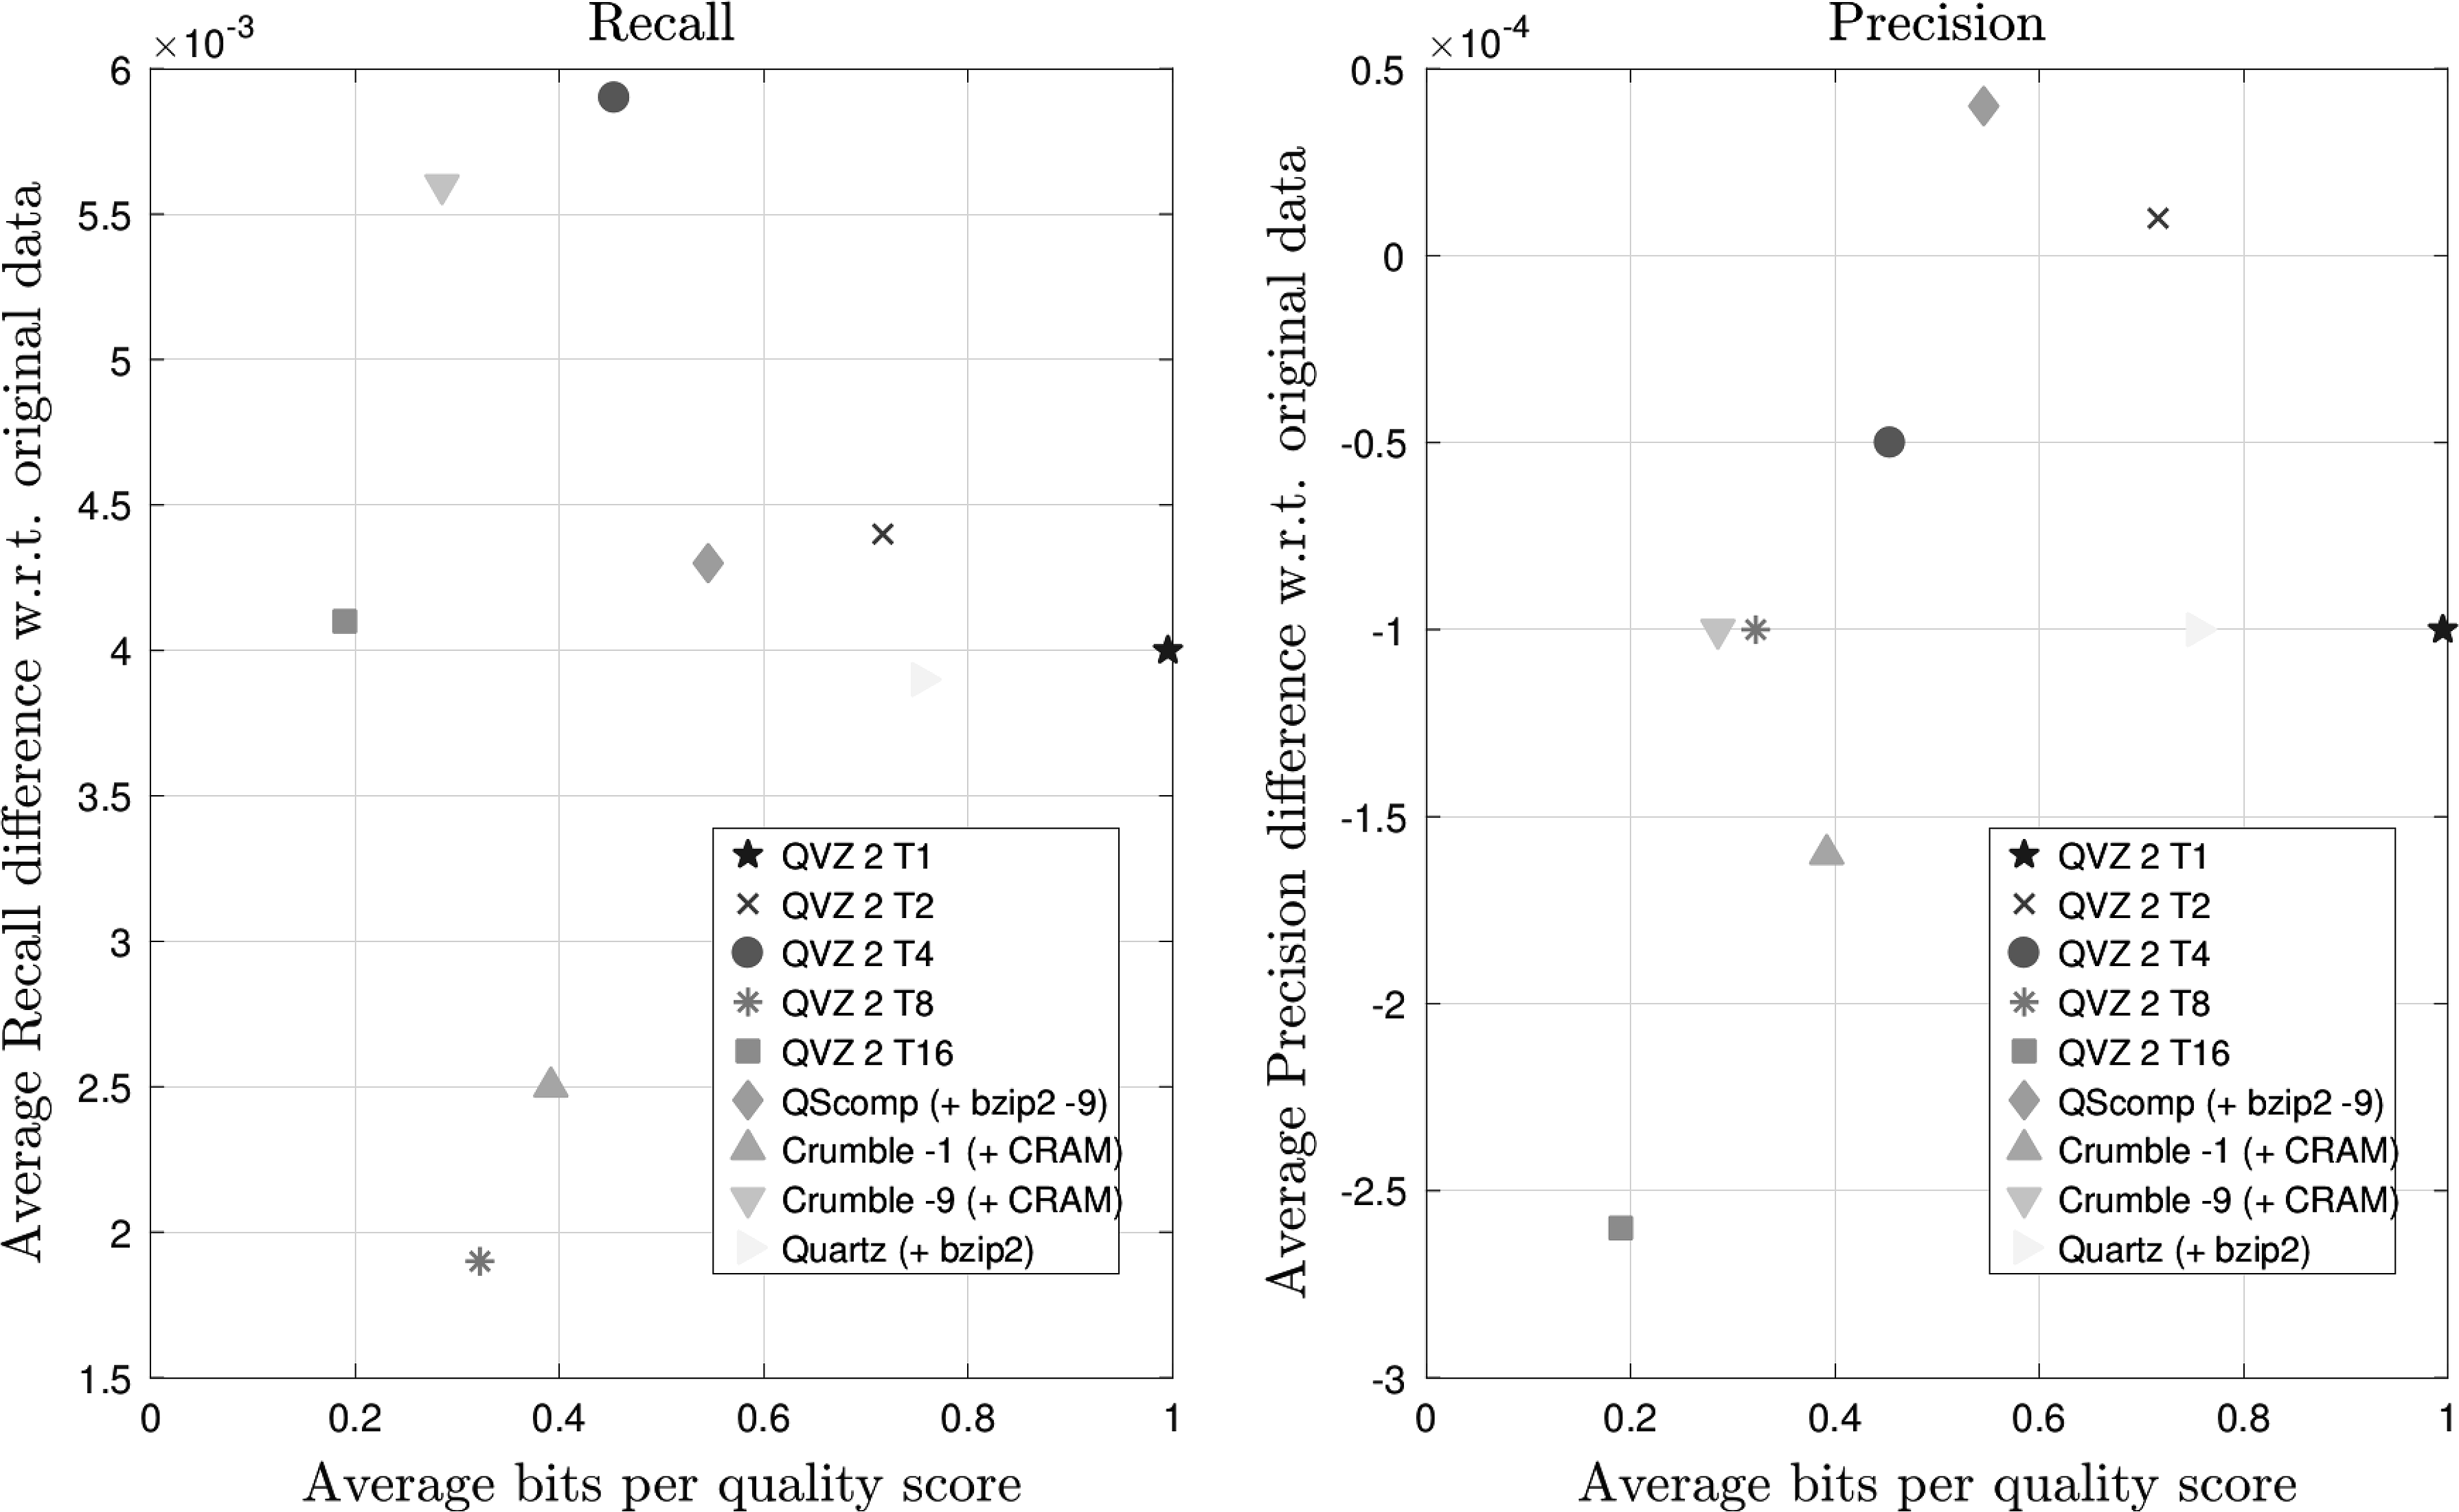
Recall and Precision results averaged over both chromosomes (11 and 20) and all four VQSR filter values for the Illumina HiSeq X data set (Garvan replicate) with a coverage of 49 × .
5. Conclusions
We presented a hierarchical quality score compression scheme, which represents the quality scores in two levels. The first level maps each quality score to its nearest square integer, and the second level encodes the distance of the original quality score to its mapped value. The impact of the lossy representation of quality scores on downstream analyses was investigated using three different variant calling pipelines. For data produced by Illumina sequencing machines, the downstream analysis results are competitive to the results obtained with competing lossy quality score compressors. Here, the Precision is retained, while a slight drop in Recall was observed. When this lossy level is accompanied by the second level, we observe that the compression ratio is around the entropy of the original quality scores. This shows that the suggested method to represent each quality score by a tuple does not have a negative effect on the lossless compression ratio performance.
What is more, we showed that the proposed separate compression of multiple second-level streams is superior to the compression of the second level as a single stream. Hence, the incorporation of other quantization strategies from previous works into the proposed two-level scheme might be a reasonable future research avenue. Besides the compression ratios, the memory consumption and the running times are also important parameters. In this study, with an average of only approximately 3.4 MB, QScomp shows a significant reduction in peak memory usage, and achieved the highest speed in the benchmark.
Previous studies on quality score compression proposed solutions that are either lossless or lossy. Thus, if a user prefers lossy compression, the possibility to extract the original quality scores disappears, and in the reverse case, the user loses the capability to work with lossy quality scores to reduce the necessary computing resources. The QScomp scheme introduced in this study is unique in terms of providing lossless and lossy compression in a single framework by utilizing a hierarchical two-level representation.
In daily practice, we suggest to replace the quality scores in FASTQ files with the proposed first-level values, and to perform initial explorations with this lightweight presentation. The second-level values could for example be stored in an archive, and when deeper investigations are required, the original quality scores could be retrieved.
Footnotes
Acknowledgment
This work has been partially supported by The Scientific and Technological Research Council of Turkey, grant number TÜBİTAK—114E293.
Author Disclosure Statement
The authors declare that no competing financial interests exist.
References
Supplementary Material
Please find the following supplemental material available below.
For Open Access articles published under a Creative Commons License, all supplemental material carries the same license as the article it is associated with.
For non-Open Access articles published, all supplemental material carries a non-exclusive license, and permission requests for re-use of supplemental material or any part of supplemental material shall be sent directly to the copyright owner as specified in the copyright notice associated with the article.