
Abstract
Abstract
DNA methylation (DNAm) is one of the most important epigenetic event effecting gene expression, and aberrant DNAm has been implicated in the initiation and progression of human cancers. To identify methylation (ME) signature genes for the pathogenesis of lung squamous cell carcinoma (LUSC), the pattern recognition method was used to analyze the genome-wide gene ME data, which were collected from the LUSC normal and cancer stage I samples in The Cancer Genome Atlas project database. A total of 102 ME signature genes were identified by means of a combination of statistical methods such as correlation, analysis of variance, and Elastic Net. The accuracy and specificity are all above 99%, sensitivity is 100%, and Matthews correlation coefficient is higher than 0.99 through the machine learning method modeling, which are higher than the previous study. The Kyoto Encyclopedia of Genes and Genomes pathway analysis and Gene Ontology enrichment analysis indicated the highly related relationship among these genes. They also indicated the immediate relationship between our signature genes and the occurrence of LUSC, which is very important to the understanding of its mechanism and to the development of new targeted therapy.
1. Introduction
A
As one of the vital epigenetic mechanisms, DNA methylation (DNAm) plays a key role in genome stability, chromatin structure, and maintenance of pluripotency in normal somatic cells (Carvalho et al., 2010; Meissner, 2010). Methylation (ME)-profiling techniques have confirmed the existence of widespread aberrations of DNAm in human cancer genome (Momparler and Bovenzi, 2000). Studies of DNAm have suggested that aberrant DNAm plays an important role in the occurrence and development of human diseases such as malignant tumors, autoimmune diseases, and metabolic diseases (Kalari and Pfeifer, 2010). In particular, variations in DNAm accompany the early stages of human carcinogenesis and the process has the reversibility of the drug (Yoo and Jones, 2006; Wang et al., 2016). As numerous antioncogene ME has been discovered, it is gradually recognized that the nongenetic modification of this DNA sequence plays an important role in the early diagnosis of cancer.
To develop new drugs and to identify DNAm biomarkers related to particular cancer for diagnosis and prognosis, high-throughput DNAm microarrays are recently used to study the relationships between DNAm and diseases, such as cancer. However, the ultrahigh-dimensional, high-noise, and small sample features of microarray data make a few important genes easy to be submerged in the noise of tens of thousands of genome-wide genes. Therefore, there is a substantial interest in reducing the dimension. Numerous studies have focused on discovering ME signature genes whose DNAm potentially plays a key role in cancer classification. Wang et al. (2016) extracted 48 smoking-related ME signature genes based on 127 lung adenocarcinoma samples downloaded from The Cancer Genome Atlas project (TCGA) database, which can distinguish between smoking and nonsmoking samples of lung adenocarcinoma (accuracy 87.5%). Zhang et al. (2016) identified 70 genes related to the progression of LUSC and they exhibit an ideal classification power with an accuracy of 90.92%. Cai et al. (2015) obtained 16 DNAm markers simultaneously distinguishing lung adenocarcinoma (LADC), squamous cell lung cancer (SQCLC), as well as large cell lung with an accuracy of 86.54%.
There is little information available in the literature on the early occurrence of lung cancer. In this study, we analyzed the early occurrence of LUSC based on the LUSC genome-wide ME data. Concentrating on ME signature genes, closely related to LUSC early occurrence, we collected LUSC normal and stage I samples in the TCGA database to identify ME signature genes by means of advanced bioinformatics technology and established a predictive model for early diagnosis. Signature genes analysis reveals the similarities and differences in gene ME level between normal and stage I, and provides a theoretical basis for further explaining the early pathogenesis of LUSC.
2. Methods
2.1. Data and pretreatment
2.1.1. Methylation data
LUSC ME data used in this article were downloaded from the public database of TCGA (https://tcgadata.nci.nih.gov/tcga/tcga Home2.jsp) at level 3. The data collected through the Illumina Infinium Human Methylation 450 platform as the training set and the data generated used the Illumina Infinium Human Methylation 27 platform as the independent test set.
Normal and stage I are based on the patient's clinical information provided by TCGA, of which stage I patients ignore the subclass (IA and IB are considered as a stage I sample). Using Python language, we integrate ME data and clinical information and screen out the normal and stage I samples. Finally, 214 training samples and 101 test samples were obtained.
We used the mean value of beta of all probes located in the gene promoter region (TSS200) as the ME level of the gene. To improve the accuracy of the classification results and the speed of model training, LUSC ME profile data were preliminarily filtered before character gene analysis to delete the genes with a value of “NA” (Not available) in all samples. Finally 22,794 genes were obtained in the training data and 7184 genes in the test data.
2.1.2. Expression data
The TCGA RNASeq data (level 3) generated from IlluminaHiSeq_RNASeqV2 platform were downloaded from TCGA data portal (https://tcga-data.nci.nih.gov/tcga). We screened out the normal and stage I samples. We obtain the expression data in which the expression of genes is quantitated with RSEM (RNA-seq by Expectation Maximization) and normalized by upper quartile normalization.
2.2. Signature genes selection
Our study belongs to the binary classification problem, which is one of the major problems in the field of machine learning. Ultrahigh-dimensional, high-noise, and small sample features of microarray data are other challenges to pattern recognition classification based on machine learning algorithms. A small number of important genes information are easily submerged in the genome of tens of thousands of gene noise caused by the phenomenon of saturation of information, further increasing the difficulty of identifying of the signature genes.
To overcome the impact of these unfavorable factors, a multiselection method was comprehensively applied to analyze the LUSC ME data.
Methods are as follows:
Correlation filter (Wang et al., 2016; Zhang et al., 2016). Numerous studies have shown that DNAm can cause chromatin structural instability in tumor cells and regulate the transcription and expression of genes through the binding of methyl-DNA binding proteins (MBD) and CpG sites (Fatemi and Wade, 2006). Therefore, ME that can affect the gene expression level has a more significant biological significance and plays a more crucial role in the occurrence of cancer. In this article, Pearson correlation coefficient (PCC) was used to describe the relationship between gene expression and gene ME level, and to screen the genes with significant correlation between ME level and gene expression level. The genes whose absolute value of correlation coefficient was higher than 0.5 were retained as the first part of the candidate gene set. Significant difference genes selection using analysis of variance (ANOVA). First, to improve the efficiency of ANOVA, we selected the genes with significant correlation between the ME level and the category labels (Spearman correlation coefficient >0.5). Then, we used ANOVA to analyze the degree of genes ME differences between the two types of samples, and homogeneity tests must be done before the ANOVA. For candidate genes that meet the homogeneity of variance, ANOVA was used to select the signature genes and retain significant difference genes [p < 0.05, false discovery rate (FDR) <0.01], genes that do not meet the homogeneity of variance, Kruskal–Wallis was used to screen signature genes and retain significant difference genes (p < 0.05, FDR <0.01). Significant difference genes were selected using ANOVA as the second part of the candidate gene set. Elastic Net filter (Hui and Hastie, 2005). The mentioned steps are univariate analysis methods, which are unable to overcome the impact of noise and variable correlation, therefore, are only suitable for preliminary selection of genetic variables. Elastic Net can decrease the coefficients of independent variables that contribute less to the classification to zero, so as to eliminate the influence of noise. Meanwhile, when there is a strong collinearity between the features, Elastic Net can mark all the variables and form a specific gene combination as the characteristic gene, which is crucial to the analysis of biomolecules data. Therefore, the candidate genes collected in the previous two steps were pooled and finally selected by Elastic Net (α = 0.5).
All the screening processes are completed by the Python language. Figure 1 shows flow chart of signature genes identification for LUSC occurrence.

Flow chart of signature genes identification for lung adenocarcinoma tumor occurrence. ANOVA, analysis of variance; GO, Gene Ontology; KEGG, Kyoto Encyclopedia of Genes and Genomes.
2.3. Model and evaluation
To overcome the imbalance of the data, the same number (42) of two types of samples is selected randomly for the training set, and the same number (27) of two types of samples is randomly selected for the test set as well. The model predictions were performed 20 times with a support vector machine (SVM). The accuracy (ACC), sensitivity (SEN), specificity (SPE), and Matthews correlation coefficient (MCC) are used to evaluate the classification results of the model and the results of these are the average of 20 operations. At the same time, we optimized the model by sixfold cross-validation. ACC, SEN, SPE, and MCC are defined as follows:
In our study, the positive samples are normal samples and the negative samples are cancer stage I samples. True positive indicates the number of correctly classified cancer samples, false positive indicates that the adjacent cancer samples are misjudged to be the number of stage I samples; true negative indicates the number of correctly classified samples of stage I, false negative indicates that the stage I sample was misjudged as the number of adjacent samples.
3. Results
3.1. Pattern recognition results
The aim of this study is to identify the ME characteristic genes that are crucial for the pathogenesis of LUSC, which lays the foundation for further revealing the mechanism of the occurrence of LUSC and provides a theoretical support for prevention and early diagnosis of LUSC. For this reason, the identified ME signature genes must have a sufficiently high classification ability and the corresponding pattern recognition model must have a sufficiently high classification accuracy. That is, using only the ME level corresponding to the ME signature gene, the samples can be divided into normal and stage I. In this study, by identifying 22,794 genes, we obtained 102 ME signature genes and the corresponding pattern recognition results are given in Table 1.
ACC, accuracy; MCC, Matthews correlation coefficient; SEN, sensitivity; SPE, specificity.
As given in Table 1, the characteristic genes screened by this method have recognition accuracy higher than 99% and MCC of 0.99, which indicates that the characteristic genes have good distinguishing ability to normal and cancer samples, and also shows the effectiveness and reliability of our method.
According to the ranking of the contribution rate of genes to the pattern recognition classification, the top-ranked genes are selected as signature genes. The number of the features increased from 1 to 102 and the accuracy of signature genes was calculated, respectively. Figure 2 shows the relationship between ACC and size of signature genes set.
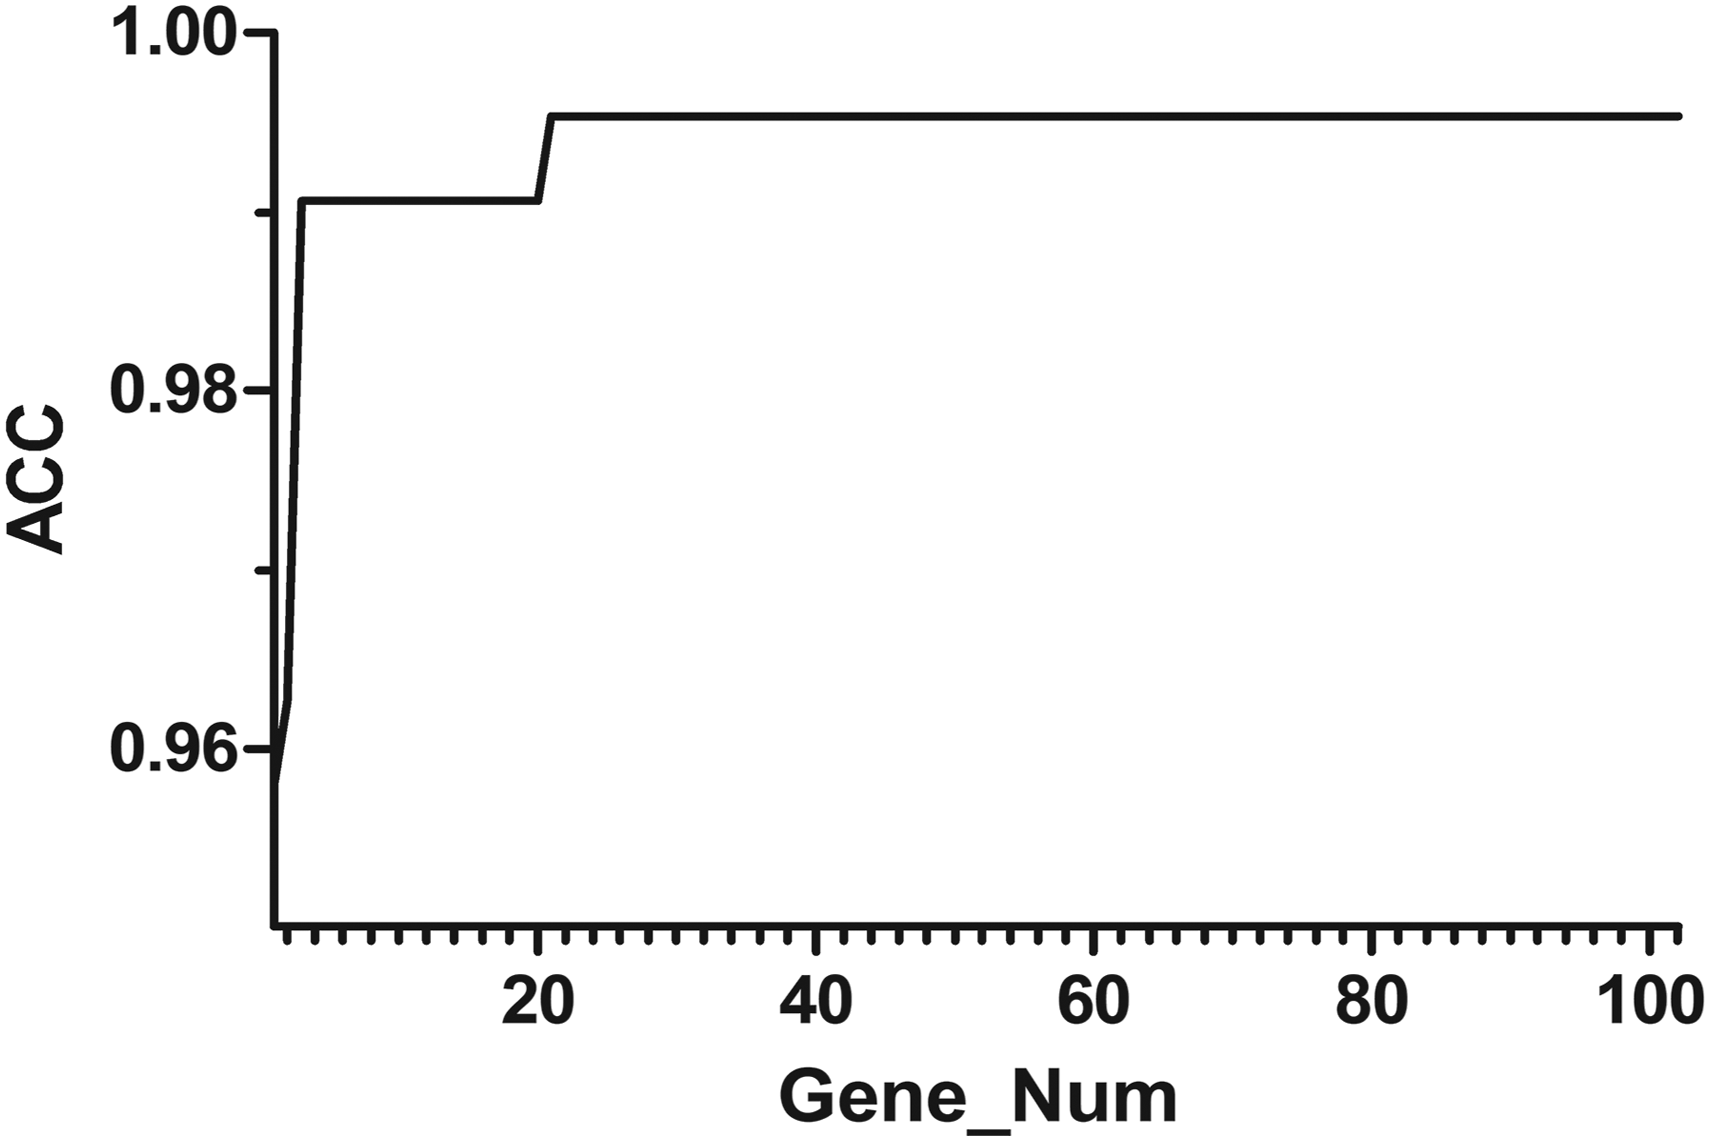
Relationship between ACC and size of signature genes set. ACC, accuracy.
As shown in Figure 2, the pattern recognition of LUSC had highest accuracy when the number of signature genes is 21. And when the number of signature genes is higher than this, the classification accuracy does not change, indicating that the size of the signature gene set has no significant effects on the classification accuracy.
3.2. Kyoto Encyclopedia of Genes and Genomes pathway analysis and Gene Ontology analysis
In this article, DAVID bioinformatics resource 6.8/NIAID function annotation tool was used to analyze the Kyoto Encyclopedia of Genes and Genomes (KEGG) pathway of the signature genes and Gene Ontology (GO) database was selected for functional annotation.
The results of KEGG analysis showed that there were significant correlations (p < 0.05) between 102 ME signature genes of LUSC occurrence and cytokine–cytokine receptor interaction pathway and olfactory transduction pathway. The specific information is given in Table 2. Cytokines and cytokine-interacting networks are thought to be key factors in inflammation and tumor immunology. Cytokines and their receptors can drive the activation of key oncogenic transcription factors and thus induce cancer (Dong et al., 2017). The mentioned study does not only show the important relationship between pathways and cancer but also illustrate the importance and reliability of the genes identified in this article.
The results of GO analysis showed that 102 LUSC ME signature genes significantly correlated (p < 0.05) with 16 gene functions of immune response, inflammatory reaction, chemokine-mediated signal transduction pathway, G protein-coupled receptor activity, CXC chemokine receptor activity, and so on. The function of these genes is significantly related to the induction of inflammation, the regulation of immune response, the generation of tumor microenvironment, the growth and proliferation of tumor cells, and the generation of tumor blood vessels, and plays an important role in the occurrence and development of malignant tumors.
4. Discussion
4.1. Robustness and universality
In addition, the independent test set was used to validate the robustness of the screening method to different data platforms. Using the gene set identified from the training set to match the test set data, test set obtained 16 genes due to the difference in the number of genes between training set and the test set. Table 3 gives the results of pattern recognition of training set and test set using the 16 common genes.
It can be seen from Table 3 that the indexes of pattern recognition using the 16 genes are all >0.98 and the differences of the indexes between training set and test set are all within 1%, which indicates the robustness of the characteristic genes recognized in this study to different platforms.
This method was also used to analyze the occurrence of lung adenocarcinoma, kidney renal clear cell carcinoma, colon adenocarcinoma, and breast cancer, and the number of cancer signature genes obtained was 95, 190, 25, and 80, respectively. The model predictions were performed 20 times with an SVM using these characteristic genes after equalizing the samples. The results of the pattern recognition are given in Table 4.
BRCA, breast cancer; COAD, colon adenocarcinoma; KIRC, kidney renal clear cell carcinoma; LUAD, lung adenocarcinoma.
As given in Table 4, the accuracy of this screening method in other cancers is >98%, and the remaining indicators are all >97%, indicating that the method of the present invention has a very high recognition rate for cancer and good universality.
4.2. Signature genes analysis
In recent years, a number of studies have confirmed that 9 of the 102 ME signature genes obtained in this study are associated with the occurrence of LUSC. Figure 3 shows the ME of the nine genes in normal and stage I samples. It can be seen that the ME level of superoxide dismutase 3 (SOD3) and C-X-C motif chemokine ligand 10 (CXCL10) in stage I increased, the ME of C-X-C motif chemokine receptor 5 (CXCR5), C-X-C motif chemokine receptor 6 (CXCR6), tumor necrosis factor [TNF] receptor superfamily member 13B (TNFRSF13B), MIR13B, MAGEC2, and cytotoxic T-lymphocyte associated protein 4 (CTLA4) decreased, and cell death-inducing DFFA-like effector b (CIDEB) showed no significant difference (p > 0.05) between normal and stage I samples, but its contribution rate of pattern recognition ranked 23rd, and from the functional analysis, its ME level was crucial for the occurrence of cancer, which proves the necessity and superiority of the various screening methods used in this article.
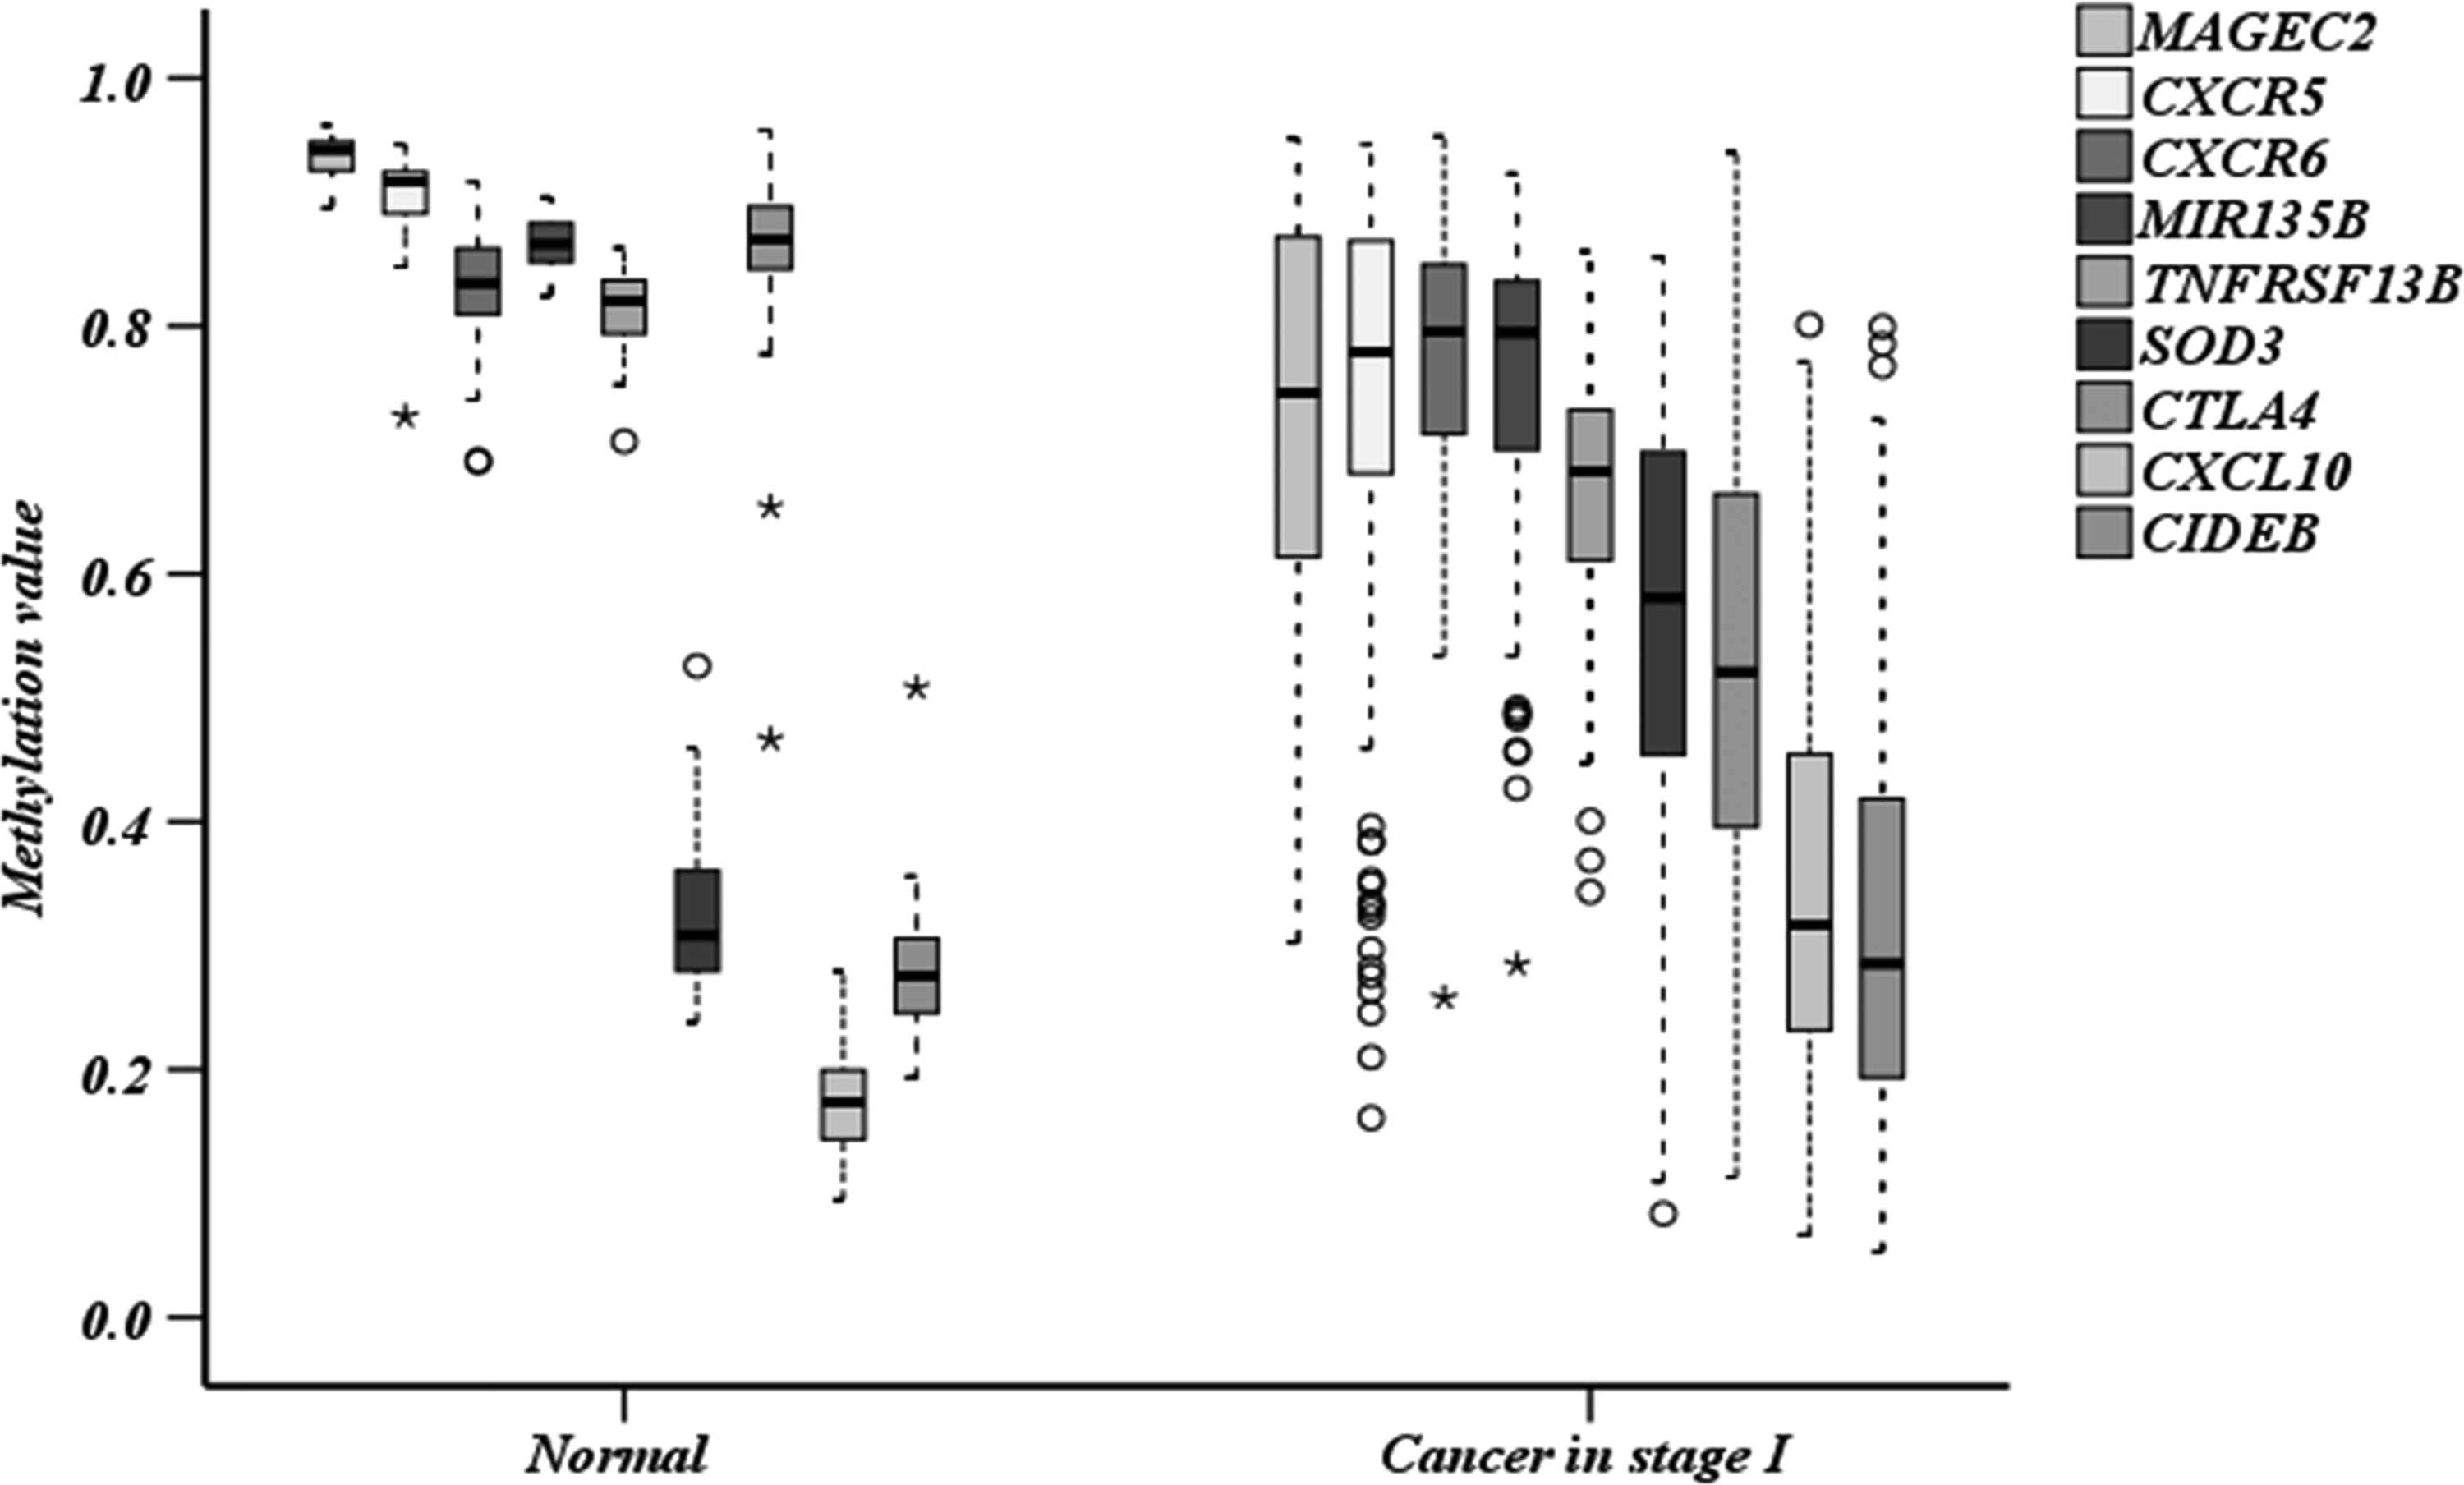
Box chart of methylation levels in normal tissue and stage I. Legends are arranged in the order of genes in the figure; asterisks represent extreme values; circles represent discrete values.
Among the nine genes, the correlations of CXCR5 and TNFRS135B with the corresponding gene expression levels were 0.32 and −0.61, showing strong correlations. And the PCC of the remaining seven genes is less than −0.3, confirming that ME that has no direct effect on the expression level of its own genes may also affect other genes through metabolism or regulatory networks, and affect the entire cancer network.
All genes are as follows:
MIR135B. MiRNA can be used as a proto-oncogene or tumor suppressor gene and plays an important role in tumorigenesis and development. MIR135B (Lin et al., 2011) enhances invasion and metastasis of cancer cells by activating Hippo signaling pathway in invasive NSCLC. CIDEB. It belongs to the lipid metabolism-related genes; studies have shown that before the morphological changes of tumor cells, glucose glycolysis and fatty acid oxidation metabolism have been significantly higher than normal cells; Gottlieb (Gottlieb, 2017) predicts that energy metabolism abnormalities will become the seventh sign of cancer cells (Garber, 2006). Lipid metabolism-related genes may become potential markers of cancer diagnosis. SOD3. Extracellular SOD (EcSOD), encoded by the SOD3 gene, is highly expressed in the lung where it comprises the majority of SOD activity in airway epithelial and vascular cells. It has been reported that EcSOD expression is lost in the lung cancer cell line A549. EcSOD expression is highly correlated with SOD3 promoter ME, and EcSOD mRNA expression was significantly decreased, and the SOD3 promoter showed a significantly more methylated state in lung tumors (Fitzgerald et al., 2010). MAGEC2. This gene is a member of the MAGEC gene family. It is not expressed in normal tissues, except for testis, and is expressed in tumors of various histological types. Recent literature suggests a more important role for MAGEs in driving tumorigenesis (Weon and Potts, 2015). MAGEC2 is a target for immunotherapy and a potential prognostic marker in patients with NSCLC (Chen et al., 2017). CXCL10, also known as IP-10. This gene encodes a chemokine of the CXC subfamily and ligand for the receptor CXCR3. Chemokines are small proteins that control several tissue functions, including cell recruitment and activation under homeostatic and inflammatory conditions. With a wide range of biological functions, recent studies have demonstrated that chemokines and their receptors play an important role in tumorigenesis (Giuliani et al., 2006), development and tumor cell survival, proliferation, invasion, and metastasis. CXCR5 and CXCR6 belong to chemokine receptor genes. They promote the occurrence and development of tumors by combining with CXCL13 and CXCL16. CXCR5 and CXCL13 can promote the transition of the posterior venules into high endothelial venules before the occurrence of lung cancer, which causes lymphocyte homing to be active and the transfer ability of the correspondingly mediated malignant cells to increase (Zou et al., 2010). CXCL16 and CXCR6 may mark cancers arising in an inflammatory milieu and mediate protumorigenic effects of inflammation through direct effects on cancer cell growth and by inducing the migration and proliferation of tumor-associated leukocytes (Darashyahana et al., 2009). TNFRSF13B, also known as TACI. The protein encoded by this gene is a lymphocyte-specific member of the TNF receptor superfamily. This study reports the overexpression of APRIL, BCMA, and TACI in NSCLC samples and cell lines, and has identified that APRIL and its receptors, BCMA and TACI, may play roles in the biological processes of NSCLC tumors through the ERK1/2 signaling pathway (Dou et al., 2016). CTLA4. This gene is a member of the immunoglobulin superfamily and encodes a protein that transmits an inhibitory signal to T cells. Cytotoxic T lymphocyte-associated antigen-4 is a transmembrane protein, which can inhibit the proliferation and activation of T cells and downregulate the antitumor immune response in the early stage of tumorigenesis (Wakamatsu et al., 2013).
All the mentioned genes play key roles in LUSC occurrence and progression and provide a new reference index for the early diagnosis and targeted therapy of LUSC.
5. Conclusion
In this article, 102 ME signature genes of LUSC occurrence were identified by means of multiple screening methods, and the accuracy of pattern recognition was as high as 99%, and we get the optimal genes set including 21 genes; meanwhile, the genes were robust to different testing platforms. At the same time, the method in this article has obtained extremely high classification results in other cancers, indicating that this method has good universality. KEGG and GO analysis of characteristic genes showed signature genes with important significance for the occurrence of LUSC, which provided a new reference index for the early diagnosis and targeted therapy of LUSC.
Footnotes
Acknowledgments
The authors thank the National Natural Science Foundation of China (Grant No. 11572014) and Major Research Projects in The Field of Intelligent Manufacturing (Grant No. 01500054631751) for funding.
Author Disclosure Statement
The authors declare that no competing financial interests exist.