




Abstract
Abstract
Predicting the drug targets in the base of cancer cell line is one of the hottest issues in cancer treatment. Drug sensitivity describes which drug is perfect for cell line in certain condition or disease. This condition exists due to change in human metabolism. Different techniques are used for cancer treatment such as radiotherapy, hormone therapy, chemotherapy, and surgery. Many statistical methods and machine learning algorithms such as support vector machine, principal component analysis (PCA), logistic regression, simple linear regression, naive Bayes classifier, generalized linear regression, and random forest have been used for drug target prediction. However, these predictors take more time for computation using different tools such as MATLAB and R tool. In this study, different machine learning techniques are applied using Apache Spark to predict drug targets. Apache Spark uses the resilient distributed dataset (RDD) technique for in-memory fast computation and fault tolerance. The obtained results indicate that Spark provides better accuracy in short time when compared with existing tools.
1. Introduction
Over the past few years, importance of drug target interaction prediction is rapidly increasing as compared with the development of drug because drug development is an expensive and time-consuming procedure. Different techniques have been demonstrated for prediction of drug and chemotherapeutic response of cancer patients.
Chemotherapy is an organized treatment regimen in which one or more anticancer drugs are used to prevent further division and growth of cancer cells. Some therapies are available for the treatment of breast cancer and efforts have been made to predict the drug that is suitable for cancer cell line. Different techniques are used to predict the drugs on the bases of different data of human genome. Human cell lines are different for different people, so it is difficult to predict the most accurate drug for human. Therefore, knowledge of the relationship between drug sensitivity and gene expression is required to predict the most accurate drug for the right person that reduces the side effects of treatment. Different bioinformatics tools were developed for the identification of complex patterns and search the changes in cancer gene expression.
The main purpose of this study is to correctly predict the response of drug in breast cancer cell line. Different therapies are used to remove tumor, mostly anticancer drugs, surgery, and occasionally radiation. Drug sensitivity prediction and gene expression analysis are used to predict the best drug. Information of drug sensitivity and gene expression cell line is used to recognize the therapeutics for tumor. We use the molecular profile of gene expression data and predict the effect of drug.
In this study, we predict the chemosensitivity of given gene expression data for breast cancer cell line. We develop a model and reduce the predictor. We use Apache Spark and predictive algorithm to boost up computation speed. We calculate the drug sensitivity of an individual gene for a given drug.
From past few years, breast cancer is a leading factor of women's death in developing countries (Siegel et al., 2018). In the United States, almost 1,735,350 new cancer cases and 609,640 cancer deaths are reported. Different therapies have been designed for different types of tumors, which are more effective for individual patients (Urruticoechea et al., 2010). Different types of statistical techniques such as ensemble, nonlinear support vector machine (SVM), analysis of variance (ANOVA), and regression analysis have been used for prediction and these techniques are used on different types of data (e.g., sequencing data, gene expression, and proteomic) to predict the sensitivity of drug. Ensemble method technique has been used for different types of biological data (Hejase and Chan, 2010). In ensemble scheme, different data sets are joined such as gene expression, proteomic, RNA sequence data, DNA methylation, and DNA copy number. Then a single type of data is compared with different types of data to predict the sensitivity of drug.
For comparison of models, 35 training and 18 testing cancer cell lines were used in this study. National Cancer Institute with the collaboration of Dialogue on Reverse Engineering Assessment and Method (NCI-DREAM) measures the response of drug for breast cancer cell lines. Gene expression microarray data and different models have been used to describe the results of data set (Chang et al., 2003; Costello et al., 2014). A famous technique was used to build the genomic predictor for drug response on cancer cell line. In this study, a large number of methods were based on gene expression profile (Barretina et al., 2012). To further enhance and clarify the existing techniques by using multistep algorithm, regression models of drug response were developed using classifier random forest. An ensemble approach based on regression and classification using data of 19 breast cancer cell lines was used to calculate the response of drug (Riddick et al., 2011). Another classifier network base interface (NBI) is used to predict drug response. NBI has used four standard data sets and five drugs to calculate the receiver operating characteristic (ROC) and IC50 values of given drugs (Cheng et al., 2012).
Logistic regression was used to calculate the ROC curve values and predict the sensitivity of erlotinib drug with the help of MATLAB tool, implemented in R language (Geeleher et al., 2014). Genomic sequence of DNA provides complete understanding about genomic change that provides help to understand the cell line. An elastic net has been used to calculate the sensitivity and IC50 values of given drugs according to cancer cell line data (Yang et al., 2013). Using this method, correlation with resistance between different gene expression and drugs for this purpose was calculated with the help of Tableau tool. This tool provides interface to calculate the effectiveness of drug sensitivity for cancer cell line and calculates the IC50 and EC50 values. It has been found that NQO1 gene expression corresponds with 17-AGG wherein NQO1 gene expression is negatively correlated with EC50 values. Results show that 17-AGG performs better when NQO1 expression value is high (Qin et al., 2017). In another study, biological knowledge of different molecular pathways combination has been used for prediction of a different drug. Statistical analysis was performed on gene expression by using R tool. PCA was applied to reduce the data size and convert the correlated variable into uncorrelated variable. After conversion of variable, ANOVA was performed to determine the most significant gene expression in breast cancer cell line. Finally, DG matrix was used to calculate the drug–gene sensitivity (Zhang et al., 2017).
Owing to the increasing data size in bioinformatics, more computation power is required, and data storage has become a challenge. To overcome this problem, big data tools such as Apache Hadoop can be used. Apache Hadoop performs parallel computation on data using map-reduce strategy. A study has demonstrated the use of SVM and naive Bayes to accurately predict the different effective combination of drug on cancer cell line with parallel computation (Sun et al., 2014).
Apache Hadoop requires input for reloading data in each iteration. This problem is overcome by Apache Spark. It uses in-memory computation. It is a relatively new technology and only few publications are available on using the data set of bioinformatics and applying machine learning algorithms (Lin et al., 2014).
2. Methodology
We divide this section into four subsequent subsections, in which we explain our proposed method, working on Apache Spark, data acquisition, and conversion that is appropriate for Apache Spark.
2.1. Data selection
From past few years, big data is hot area of research. We chose data for bioinformatics because data of bioinformatics are growing day by day. We chose data from gene expression in breast cancer cell line. Data are publicly available in repository Gene Expression Omnibus. We chose data GSE51086 in which there are 29 untreated breast cancer cell lines. These data contained 14 luminal, 8 basal “A,” and 4 basal “B,” and remaining cell lines are unknown. The data set contained 45,220 DNA probe sets and is summarized by 19,723 gene symbols. In our study, we have used two drugs anthracyclines and doxorubicin. Summary of data set is explained in Table 1.
Summary of data Set
A heat map of the selected data is presented in Figure 1. Green boxes represent strong correlation of data and separate data into groups. Red boxes represent low correlation values, whereas black boxes represent intermediate correlation values.
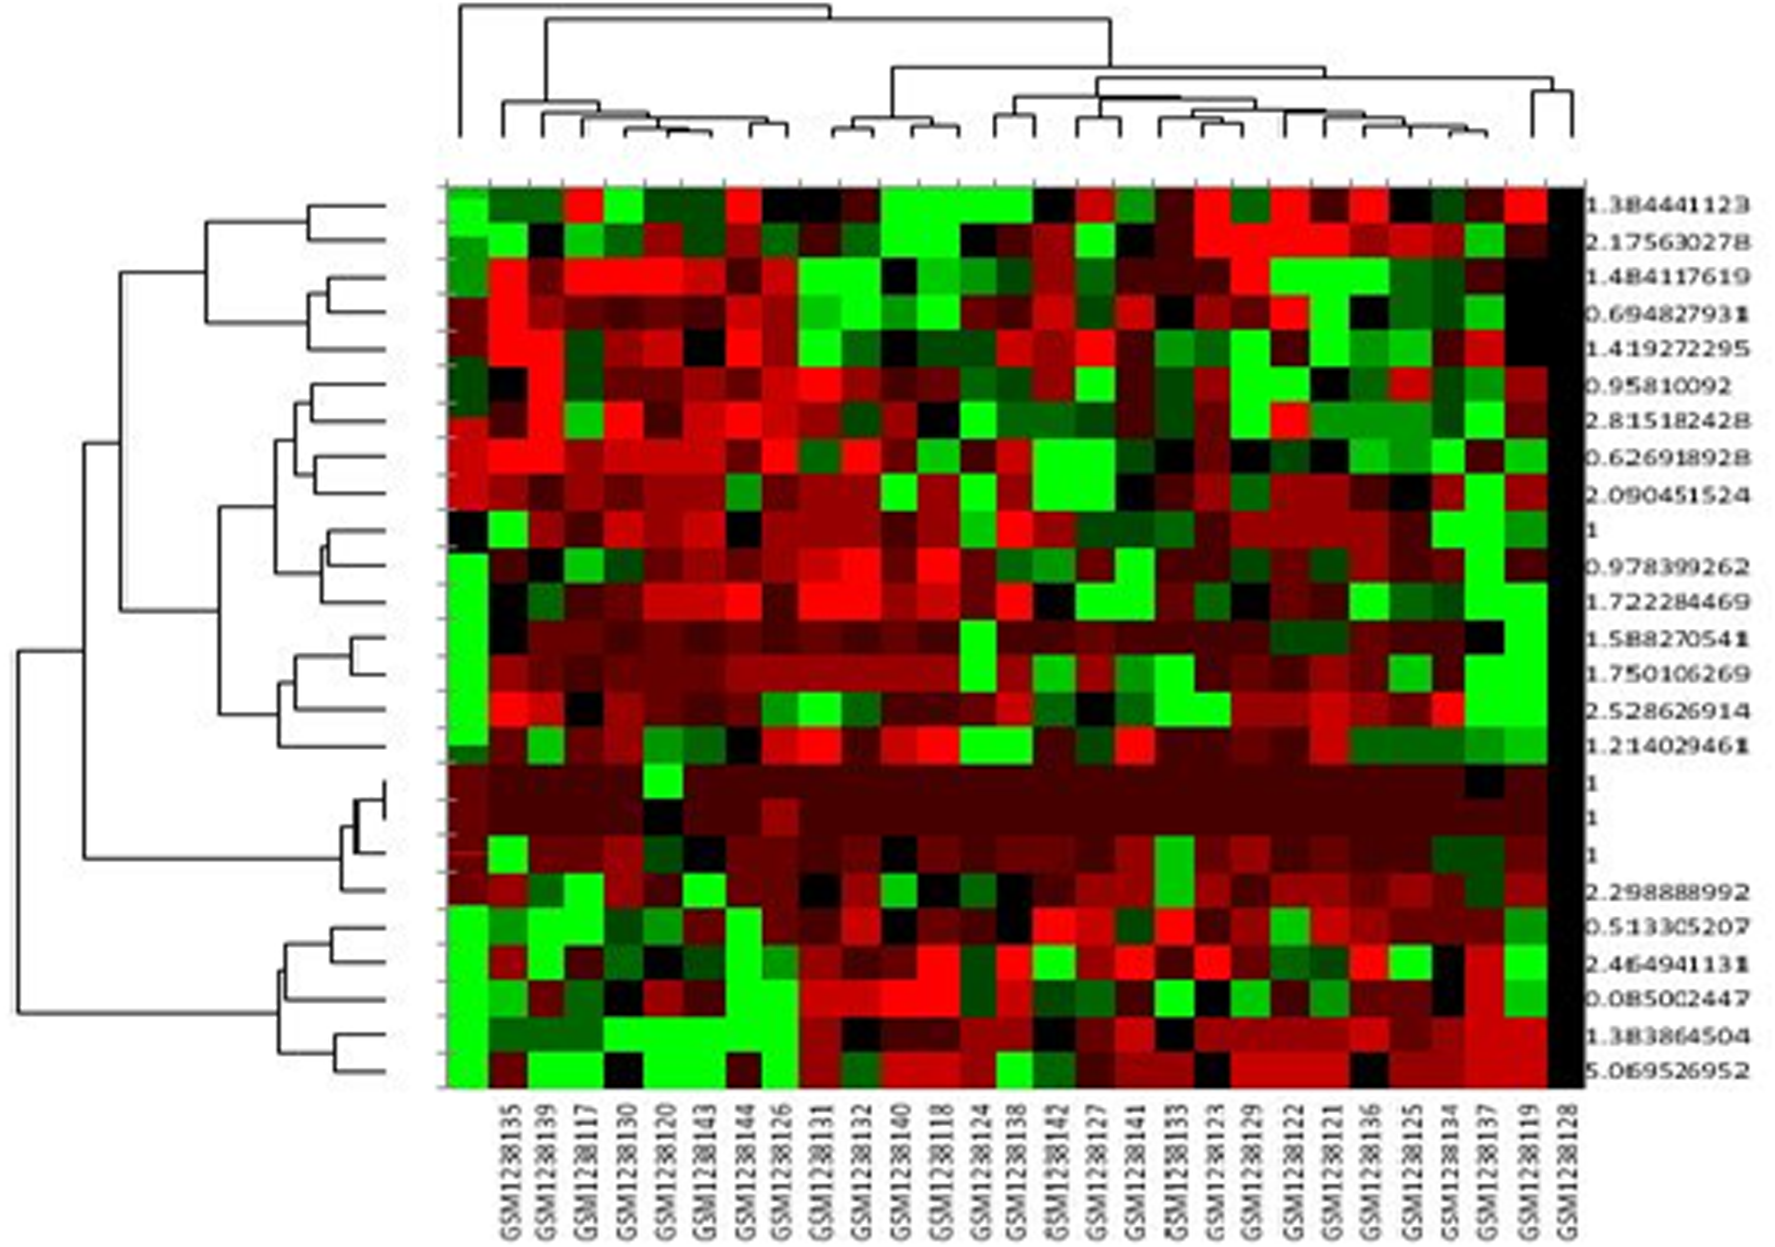
Heat map of experimental data.
2.2. Data conversion
First, we convert the data set in an appropriate format because Apache Spark (machine learning algorithm) uses input data set in LIBSVM format. We have converted the data set in LIBSVM format with the help of R studio and R language (Seefeld and Linder, 2007). We loaded our data set in R studio and defined the number of parameters and labels. Then, we converted this data set into LIBSVM format by using library of R language (e1071) and (SparseM).
2.3. Apache Spark
In this study, we have used the framework of Apache Spark for our implementation. Apache Spark is relatively a new technology as compared with other big data tools. Apache Spark provides large-scale processing and analytics facility. Apache Spark uses the resilient distributed dataset (RDD) technique and provides in-memory cluster computing. RDD is the core of Apache Spark framework. Apache Spark stores data in RDD and provides help for rearranging the data. RDD provides two types of operation: transformation and action. Apache Spark can be deployed locally (Harnie et al., 2017). Apache Spark provides support for different languages such as Java, Python, R, and Scala. We have implemented our solution in Scala. Scala has provided the functionality of object-oriented and functional-oriented approach for developing an application. Our proposed method was implemented using Spark-2.0.0-bin-Hadoop 2.7 and Scala SDK-4.5.0. We have used Window operating system core i7.
Figure 2 gives an understanding of machine learning application programming interface (API) and working scenario of Apache Spark. Different worker nodes are connected to perform computation. Apache Spark provides different API support such as SQL, machine learning libraries, streaming, and graph.
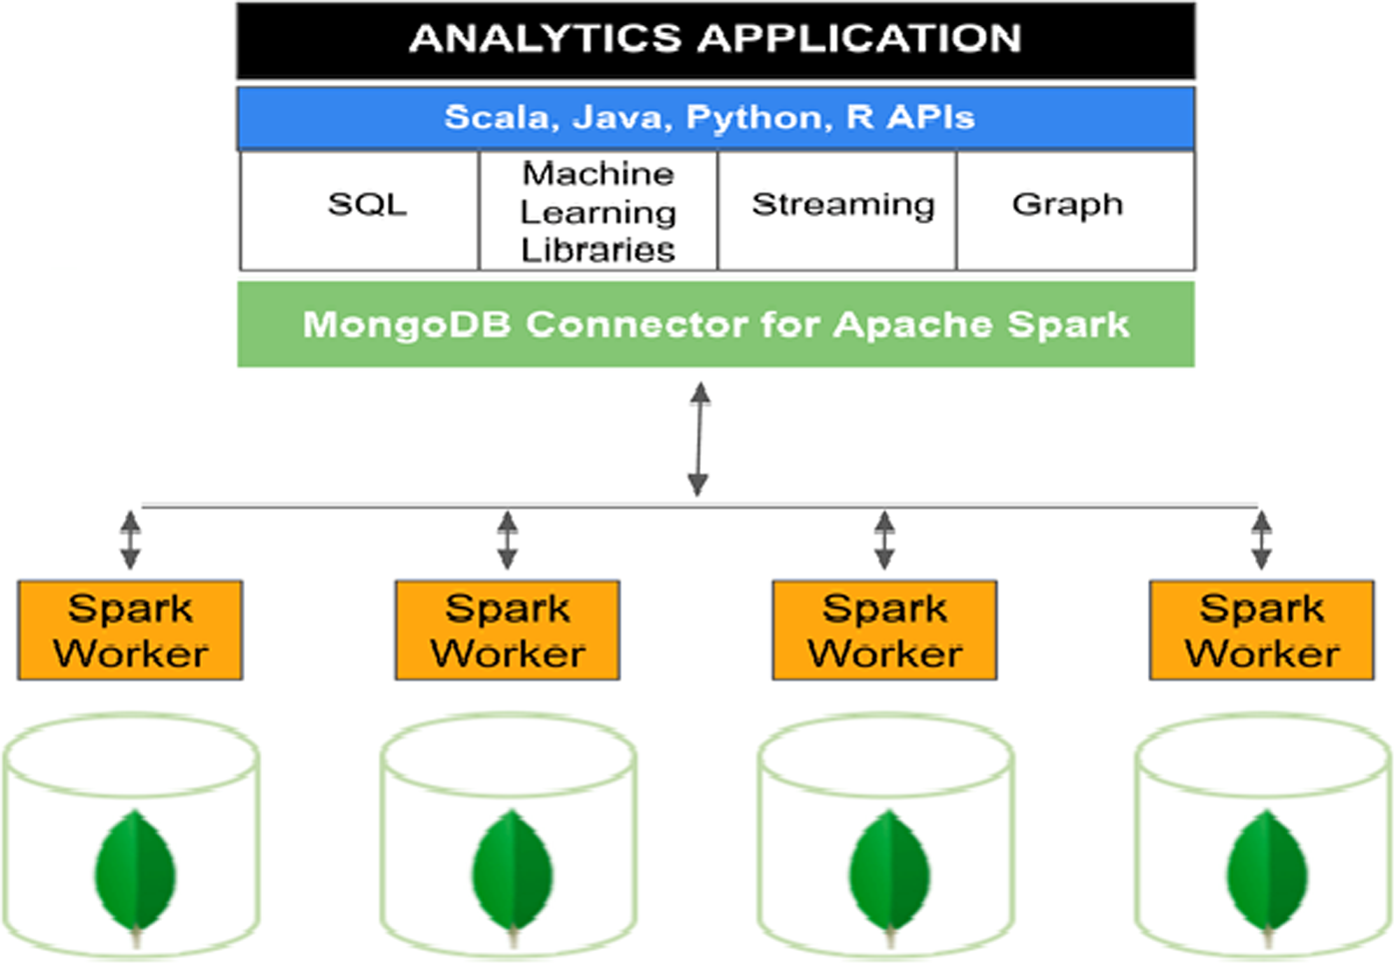
Architecture of Apache Spark.
2.4. Algorithms used
In this study, we used different algorithm and gene expression data for prediction and calculation of drug sensitivity, respectively. We have used logistic linear regression, naive Bayes, and generalized linear regression to predict the sensitivity of drug on breast cancer cell line.
We loaded the data set into Apache Spark and split the data set into training and testing in the form of {target, compound, label}. Our predictor learnt from training data set and calculated the prediction for a model. When all predictors become trained, these are combined into a matrix. Then output is obtained on testing set, which gives the accuracy of the model.
3. Results and Discussion
In this study, prediction algorithms were evaluated on 29 cancer cell lines and two drugs anthracyclines and doxorubicin. The experiment was conducted on Apache Spark with algorithmic implementation in Scala language. We have uploaded the data set on Apache Spark and used naive Bayes predictor to get drug response prediction for cancer cell line. The obtained results indicate model test accuracy 0.94, precision 0.94, recall 0.94, sensitivity 0.9415, resistance 0.4668, and test error 0.0084. Accuracy describes how closely we predict the accurate values. Precision means positive predictive value. Precision describes how measurement is repeating consistently. Precision indicates that two or more calculations are close to each other and recall is also known as sensitivity that describes how many true positives were found. The F1 score measures the test accuracy of both p and r, where p denotes the precision and r denotes the recall. The F1 score describes the harmonic average of recall and precision. The value of sensitivity tells us how much our drug is effective for given cancer cell lines. Table 2 presents the values of parameters obtained in this study.
Results of Naive Bayes
In the second experiment, another predictor logistic regression was applied on the data set. It gave accurate results with ROC 1.0 that indicates the sensitivity and resistance of data set. Doxorubicin is the most effective drug in breast cancer treatment as compared with anthracycline. We obtained the ROC for the data set. We created the ROC curve by using FPR and TPR. FPR and TPR stand for “false positive rate” and “true positive rate,” respectively. TPR interprets sensitivity or recall of data set and FPR interprets the fall-out of data set. The ROC curve is presented in Figure 3.
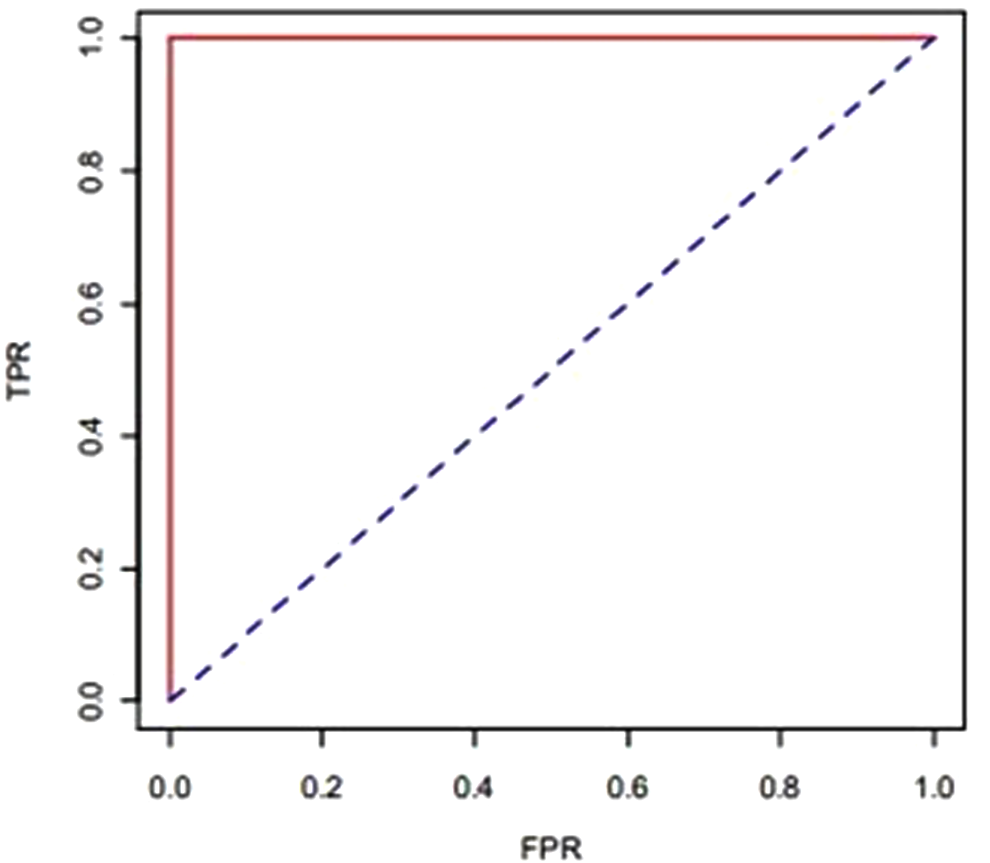
ROC curve obtained by logistic regression.
Generalized linear regression is used to predict the best drug for gene expression. We have calculated the p-value, t-value, coefficient, intercept, deviance, dispersion, null deviance, residual degree of freedom, and AIC value that indicate the result for predictor. Table 3 presents the results of generalized linear regression.
Results of Generalized Linear Regression
AIC, Akaike information criterion.
In this study, p-value represents the probability. If p-value is <0.05, then null hypothesis is rejected, which means there is a relationship between the drug and cell line. t-Value represents the hypothesis test. AIC stands for Akaike information criterion, the smaller value of AIC indicates the best model.
Different tools have been used for drug prediction in bioinformatics. The main problem of conventional tools is when data set increases beyond the limit, accuracy of these tools becomes a question mark. We have compared our results with the existing results in the literature. In our experiment, 94% accuracy is obtained using naive Bayes on Apache Spark. Accuracies of other models available in the literature are presented in Figure 4.
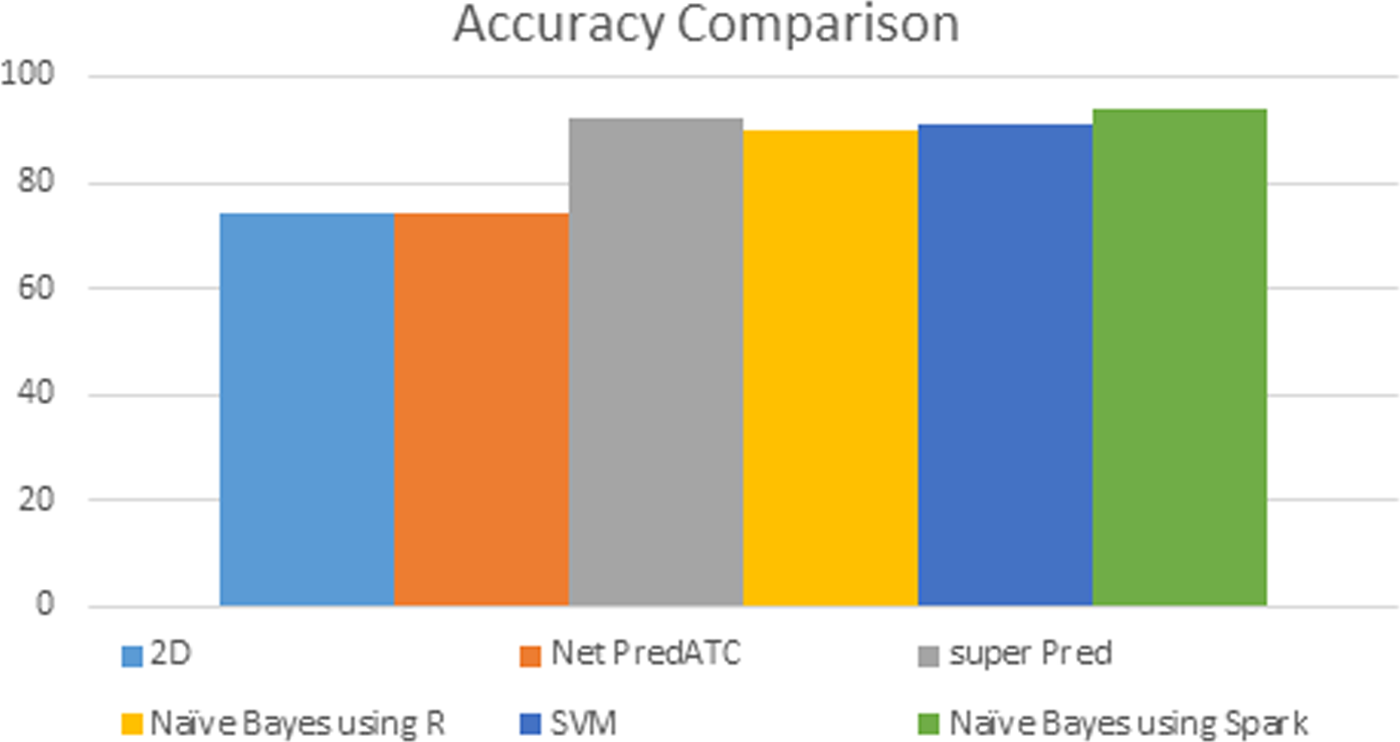
Accuracy comparison of different algorithms.
R and Matlab can handle only few GB data. Currently R language has some limitations. R can handle only few GB of data. Data processing capacity is limited in a single node. R uses libraries that are few constrained to 32-bit integers. It means that some indexes and vectors are limited to 32 bits. R not only affects the capacity of data, but also affects the performance. When allocating data in frames having 5,000,000 rows and 3 columns, it would throw an error in a PC of 3 GB RAM due to memory restriction (VenKatraman, 2018). In Matlab, large data sets are in the form of large files that do not fit in the memory, so the file takes long time to process. When some codes are tried that require to build big matrices of 10 order of 10,000 × 10,000 and the size of matrix exceeds 5000 × 5000, then error message is out of memory (Ashutosh, 2012). When loading mat file >2GB in Matlab, it was too slow to load the file (You, 2017). Spark provides data processing power in Terabyte (TB), it has fast parallel computing capabilities. It can extend over hundreds of nodes. We increased the cell lines from 100 to 600 lines and compared the performance of Spark with that of other tools. The results are presented in Table 4. Spark performs better than other tools and its accuracy increases as the number of lines is increased.
Accuracy Using Different Tools with Increased Cell Lines
Apache Spark provides different libraries to support bioinformatics, next-generation sequencing, and other biological area such as drug discovery, phylogeny, and epigenetics. Different Spark-based applications are used to perform next-generation sequence analysis, as presented in Table 5. Apache Spark can provide facility for processing next-generation sequencing data. It provides SparkSeq, “a general-purpose extendable library for genomic cloud computing.” Different examples and implementations of SparkSeq are discussed by Wiewiórka et al. (2014).
Bioinformatics Tools Based on Apache Spark
4. Conclusion
The basic purpose of drug sensitivity prediction in cancer cell line is to correctly predict the response of cancer cell line to a drug. Knowledge of the relationship between drug sensitivity and gene expression is required to predict the most accurate drug for the right person that reduces the side effects of treatment. Information of drug structure and sensitivity on cell line is one of the important characteristics that is used to recognize the therapeutics for tumor. Machine learning algorithms have been used to predict the drug sensitivity for cancer cell line. These algorithms were applied using tools such as R and MATLAB. However, these tools fail to produce accuracy when the data size crosses certain limits.
In this article, a study has been presented on the use of Apache Spark for drug sensitivity prediction. Apache Spark provides efficient parallel processing of large data using in-memory computation. Machine learning algorithms were implemented using Scala language. We have obtained 94% accuracy for drug target prediction, which is better than the accuracy values available in the literature. In future, we want to work on multiple data sets for drug target prediction.
Footnotes
Author Disclosure Statement
The authors declare there are no competing financial interests.