
Abstract
Abstract
Random fluctuations are often considered detrimental in the context of gene regulation. Studies aimed at discovering the noise-buffering strategies are important. In this study, we demonstrated a novel design of attenuating noise at protein-level. The protein-ligand interaction dramatically reduced noise so that the coefficient of variation (COV) became roughly 1/3. Remarkably, in comparison to the other two noise-buffering methods, the negative feedback control and the incoherent feedforward loop, the COV of the target protein in the case of protein-ligand interaction appeared to be less than 1/2 of that of the other two methods. The high correlation of the target protein and the ligand grants the present method great ability to buffer noise. Further, it buffers noise at the stage after translation so it is also capable of attenuating the noise inherited from the process of translation.
1. Introduction
T
An alternative strategy of buffering noise is the incoherent feedforward control (Osella et al., 2011), which does not suffer from the time delay of the gene expression. The most popular feedforward loop (FFL) in eukaryotes is composed of an input, usually a transcription factor (TF), and two downstream genes. One of them is the target gene producing mRNA, and the other usually produces miRNA. The generation of the miRNA is regulated by the TF but that of the mRNA is regulated by both the TF and the miRNA. In a coherent FFL, both the TF and the miRNA have the same effect on the target gene (Chepyala et al., 2016). In an incoherent FFL, the TF activates the target gene but the miRNA represses the generation of the target protein. The noise buffered by the motif of incoherent FFLs was observed by both model (Osella et al., 2011) and experiment (Ebert and Sharp, 2012) in literature. Note that the components of incoherent FFL are not confined to the TF, the miRNA, and the mRNA. Numerous FFL were identified in a diverse range of organisms, from prokaryotes (Mank et al., 2013) to eukaryotes (Kittisopikul and Süel, 2010). In prokaryotes, instead of miRNA, sRNA is recognized as a critical post-transcriptional regulator as it reacts to mRNA to decrease the production of the target protein (Shu et al., 2011; Mank et al., 2013).
In this study, we aim at discovering a novel method to buffer noise. To the best of our knowledge, no one reported that the peptide as a ligand is capable of attenuating random fluctuations at the protein level. The dynamic protein-ligand interactions are ubiquitous in biological systems and their traces can be found in the viral infection (Gorgai et al., 1994), the signal response (Shu et al., 2011), the oncogenesis (Su et al., 1993), and many others (Wu et al., 2010; Southan et al., 2015; Jhang et al., 2017). We focus on the case in which the ligand is a peptide inhibiting the function of the protein. We discovered the possibility of utilizing such a peptide to attenuate noise at the protein level. We also examined how it reduce noise inherited from various sources. The noise of the upstream TF can be manipulated by altering its translation rate constant. This is because the process of translation usually caused larger noise at the protein level than that of transcription (Ozbudak et al., 2002). To keep the same level of TF, we simultaneously adjusted the transcription rate of the gene encoding TF.
2. Models
We discussed four different scenarios, as shown in Figure 1 with the nomenclature of variables in Table 1. The details of reactions are in Supplementary Tables S1–S4 of Supplementary Material. The nomenclature of the additional variables is in Supplementary Table S5. Based on these reactions, we conducted the stochastic simulation algorithm (SSA) (Gillespie, 1977) with the values of the parameters adopted from literature (Markgren et al., 2001; Osella et al., 2011; Jhang et al., 2017) in Supplementary Table S6. For the transcriptional delay or translational delay, we applied the delay SSA (Bratsun et al., 2005).
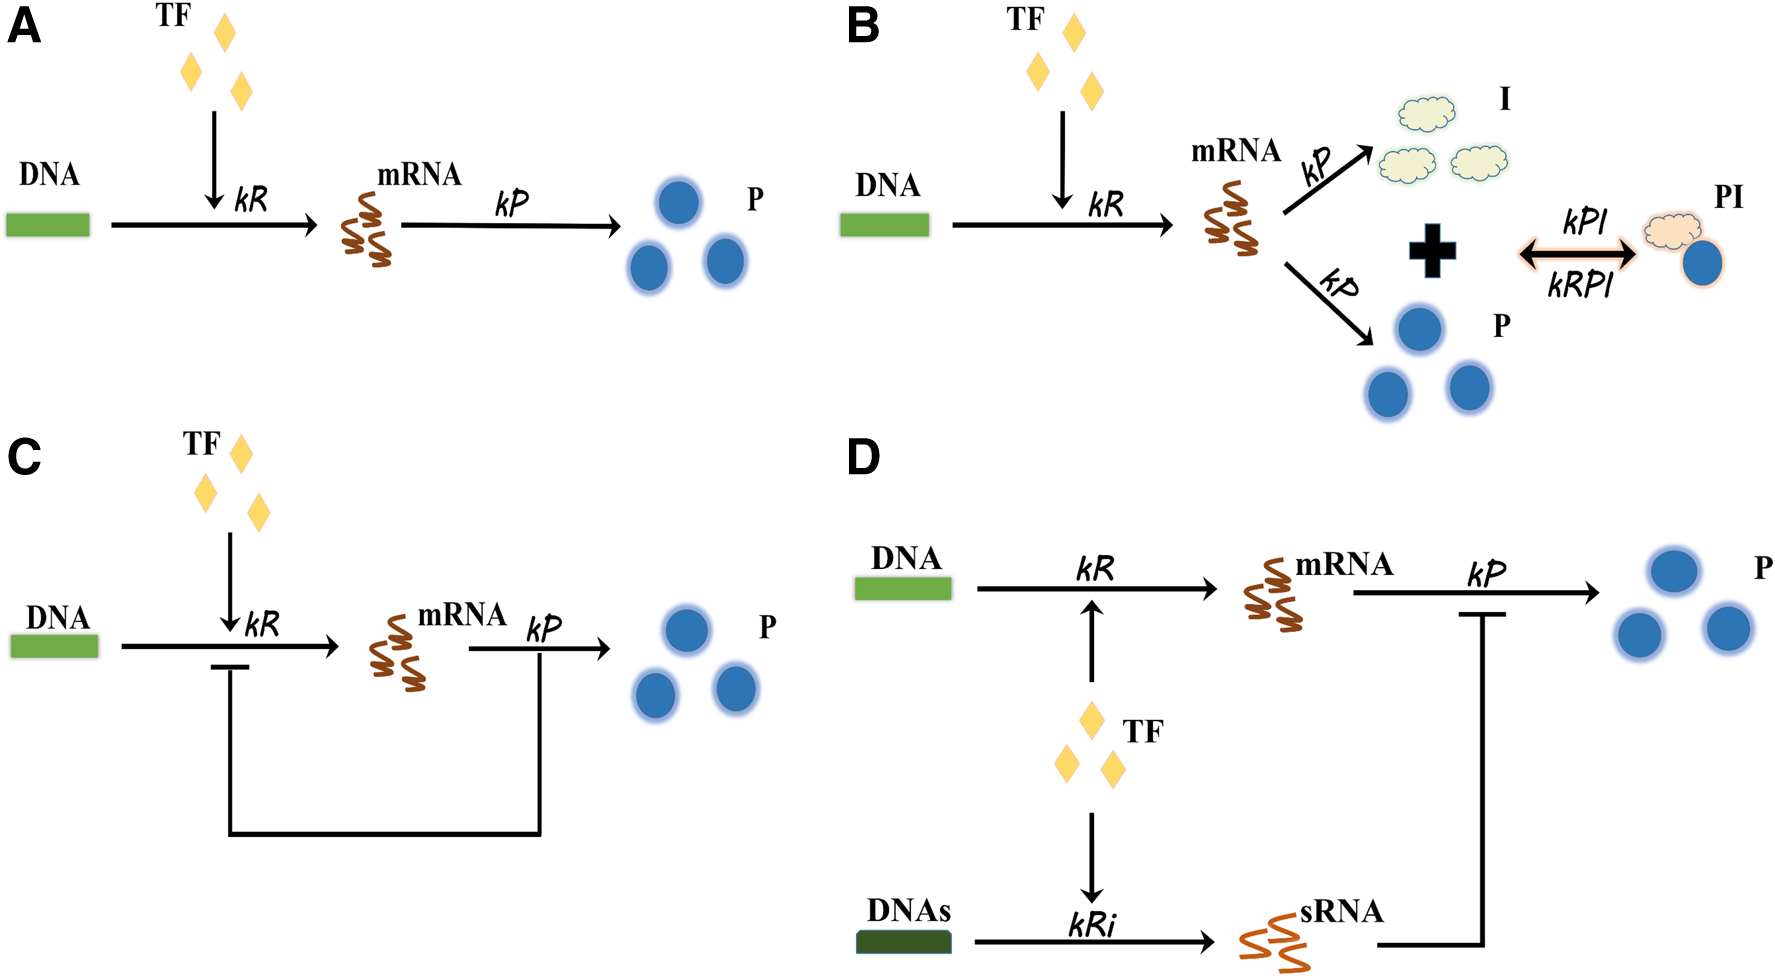
The system of the gene expression and the noise-buffering methods. Four cases were examined.
The Nomenclature of Variables
As for the time span of the cell division, we generated a Gaussian random number to describe it and assumed the ratio of standard deviation to mean as 10%, according to the experimental observation (Song et al., 2015). We then applied the binomial distribution to the partition of the intracellular species (Rosenfeld et al., 2005). The initial condition of each intracellular variable is zero except for the DNA, which is one per cell. The cellular volume is 10−15 L. Note that this is the typical size of a bacterium, and the reaction networks in Figure 1 are for the prokaryote. When the first and second moments became time independent, we recorded the cellular states. Specifically, we sampled at 90,000 seconds. Each distribution is composed of 10,000 trajectories. We obtained the mean and variance from at least 1000 trajectories. We formulated the deterministic model (Supplementary Table S7–S10) by the law of mass action and conducted the steady-state analysis in Matlab with function fsolve or solve of the symbolic toolbox.
3. Results
We examined the noise at the protein level for four scenarios (Fig. 1). The nomenclature is in Table 1. Figure 1A is an ordinary gene expression without a noise-buffering mechanism. Figure 1B is the novel noise-buffering method proposed in this study. It contains a peptide as a byproduct of the target protein. In synthetic biology, it can be achieved by inserting a cleavage site between the target protein and the peptide (Antiporta and Dunny, 2002). This peptide has to be a ligand inhibiting the target protein. A natural inhibitor with a high binding affinity for the target protein is the best candidate. The protein loses its function when it is bound by the peptide. Therefore, the protein-peptide complexes are not of interest in the model. In addition, we assumed that the process of cleavage is required for the proper function of the target protein. Namely, we neglected the immature protein in the model. This assumption is rational as many natural proteins interact with the receptors with C-terminal or N-terminal domain (Costes et al., 2010; Fan et al., 2012). Figure 1C is the gene expression with a negative feedback control regulating its own transcription. Figure 1D is an incoherent FFL. Our goal is to compare these four cases and to propose the plausible explanations of the outcome.
3.1. The ligand attenuating the noise of the target protein
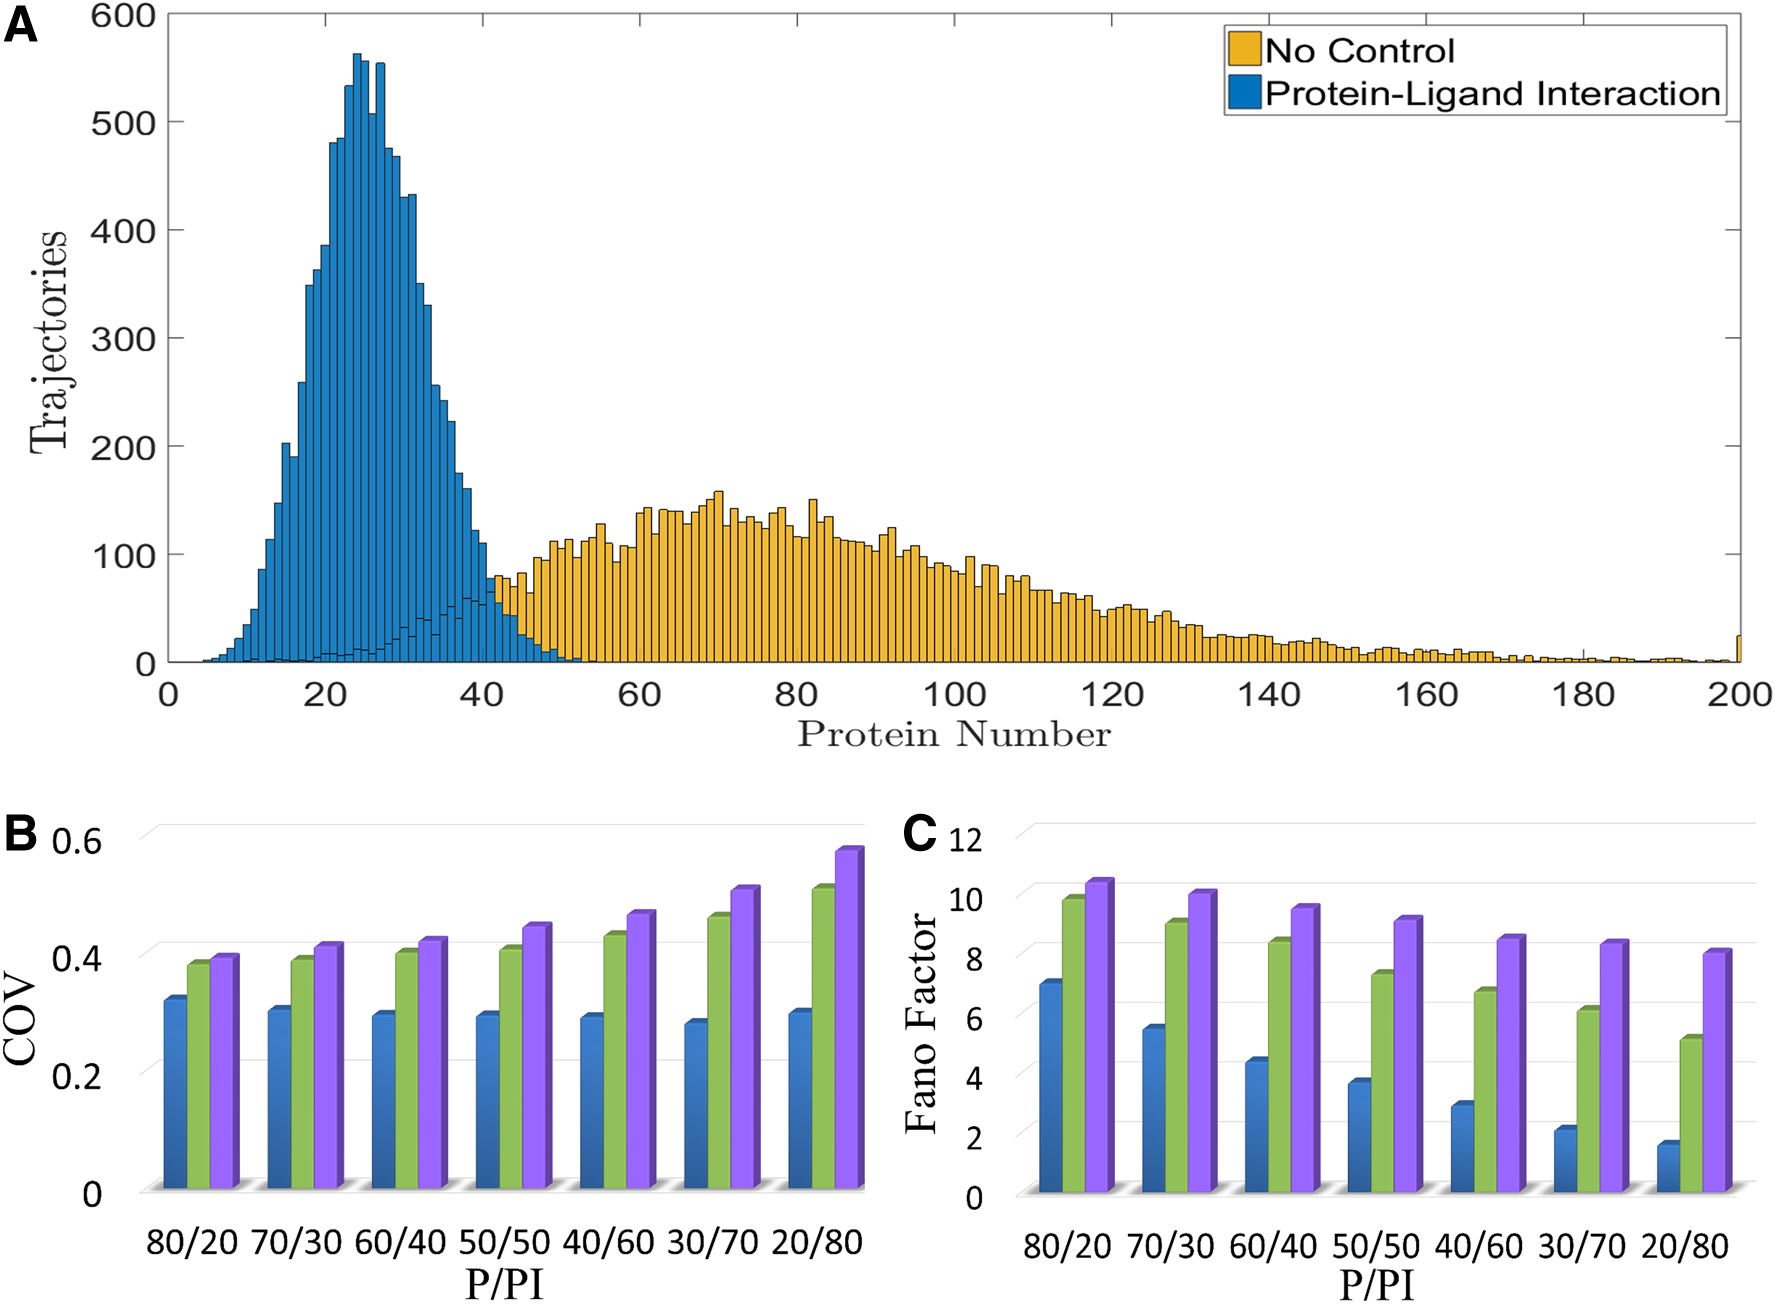
We first examined the motif of the protein-ligand interaction. In comparison to Figure 1A, there are two more reactions in Figure 1B. One is the generation of ligands (I). The other is the interaction between the ligand and the target protein. Figure 2A showed the distribution of the target protein. The yellow bars represent the distribution of the target protein in the case of Figure 1A, and the blue bars indicate that of Figure 1B. It is clear that the interaction between P and I buffered the noise.
The performance of noise-buffering methods. We examined three noise-buffering methods. They are the protein-ligand interaction, the negative feedback control, and the incoherent FFL.
3.2. The protein-ligand interaction showed the great potential of buffering noise at various protein levels
In this study, there are three noise-buffering methods. They are the protein-ligand interaction (Fig. 1B), the negative feedback control (Fig. 1C), and the incoherent FFL (Fig. 1D). For these three cases, Figure 2B and C demonstrated the coefficient of variation (COV) and Fano factor of the target protein, respectively. The blue bar represents the case of the protein-ligand interaction, the green bar the negative feedback control, and the purple bar the case of incoherent FFL. The x-axis is the P/PI, which indicates the ratio of the free target protein to the protein-ligand complex. The value of the P/PI is from the deterministic steady-state analysis. Note that all results in Figure 2 are from the stochastic simulation; we used the deterministic model only to determine the values of the parameters to achieve a certain value of P/PI. The value of P is the number of the free protein and that of PI is the number of the protein-ligand complex in the case of the protein-ligand interaction. Note that, with the nominal values of the parameters in Supplementary Table S6, the steady-state level of the protein in the case without a noise-buffering method (the case of Fig. 1A) is 100 particles per cell. While applying the noise-buffering method, it reduced the level of the free protein.
Because the degradation rate constant of PI is the same as that of P, the summation of P and PI is 100, which is the same as the particle number of free protein in the case without a noise-buffering method. In other words, PI also implies the amount of protein consumed by the noise-buffering method. This physical meaning of PI is also valid for the other two noise-buffering methods. The reasons are as follows. If the strength of feedback control or feedforward control reduced to zero, the system reduced to the case without a noise-buffering method (the case of Fig. 1A). In other words, the number of free protein is the summation of P and PI before applying the noise-buffering methods but it became P after noise buffered by negative feedback control or incoherent FFL. Namely, for the other two noise-buffering methods, the summation of P and PI is 100. P and PI are still the particle number of the free protein and the consumption of protein by the noise-buffering method, respectively.
To achieve a certain value of PI in Figure 2B or C, we did the following. In the case of the protein-ligand interaction, we adjusted the equilibrium constant of the protein and the ligand by tuning the dissociation rate constant, kRPI in Supplementary Table S6. In the case of the negative feedback control, we adjusted the feedback strength by tuning the value of the parameter K in Supplementary Table S6. In the case of the incoherent FFL, we altered the constant describing the influence of sRNA on the translation of target protein, the parameter N in Supplementary Table S6.
The COV of the target protein in Figure 2B implied that the protein-ligand interaction has a great potential to buffer noise. The COV remained low at various protein levels in the case of the protein-ligand interaction. For P/PI = 20/80, the COV in the case of the protein-ligand interaction is less than 60% of that of the other two noise-buffering cases. In cases of the negative feedback control or the incoherent FFL, the decrease of P resulted in the increase of COV. The plausible explanation is the decrease of particle number enlarging the random fluctuations. Figure 2C showed the Fano factor of the target protein. It appeared to be a monotonic decrease while decreasing P, in all three cases. The case of the protein-ligand interaction showed the lowest COV and Fano factor at various protein levels. Without a doubt, the protein-ligand interaction well buffered the noise of the target protein.
3.3. The protein-ligand interaction reduced much more noise than the other two noise-buffering methods
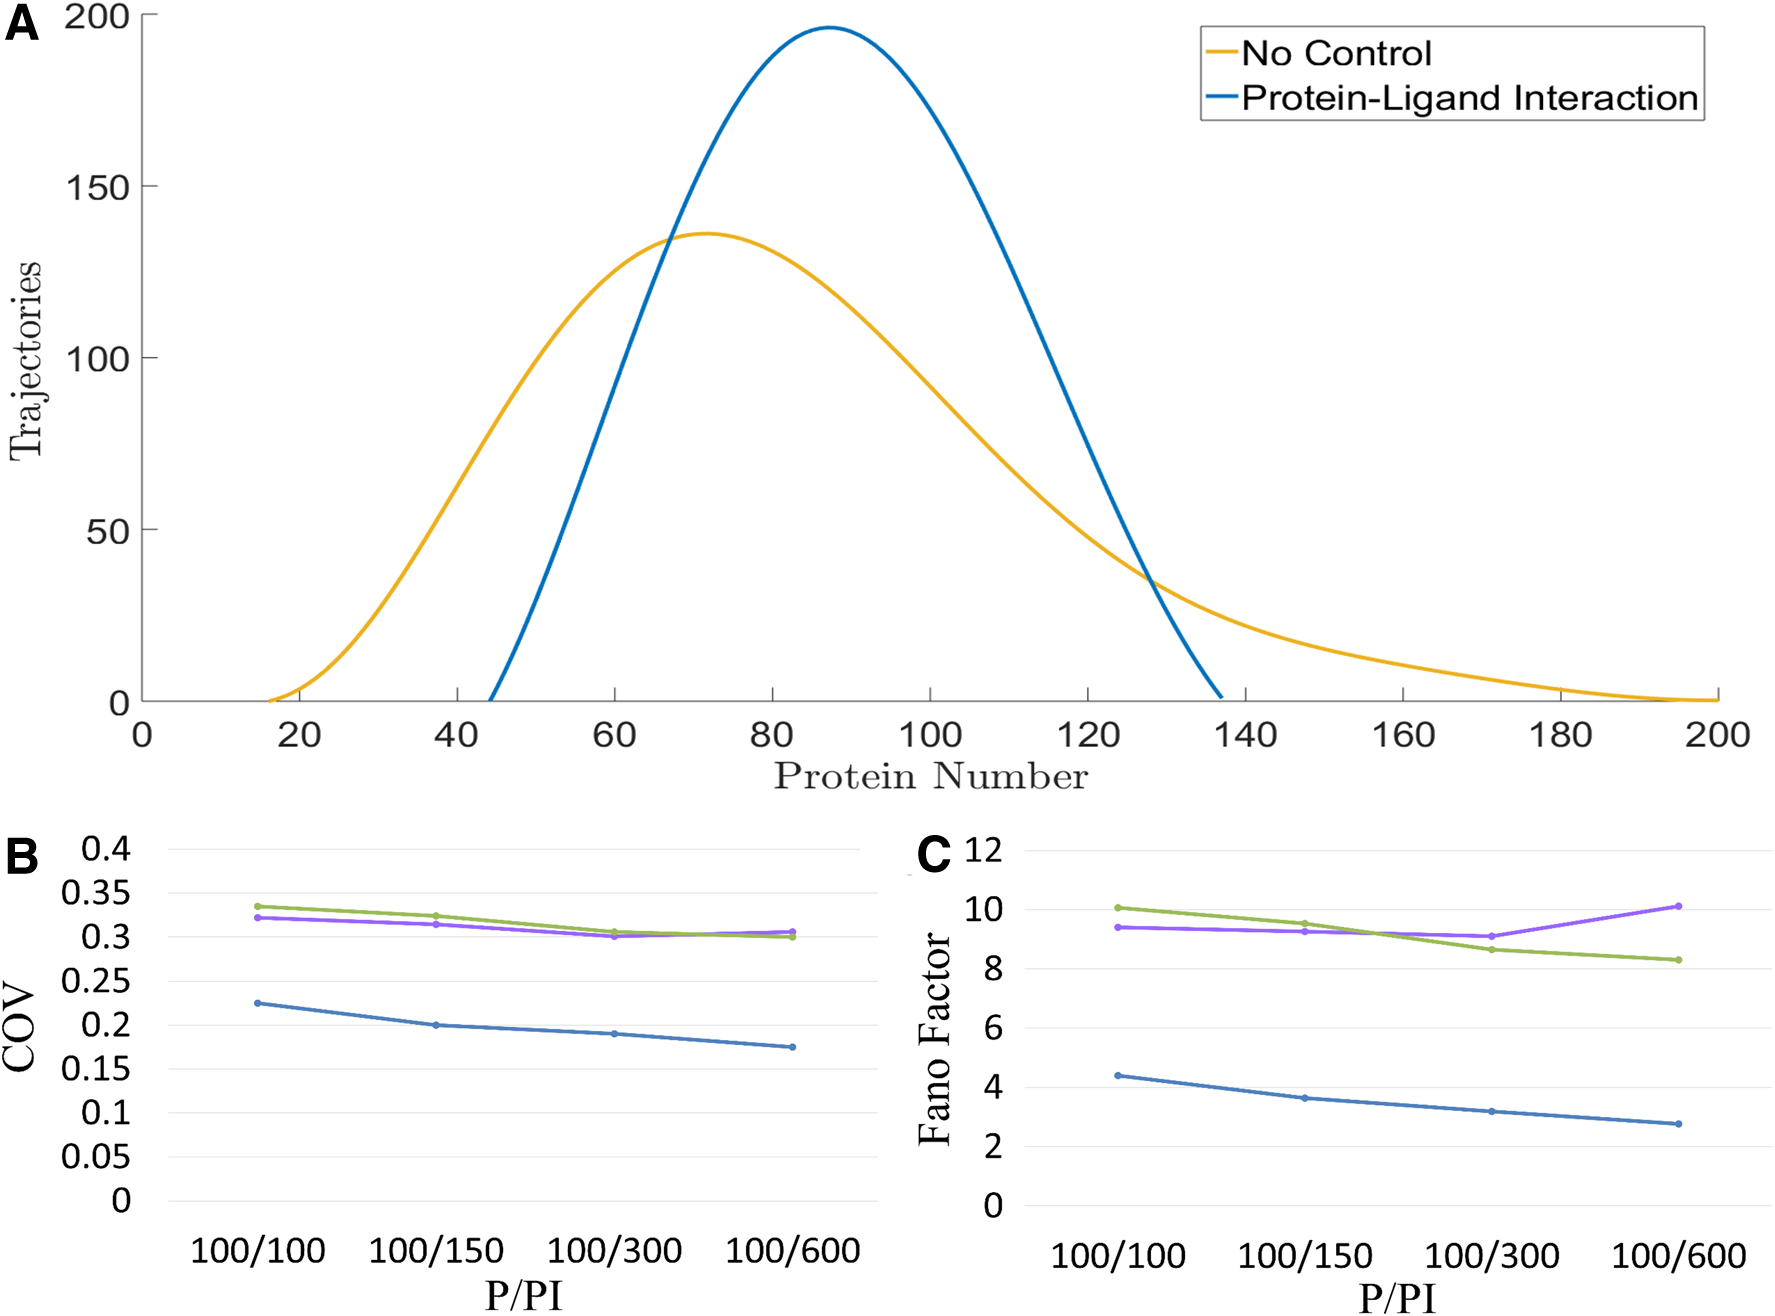
In Figure 2, the reduction of protein level caused the incremental random fluctuations. To get rid of it, we maintained the protein level by increasing the transcription rate. With the steady-state analysis of the deterministic model, we adjusted the transcription rate to keep the free protein level at 100 particles per cell. We first simulated the particle number of the protein-ligand complex as 600. Namely, P/PI = 100/600. Figure 3A showed the distribution of the target protein. The blue curve is the case with the protein-ligand interaction, and the yellow curve is the case without a noise-buffering method. The protein-ligand interaction narrowed the distribution and lowered the noise notably.
The performance of noise-buffering methods while maintaining the protein level. We examined three noise-buffering methods while maintaining the protein level by increasing the transcription rate.
We then further examined the situations with particle number of PI as 300, 150, or 100. Figure 3B and C showed the COV and Fano factor of the target protein, respectively. The blue represents the case of the protein-ligand interaction, the green the negative feedback control, and the purple the case of incoherent FFL. The x-axis is the deterministic steady-state value of P/PI. Note that, for all three cases, P is the particle number of the free target protein and PI represents the consumption of protein by the noise-buffering method. To achieve certain P/PI, we first adjusted the transcription rate so that the particle number of protein, for the case without a noise-buffering method, is the summation of P and PI. We then applied noise-buffering methods to reduce the free protein to 100 particles per cell for each case. To achieve a certain value of PI, we adjusted the values of the parameters as we did in Figure 2B and C.
The COV (Fig. 3B) and the Fano factor (Fig. 3C) of the target protein in the case of the protein-ligand interaction were notably lower than that in the other two cases. The COV and Fano factor in case of the negative feedback control decreased monotonically with the incremental feedback strength but that in the case of the incoherent FFL showed a minimum value of 100/300 at P/PI. A plausible explanation of the latter is as follows. When the feedforward control is too strong, the noise of sRNA causes the incremental noise of the target protein. Nevertheless, the COV and Fano factor in case of the incoherent FFL is comparable to that in case of the negative feedback control. For both cases, the COV and Fano Factor are much larger than that in case of the protein-ligand interaction. Clearly, the protein-ligand interaction is good at buffering noise.
3.4. The protein-ligand interaction attenuates noise from various sources
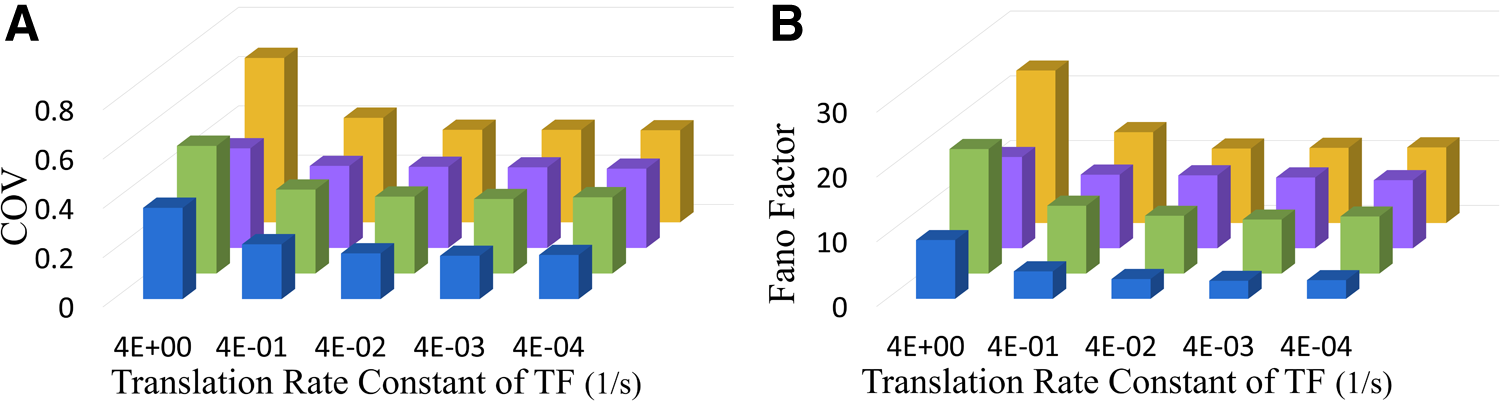
It is not trivial to understand how the protein-ligand interaction attenuates random fluctuations from different sources of noise. We first increased the noise of the TF by increasing the translation rate of the TF. To keep the same level of the TF, we decreased its transcription rate accordingly. Then, we applied the noise-buffering methods. We chose a P/PI value of 100/300 as this value showed the lowest COV of the target protein in the case of FFL in Figure 3. The FFL is famous for its great ability to buffer noise when the noise of the TF is large. Figure 4A and B showed the COV and the Fano factor of the target protein, respectively. The blue bar represents the case of the protein-ligand interaction, the green bar the negative feedback control, the purple bar the case of incoherent FFL, and the yellow bar the case without a noise-buffering method. For the case without a noise-buffering method, the deterministic steady-state particle number of the target protein is 100. The x-axis is the translation rate constant of the TF. This value reflects the noise of the TF. A large translation rate constant leads to a huge noise of TF. As expected, the performance of the incoherent FFL (purple) is better than that of the feedback control (green) whereas the noise of the TF is large. Nevertheless, the protein-ligand interaction shows the lowest COV and Fano factor.
The performance of noise-buffering methods with various COV of TF. By changing the translation rate of TF, we altered the noise of TF.
We then altered the noise of the target protein by changing its own translation rate constant. To maintain the same protein level, we adjusted its transcription rate accordingly. At a P/PI value of 100/300, Figure 5A and B showed the COV and Fano factor of the target protein, respectively. Note that the y-axis of Figure 5B is in logarithmic scale. The COV of the target protein in case of the protein-ligand interaction is roughly half of that in the other two noise-buffering cases. In conclusion, the protein-ligand interaction always shows its great ability to buffer noise.

The performance of noise-buffering methods with various COV of the target protein. We altered the COV of the target gene by changing its translation rate.
4. Discussion
In this work, we demonstrated that the protein-ligand interaction buffered the noise at the protein level. In comparison to the other two well-known noise-buffering methods, the FFL and the feedback control, the protein-ligand interaction showed the lowest COV and Fano factor (Figs. 2 and 3). We also examined how noise-buffering methods respond to different sources of noise. For a system with the large noise of TF, although the performance of the FFL is greater than that of the negative feedback control, the performance of the protein-ligand interaction is still the best (Fig. 4). For the system with large noise from the process of translation, the case of the protein-ligand interaction showed much lower COV and Fano factor (Fig. 5) than that of the other two noise-buffering methods. The results suggest that the protein-ligand interaction is suitable for buffering noise in various situations.
For the case of the protein-ligand interaction, the origin of noise attenuation is straightforward. Figure 6A illustrated the trajectories of the target protein (blue) and the ligand (pink) under the condition of no reaction between these two. The patterns of the random fluctuations of these two intracellular species are similar. The ligand tends to change in the same direction as that of the target protein. Once there is an interaction between these two, the ligand is able to attenuate the fluctuations of the target protein in time. Note that the correlation between protein and ligand is much higher than that of sRNA and mRNA in FFL.
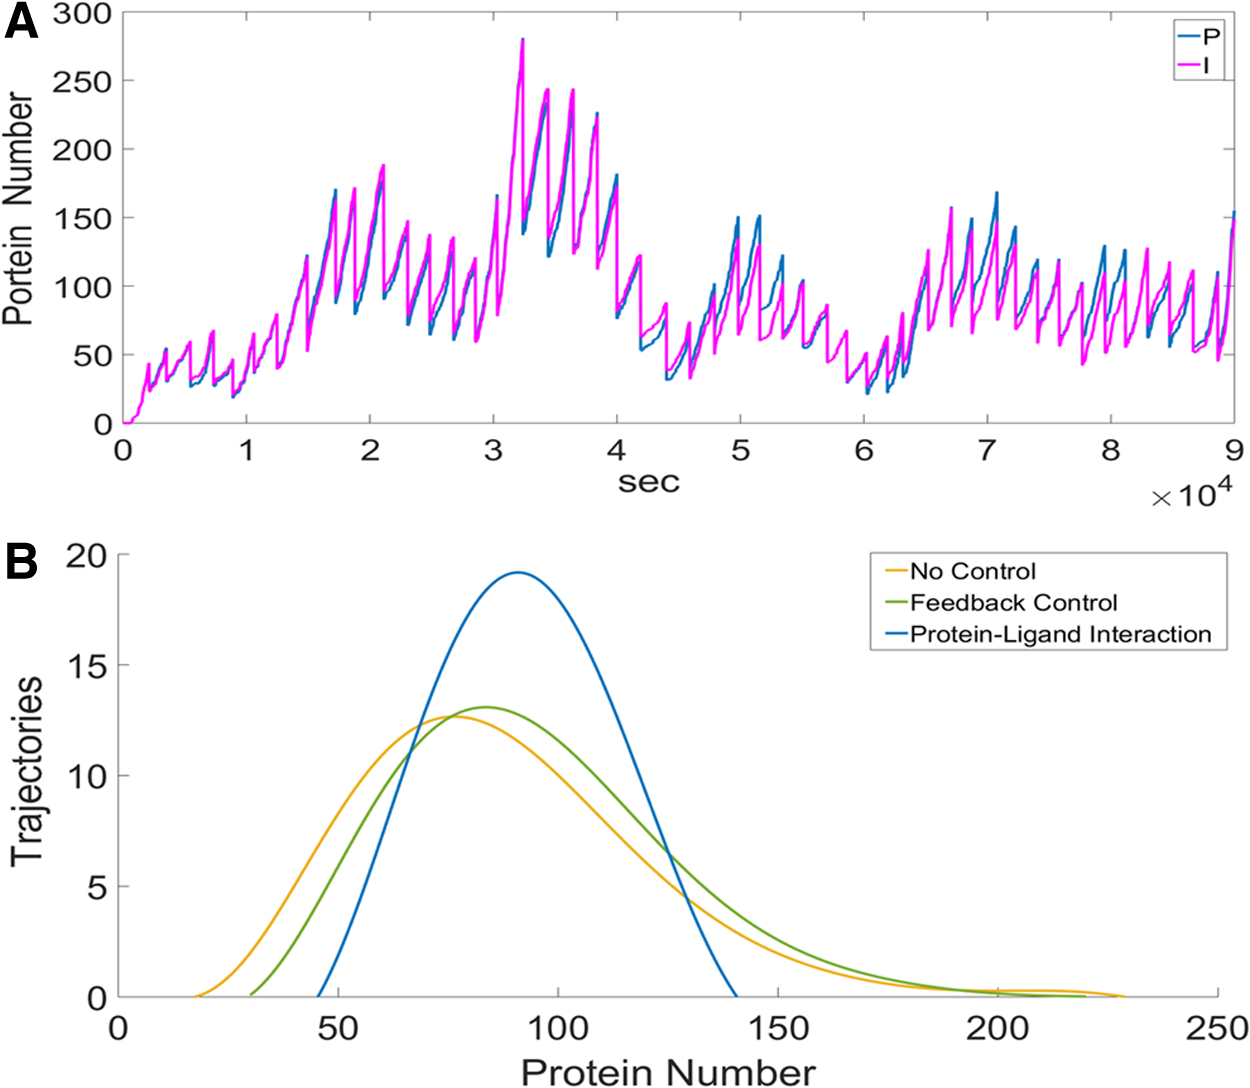
The features of the protein-ligand interaction.
In addition, there are two great features of the protein-ligand interaction. The first is that the protein-ligand interaction buffered noise at the stage after translation. It is well known that the process of translation causes notable noise. However, the incoherent FFL buffers noise before translation and, thus, it fails to buffer noise from the process of translation. To demonstrate it, we simply conducted a simulation with the particle number of mRNA as a constant; namely, the noise of mRNA is 0. We examine the situation that P/PI is of 100/300. The COV of the target protein in the case of the protein-ligand interaction is 0.13 but that in the case of FFL is 0.29. Note that the COV is 0.23 in the case without a noise-buffering method. Intriguingly, the incoherent FFL enlarged the noise. This is because the target protein inherited noise from the random fluctuations of the sRNA. In conclusion, the protein-ligand interaction is good at buffering noise resulting from the translation of the target protein.
The other advantage of the protein-ligand interaction is that it buffers noise in time. To clearly observe it, we added 20 minus delay to the transcription of the target gene. Figure 6B showed the distribution of the target protein. The blue is for the case of the protein-ligand interaction, the green is for the case of the feedback control, and the yellow is for the case without a noise-buffering method. Intriguingly, instead of buffering noise, feedback control caused more noise. The reason is as follows. The response time of the feedback control depends on the regulatory network. The time delay in the processes of transcription and translation increased the response time. When the response time exceeded a certain value, the feedback control failed to catch the random fluctuations of the target protein. In nature, both transcription delay and translation delay are very common (Zhang et al., 2017) and they may diminish the noise attenuation of the feedback control. On the other hand, the protein-ligand interaction does not suffer from the time delay. As shown in Figure 6B, it works appropriately.
The protein-ligand interaction showed a great ability to buffer noise. It notably reduced the noise of the target protein. Nevertheless, from the aspect of energy efficiency, the feedback control is the best because it regulates the transcription; the incoherent FFL, which regulates translation, is less efficient; and the protein-ligand interaction is the least, due to its post-translation regulation. Therefore, we suggest applying the protein-ligand interaction to engineered genetic circuits requiring precise control.
Footnotes
Acknowledgment
This work was supported by a grant (MOST 106-2221-E-027-143-) from the Ministry of Science and Technology, R.O.C.
Author Disclosure Statement
The authors (S.-C.L., F.-Y.L., W.-S.J., and C.-C.S.) certify that they have no affiliations with or involvement in any organization or entity with any financial interest (such as honoraria; educational grants; participation in speakers' bureaus; membership, employment, consultancies, stock ownership, or other equity interest; and expert testimony or patent-licensing arrangements), or nonfinancial interest (such as personal or professional relationships, affiliations, knowledge, or beliefs) in the subject matter or materials discussed in this article.
References
Supplementary Material
Please find the following supplemental material available below.
For Open Access articles published under a Creative Commons License, all supplemental material carries the same license as the article it is associated with.
For non-Open Access articles published, all supplemental material carries a non-exclusive license, and permission requests for re-use of supplemental material or any part of supplemental material shall be sent directly to the copyright owner as specified in the copyright notice associated with the article.