
Abstract
Abstract
Recent technological advances have made next-generation sequencing (NGS) a popular and financially accessible technique allowing a broad range of analyses to be done simultaneously. A huge amount of newly generated NGS data, however, require advanced software support to help both in analyzing the data and biologically interpreting the results. In this article, we describe SATrans (Software for Annotation of Transcriptome), a software package providing fast and robust functional annotation of novel sequences obtained from transcriptome sequencing. Moreover, it performs advanced gene ontology analysis of differentially expressed genes, thereby helping to interpret biologically—and in a user-friendly form—the quantitative changes in gene expression. The software is freely available and provides the possibility to work with thousands of sequences using a standard personal computer or notebook running on the Linux operating system.
1. Introduction
Massive parallel sequencing, such as RNA (RNA-seq), opens up great possibilities for transcriptomic studies to measure gene expression changes within an entire transcriptome despite having no previous knowledge of the sequences (Wang et al., 2009). Rapid technological advances have made this technique very cost-effective and widely used. Thus, the amount of RNA-seq data in the NCBI Short Read Archive (SRA) database increases every day (https://www.ncbi.nlm.nih.gov/sra/docs/sragrowth/). Together with this increasing RNA-seq data, the number of sequences still to be characterized also grows. Particularly if the genome of a given organism of interest is not already sequenced and annotated, thousands of de novo reconstructed transcripts with unknown function are produced (Geniza and Jaiswal, 2017). Although several tools promising efficient functional analysis of these nucleotide sequences already have been developed, rapid and effective functional characterization of such a large number of sequences remains a challenging task.
For example, TRAPID (Van Bel et al., 2013) and Transcriptator (Tripathi et al., 2015) are quite comprehensive and freely available transcriptome analysis tools. Both tools are dedicated to functionally annotate transcript sequences by sequence similarity search, which is performed by RAPSearch2 (Zhao et al., 2012) or BLAST (Altschul et al., 1990), respectively, in the selected protein databases. Both tools provide gene ontology (GO) (Ashburner et al., 2000) term assignment, TRAPID, moreover, performs a phylogenetic analysis of gene families, and Transcriptator identifies noncoding RNAs (Van Bel et al., 2013; Tripathi et al., 2015). Both TRAPID and Transcriptator are web interface-based applications, making them user-friendly, but also giving rise to certain limitations. For example, the number of sequences that can be analyzed in a single project is limited and there is a “wait in a queue” for computing capacity. Mercator, another web interface-based application suited for processing of large-scale data sets, is a pipeline specifically designed to functionally annotate plant “omics” data (Lohse et al., 2014). This pipeline computes functional annotations of protein or nucleotide input sequences using the MapMan BIN ontology. It combines BLAST-based and protein domain-based search to compute “BIN” assignments, the system of functional categories different from GO (Lohse et al., 2014).
Among the desktop applications is the very popular Blast2GO (Conesa et al., 2005). The freeware BASIC version of this software performs functional annotation of nucleic acid or protein sequences using BLAST and InterProScan search (Jones et al., 2014), and the current version of the charged PRO version integrates the analysis of differential expression of count data arising from RNA-seq technology.
We present here SATrans, a freeware desktop application providing open reading frame (ORF) prediction and sequence similarity BLAST-based search not only in the protein databases but also in the nucleotide databases. Furthermore, it offers the possibility to choose the type of BLAST search to be performed (blastn, blastp, blastx, tblastn, tblastx). Obviously, each annotation tool is helping to understand biological meaning of transcriptomic data, however, each is designed for a certain purpose as well as SATrans. The goal of SATrans is not to replace any of the tools mentioned above, but to increase the effectivity of the annotation process and to provide a functional analysis of differential gene expression data generated by RNA-Seq, helping to functionally and biologically interpret such large data sets. Up to now, SATrans is the only freely available software for functional annotation of nucleotide/amino acid sequences, which allows the analysis of differential gene expression data with respect to the biological function, process, and cellular localization based on the GO annotation.
In the following sections, we explain the main functionalities of the software and provide a typical example use case to illustrate the applicability of SATrans in transcriptomic studies.
2. Methods
2.1. Software description and functionality
SATrans is written in Perl (https://perldoc.perl.org/), as the main programming language, and MySQL (https://dev.mysql.com/downloads/mysql/), as the language for communicating between the software and the database for enduring storage of data. The software is primarily designed for GNU/Linux, and the current version is designed for a command line. The software is divided into three Perl modules: blast.pm, ipr_scan.pm, and datab.pm. It operates through eight modes: create, update, repair, analysis, delete, show, export, and import.
The module blast.pm provides the BLAST function to search for homologous sequences in the database of interest and the communication between the user's PC and the remote NCBI server providing the public databases (https://www.ncbi.nlm.nih.gov). The module also allows a local BLAST against a local FASTA-formatted database. This, however, requires the installation of the BLAST standalone (Camacho et al., 2008) and is high memory-consuming. The Ipr_scan.pm module consists of the functions used for the InterProScan search (https://www.ebi.ac.uk/interpro/) (Jones et al., 2014). InterProScan allows scanning of the input sequences for matches against the InterPro protein signature databases. It is executed by HTTP protocol and service on the website iprscan5. InterPro integrates 11 protein family databases: HAMAP (Pedruzzi et al., 2015), PANTHER (Mi et al., 2016), Pfam (Finn et al., 2016), PRINTS (Attwood et al., 2012), ProDom (Bru et al., 2005), PROSITE Patterns and PROSITE Profiles (Sigrist et al., 2013), SMART (Letunic et al., 2015), TIGRFAMs (Haft et al., 2013), SUPERFAMILY (Oates et al., 2015), and CATCH-Gene3D (Lam et al., 2016). It is one of the main sources of GO annotation (Sangrador-Vegas et al., 2016).
Before InterProScan is launched, the best ORF in the nucleotide sequence is determined. The algorithm for the best ORF search depends on ORF length. The longest ORF is selected as the best, translated to a protein, and then used by InterProScan, which searches all the InterPro databases (Finn et al., 2017) to collect such information as GO terms or conserved domains. Functions stored in the datab.pm module enable communication between the SATrans software and the MySQL database. These include transport of the BLAST and InterProScan results into the database, and other database-associated operations such as “update,” “select,” and “delete.” The module also contains functions for export of the results (“export”), creation (“create”), and quality control (“show”) of the MySQL database. Furthermore, the module contains functions for the analysis (“analysis”) of DESeq2 (Love et al., 2014) data, which are provided as an input by the user.
The software is designed to perform the following tasks: (1) functional annotation of nucleotide or amino acid sequences and (2) GO enrichment analysis of differentially expressed genes (DEGs).
A simplified scheme of the analytical process is shown in Figure 1.
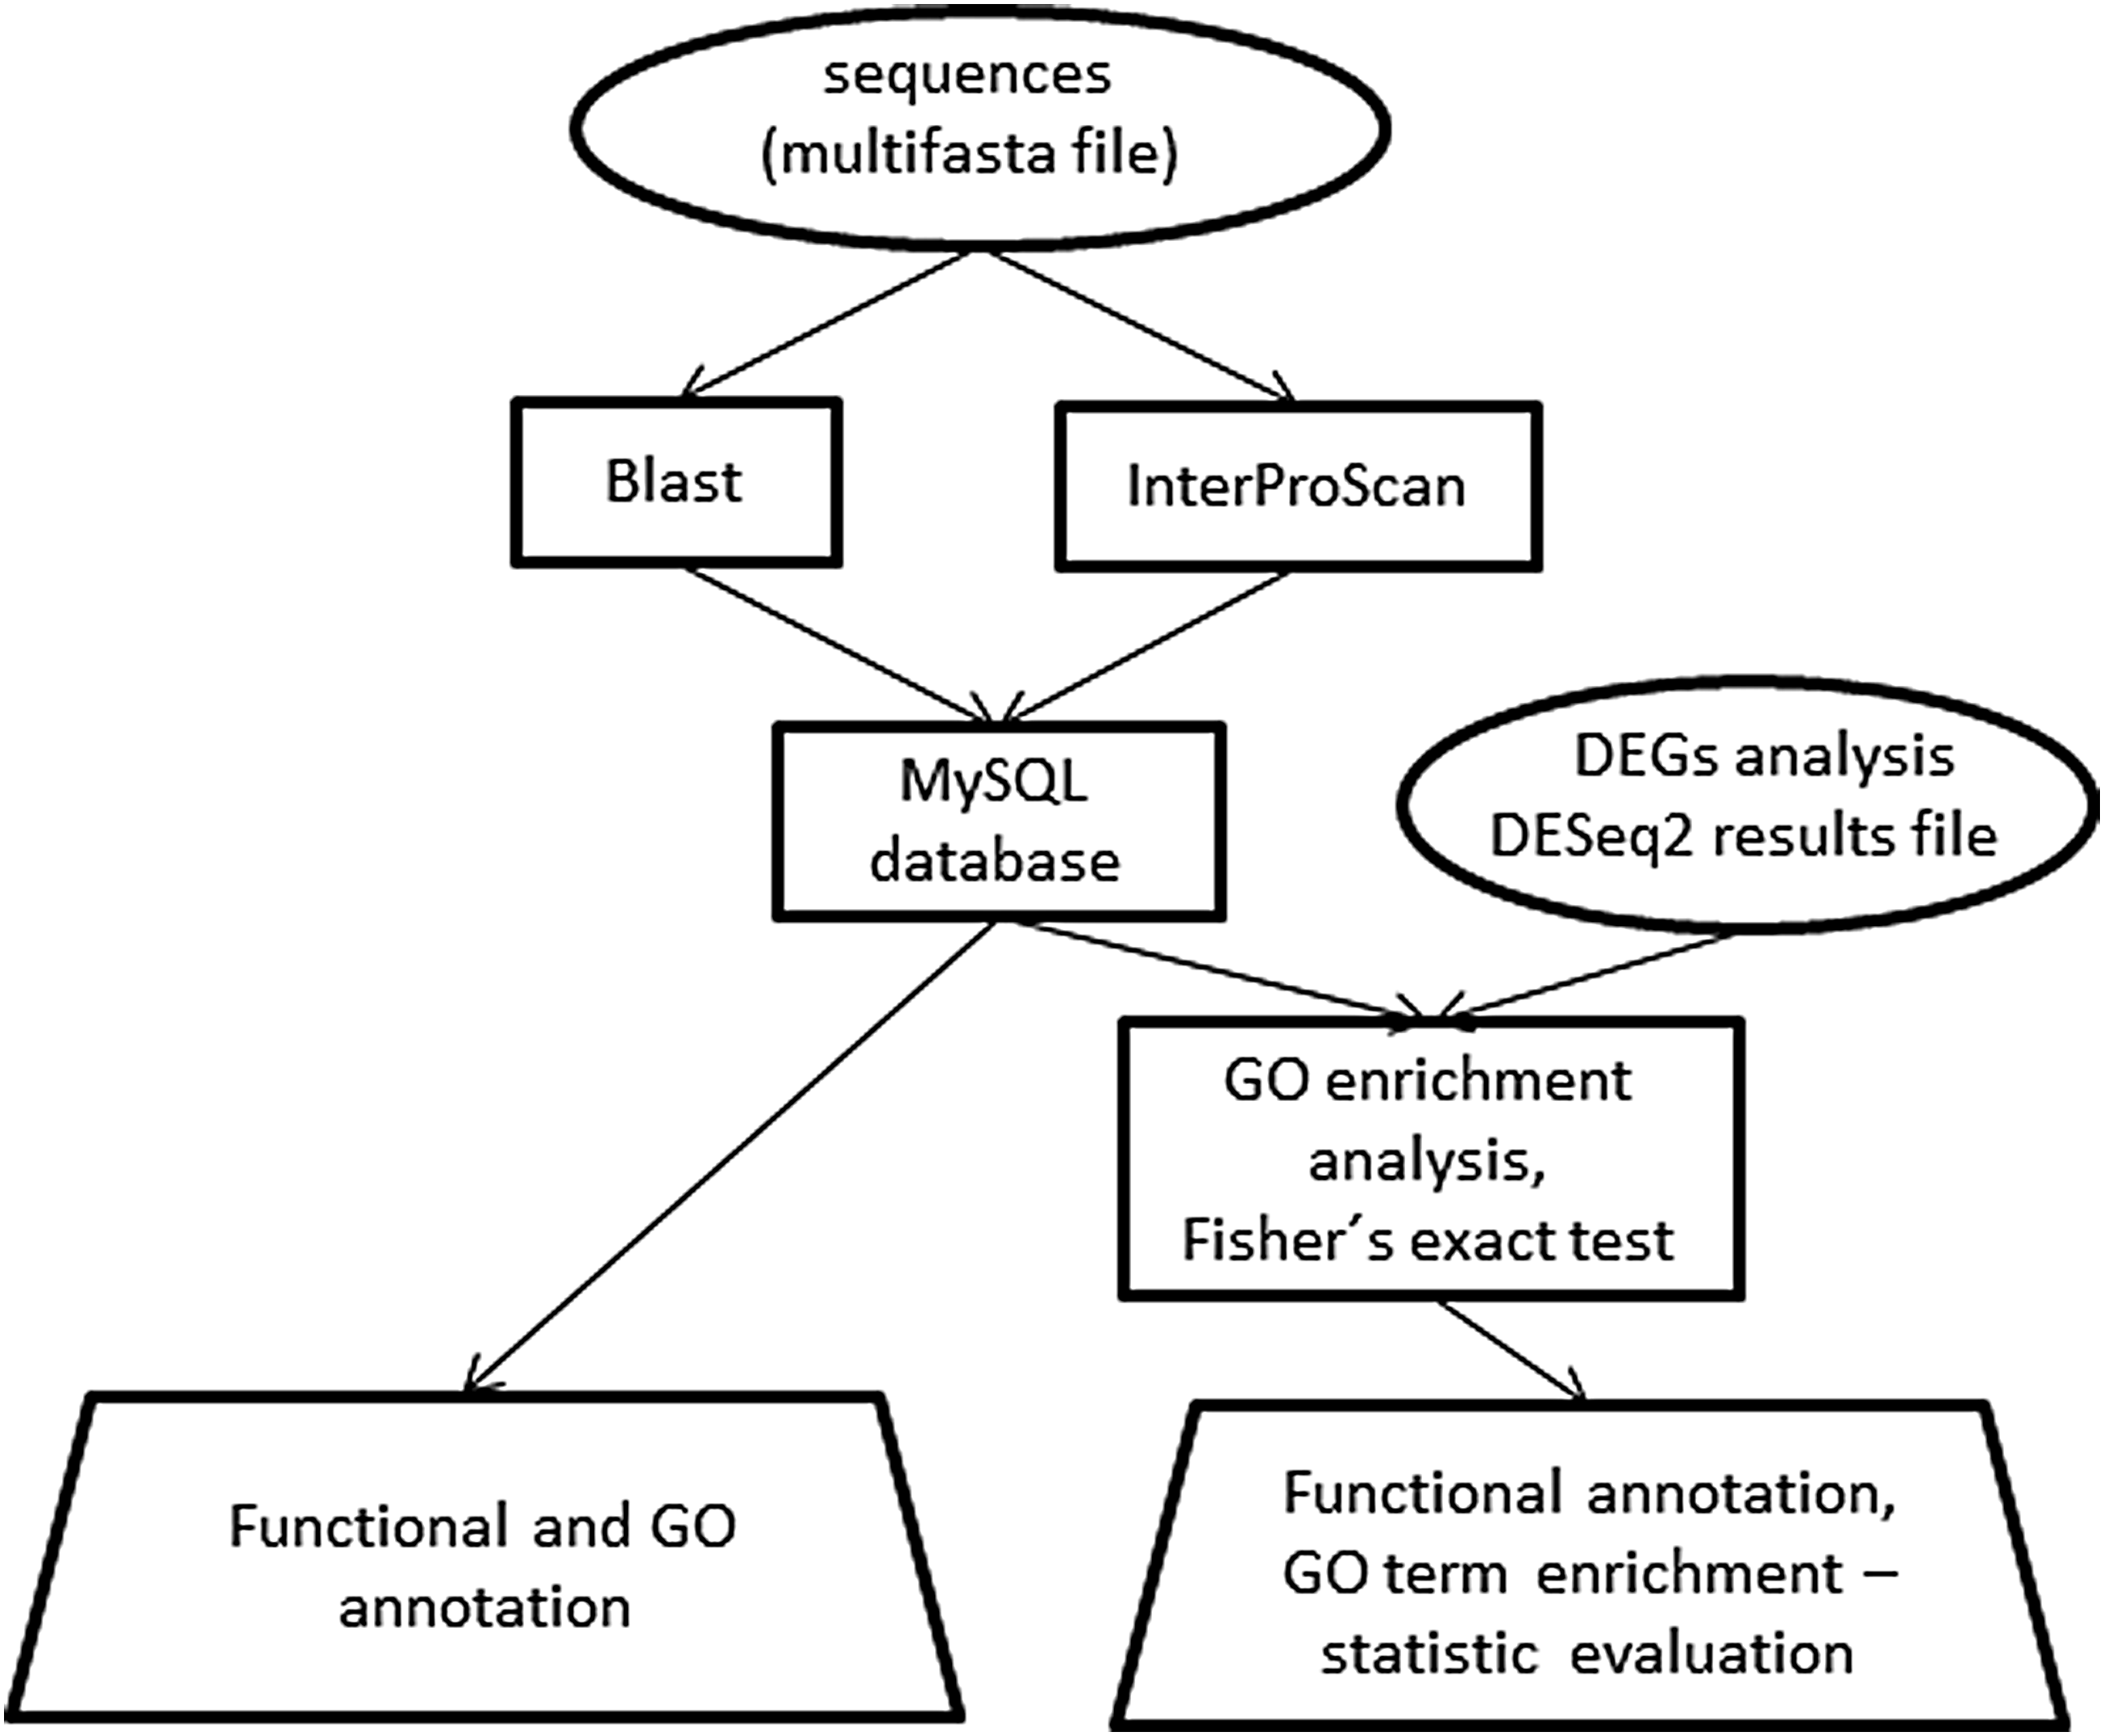
Simplified scheme of SATrans annotation and analysis process. Ellipses—input files, rectangles—data storage and analysis processes, trapezium—output files. DEGs, differentially expressed genes; GO, gene ontology.
1. The process of functional annotation is carried out in the “create” mode and requires providing as an input a multi-FASTA file containing sequences to be analyzed (e.g., an entire transcriptome). For this purpose, SATrans uses two external services, BLAST (https://www.ncbi.nlm.nih.gov) and InterProScan (https://www.ebi.ac.uk/interpro/). The two can be run in two parallel procedures. Both services (BLAST and InterProScan) produce XML output, which is stored in MySQL database and can be used as an input for further analysis. The results of the functional annotation can be exported using the “export” mode. Output files are provided separately for the BLAST and InterProScan results as well as for the GO annotation.
2. The functional annotation stored in the MySQL database can be paired with information about the differential gene expression coming from a separate analysis performed by the DESeq2 program (Love et al., 2014). The DESeq2 results in csv format serve as the input file, and the analysis is carried out in “analysis” mode. At this step, the basic statistics about the significantly DEGs is calculated with respect to their GO terms. For example, the ratio is provided for affected/all genes belonging to the selected GO term. Moreover, the significance of the differential expression of each GO term is calculated using Fischer's exact test (Fisher, 1935) (for details see the SATrans manual). Other analyses provided are the mean number as well as the minimum and maximum values of log2foldChange (depending on whether genes are upregulated or downregulated) for the selected GO term. The results of the analysis are summarized in the main output file, which is the GO analysis output file. This mode generates two other output files: Histogram and Annotation file. These provide a user-defined (by cutoff values) overview of the analyzed data, consisting of log2foldChange values (originally calculated by DESeq2) for each GO term or functional annotation (results of BLAST and InterProScan) for each gene from the input DESeq2 file.
2.2. Error Handling
SATrans handles any server errors occurring during the sequence search by stopping the process for ten seconds and then retrying with the next query sequence. A new search for the query sequence with error will be repeated after all query sequences are searched by BLAST and InterProScan. Maximal count of the repeated searches is five. More than five errors per ten searches cause a further 60-second pause before trying a retrieval operation again. If the number of failures is more than 60 per 100 sequences, the program is stopped permanently. All errors are reported in the error.log file and the terminal window. Stopping the program by the user at any time will not affect results already stored in the database. Stopped analysis can be resumed by the “repair” mode using the input FASTA file.
3. Results And Discussion
3.1. Case study
To demonstrate the SATrans function and usage in real biological studies, we have chosen the study made by Majeská Čudejková et al. (2016). In this study, the authors performed qualitative and quantitative transcriptome analysis of several strains of ergot fungus Claviceps purpurea. For the purpose of the current case study, we have chosen to functionally reanalyze results of the differential gene expression between the mycelial and sclerotial tissues of C. purpurea strain 20.1, (Majeská Čudejková et al., 2016). The whole C. purpurea transcriptome (cds sequences) was downloaded from the http://fungi.ensembl.org/Claviceps_purpurea_20_1/Info/Index and annotated using the “create” mode with default parameters. Annotation results have been exported as text file using “export” mode and are available from the corresponding author on request. These results were subsequently used for functional analysis of DEGs. The input csv file for the “analysis” mode (Majeská Čudejková et al. 2016; Supplementary Table S1) has been provided to the software and the options log2fold change, cutoff value, p adjusted cutoff value, and format of output file remained default. The detailed results of “analysis” mode have been saved as the text files (Supplementary Table S1.1–S1.6) and the summary of the results is provided in the stat.log file (Supplementary Table S2).
Claviceps genome contains 8825 predicted genes. SATrans functionally annotated 7595 sequences, whereas 1230 sequences remained unannotated. Among the SATrans annotated sequences, 3930 have NCBI “nt” database BLAST annotation, 7433 have InterProScan annotation, and 4625 have GO annotation comprising 119 885 GO terms. From the total number of 629 DEGs, 548 DEGs were functionally annotated by SATrans, of these 257 have NCBI “nt” database BLAST annotation, 537 have InterProScan annotation, and 311 have GO annotation, whereas 81 DEGs remained unannotated. When we compare the SATrans annotation with the original annotation of DEGs published in Majeská Čudejková et al. (2016) (407 functionally annotated DEGs), we obtained a clear improvement of the annotation by 22%. The GO analysis of the DEGs, provided in the output GO analysis files, revealed that regulation of 95 GO terms was significantly changed between the examined tissues. When analyzed separately downregulated and upregulated genes, 69 and 72 GO terms were significantly down- and upregulated, respectively. Among the downregulated processes were mostly processes associated with membrane transport, especially ion transport. Whereas upregulated processes were principally associated with secondary metabolism—toxin biosynthesis. These results are in great compliance with the metabolic changes coupled with sclerotial differentiation (Majeská Čudejková et al., 2016).
3.2. Comparison of SATrans with BLAST2GO, TRAPID, and MERCATOR
We have compared the features of different annotation tools: two desktop tools (SATrans and BLAST2GO) and two web-based tools (TRAPID and MERCATOR), which are summarized in Table 1. In the case of BLAST2GO, only the BASIC freeware version was used, since other tools are also freeware. The comparison of the features shows that SATrans is the only freeware annotation tool providing DEGs GO analysis integration. Compared with web-based tools, it provides sequence similarity search in any database of interest, not only in the default ones, which is very likely the reason why it provides better functional annotation results (Table 2).
Feature Comparison of the Transcript Analysis Freeware Tools
DEGs, differentially expressed genes; GO, gene ontology; ORF, open reading frame.
Comparison of the Results of the Annotation of 5000 Sequences Performed by Different Annotation Tools
The data set—5000 sequences were randomly selected from the barley transcriptome stored in the Ensembl database.
We conducted a series of benchmarks to assess both runtime and number of annotated genes for selected annotation tools. As a representative data set, we used 5000 transcripts randomly selected from the barley transcriptome stored in the Ensembl database. The tools were launched with default parameters and the results are summarized in Tables 2 and 3. Comparing the quality of the annotation (number of annotated sequences), SATrans provided the same results as BLAST2GO-BASIC, which were obviously better than TRAPID or MERCATOR (Table 2). When analyzing runtime, SATrans needed much longer time to annotate the same number of sequences compared with web-based tools TRAPID and MERCATOR (Table 3). However, when compared with the BLAST2GO-BASIC, SATrans performed its job much faster than BLAST2GO-BASIC, annotating 5000 sequences in 2131 minutes compared with 10,890 minutes required by BLAST2GO-BASIC. The greater efficiency of SATrans compared with BLAST2GO is very likely caused by parallel running of BLAST and InterProScan and better control of deadlock, SATrans not allowing sequence similarity search running over 15 minutes. Considering the runtime and the result quality performance, SATrans seems to be the best tool to annotate a large number of sequences, however, in contrast to other analyzed tools it requires a basic knowledge of a Linux operating system and does not provide a graphical user interface at the current version.
Comparison of Computational Time for Different Annotation Tools
Time is measured in minutes. Data set represents randomly selected transcripts from barley transcriptome stored in the Ensembl database.
4. Conclusion
SATrans is a novel bioinformatic tool developed to contribute to understand and to biologically interpret the RNAseq data. This software is ideal for the biologists performing transcriptome research because (1) it provides fast and reliable functional annotation of nucleotide/amino acid sequences; (2) based on the GO annotation it functionally analyzes differential gene expression at the whole transcriptome level; (3) it is suitable for any organism, and it is especially helpful for the nonmodel species; (4) it requires only a basic knowledge of a Linux operating system and provides outputs in a user-friendly form (csv file); (5) it is appropriate for analyzing large data files (containing whole transcriptomes) on a personal computer or notebook if the remote NCBI BLAST is used; and (6) it provides the possibility for additional analysis of data stored in the MySQL database. Moreover, the SATrans is a freeware, and in the future versions it might be easily upgraded and extended by new modules, thereby giving it great potential for additional future tasks. The SATrans source code and the manual are freely available at https://www.prf.upol.cz/department-of-molecular-biology/links/
Footnotes
Acknowledgments
We thank Petr Galuszka for providing insight and expertise that greatly assisted the research. This work was supported by the Czech National Agency for Agricultural Research (grant no. QJ1510098).
Author Disclosure Statement
The authors declare that no competing financial interests exist.
References
Supplementary Material
Please find the following supplemental material available below.
For Open Access articles published under a Creative Commons License, all supplemental material carries the same license as the article it is associated with.
For non-Open Access articles published, all supplemental material carries a non-exclusive license, and permission requests for re-use of supplemental material or any part of supplemental material shall be sent directly to the copyright owner as specified in the copyright notice associated with the article.