
Abstract
Abstract
Studying the three-dimensional structure of chromosomes is an emerging field flourishing in recent years because of rapid development of experimental approaches for studying chromosomal contacts. This has led to numerous studies providing results of segmentation of chromosome sequences of different species into so-called topologically associating domains (TADs). As the number of such studies grows steadily and many of them make claims about the perceived differences between TAD structures observed in different conditions, there is a growing need for good measures of similarity (or dissimilarity) between such segmentations. We provide here a bipartite (BP) score, which is a relatively simple distance metric based on the bipartite matching between two segmentations. In this article, we provide the rationale behind choosing specifically this function and show its results on several different data sets, both simulated and experimental. We show that not only the BP score is a proper metric satisfying the triangle inequality, but also that it is providing good granularity of scores for typical situations occurring between different TAD segmentations. We also introduce local variant of the BP metric and show that in actual comparisons between experimental data sets, the local BP score is correlating with the observed changes in gene expression and genome methylation. In summary, we consider the BP score a good foundation for analyzing the dynamics of chromosome structures. The methodology we present in this study could be used by many researchers in their ongoing analyses, making it a popular and useful tool.
1. Introduction
Scientific studies of the cell nucleus and its structure started >100 years ago when embryologists were performing their experiments on the fertilized eggs and subsequent rapid cell divisions. In the past 50 years, after discovery of the DNA structure and its role, the topic of chromatin structure was considered to be of slightly lower importance, as the researchers have been mostly preoccupied with studying the DNA sequence of the genomes to uncover its function.
In recent years, genome conformation studies gained significant attention again, for at least two reasons. On the technical side, this is mainly due to development of Chromosome Conformation Capture, or 3C technique (Dekker et al., 2002), and its derivative methods such as Hi-C (Lieberman-Aiden et al., 2009), 4C (Simonis et al., 2006; Zhao et al., 2006), or 5C (Dostie et al., 2006). In contrast, a perhaps more important reason why there is so much interest in the newly acquired data on chromosomal conformation is that current efforts in explaining the function of noncoding regulatory elements without the information on the contacts between enhancers and promoters are proving it to be an extremely difficult problem (Wilczynski and Furlong, 2010). The problem of gene regulation is difficult even given that the positions of such elements can be identified by DNAse Seq or related techniques (Song et al., 2011). This leads to the situation where many researchers are probing chromosome structure using 3C-related techniques and the research in the field is progressing rapidly. This, as always is the case in blooming scientific fields, leads to new technical challenges in describing the chromosomal structures and comparing them between cell types and experimental conditions.
Going back to the technical side of the chromosome capture techniques, in the Hi-C assay DNA is cross-linked, shared into pairs of fragments, and ligated. Ligated fragments are then pulled down and merged with adapters. Finally, fragments are paired-end sequenced to produce library of paired reads, indicating pairs of genomic regions that are in proximity in the three-dimensional (3D) space of the nucleus. Even though the method is not exact in the sense of mapping the 3D distance to the probability of ligation followed by successful identification of a pair, it has been proven to be very reproducible provided that we are interested in the average contact frequency over a large pool of cells statistically sampled by deep sequencing (Rao et al., 2014). Single cell Hi-C techniques are much more recently developed, but there is significant progress there as well and we should expect soon to be able to compare chromosomal contact structures also between individual cells (Nagano et al., 2013, 2017). Also, other methods, which are not ligation dependent, have been developed for probing chromosomal contacts, most notably the genome architecture mapping results corroborate the Hi-C-derived chromosomal structures (Beagrie et al., 2017).
Once the sequencing is completed and contacting pairs of segments are identified, usually the analysis of interactions is based on construction of contact maps: symmetric matrices that summarize contacts between bins of a predefined size. If we are interested in cis-chromosomal contacts, which is usually the case, such large genome-wide matrix is usually broken down into separate matrices for each chromosome. In these matrices, each cell contains the number of interactions between two particular regions of the same chromosome. Such matrices usually need to be normalized, to account for several technical issues, such as GC content bias and diverse mappability across genomic regions that lead to nonuniform read coverage along chromosomes. There are methods that are specialized to a given Hi-C protocol (Yaffe and Tanay, 2011) as well as more generic normalization methods based on the assumption of uniform coverage (Imakaev et al., 2012).
In recent years, many studies have suggested that in addition to the well-established chromosomal compartments representing the division of chromatin into active euchromatin and inactive heterochromatin, there exists a finer structure of topologically associating domains (TADs) (Dixon et al., 2012; Dekker and Heard, 2015). The presence of TAD-like structures was confirmed in almost all metazoan Hi-C data, with notable exclusion of some chromosomes in Caenorhabditis elegans (Crane et al., 2015), whereas there appears to be no sign of TADs in yeast and plants (Feng et al., 2014). The majority of animals, including all studied mammals, show significant concentrations of contacts into TADs and these appear to be largely conserved between species and conditions (Dixon et al., 2012). Even though, mostly due to variability in Hi-C protocols and TAD-calling methods, it still remains a challenge to assess physical properties and biological function of TADs in individual cells, it was shown beyond doubt that regions of genome demarcated by TADs are indeed correlated with gene regulation (Flyamer et al., 2017). In particular, it was shown that a deletion of TAD boundary regions may lead to different developmental disorders (Nora et al., 2012; Andrey et al., 2013; Lupiáñez et al., 2015; Bianco et al., 2018).
Numerous studies exploiting Hi-C to compare genome conformation between different cell types or conditions were conducted (Filippova et al., 2014; Le Dily et al., 2014; Chandra et al., 2015; Dixon et al., 2015). The purpose of such analyses is to capture differences in spatial organization of chromatin and its relationships with gene expression or epigenetic modifications. One approach is to spot and quantify regions of chromosome where TAD arrangement is (dis)similar between two experiments. A common method for this purpose is to count number or overlapping TAD boundaries that was used among others by Dixon et al. (2012), Barutcu et al. (2015), and Fraser et al. (2015).
However, this approach suffers one serious disadvantage that large domains with relatively small shift in their boundaries contribute to lowering the overall dissimilarity as much as small domains with relatively large shifts. Another approach that is not as boundary-centric is by measuring variation of information (VI) between different TAD segmentations as used in Filippova et al. (2014). This approach, however, suffers from the fact that it does not take into account the linear structure of the genome and usually overestimates the deviation from the randomized control and, therefore, overestimates the TAD structure conservation. Given the rapid advancement of the experimental research in the field and constantly growing flow of new data with TAD structures, it is important to have a proper metric to compare different experimental results as well as different computational methods for TAD detection. In perfect scenario, such dissimilarity measure should be a proper metric satisfying triangle inequality.
In this study, we present new distance measure for comparing TAD sets and prove that our measure fulfills metric properties. We use simulated and real data to show that our metric is able to capture interesting properties of different domain sets. We also compared the bipartite (BP) score with a widely used approach that measures similarity between chromosome segmentations as a function of the number of overlapping boundaries. The outcome demonstrates smoother behavior of the BP score allowing for more precise analysis of chromosome segmentations. Finally we present how our metric can be used to estimate (dis)similarity of subchromosomal regions, enabling for more in depth analysis.
2. Results
2.1. BP distance
In this section we give the definition of BP distance and explain notation. Precise definitions can be found in Supplementary Material.
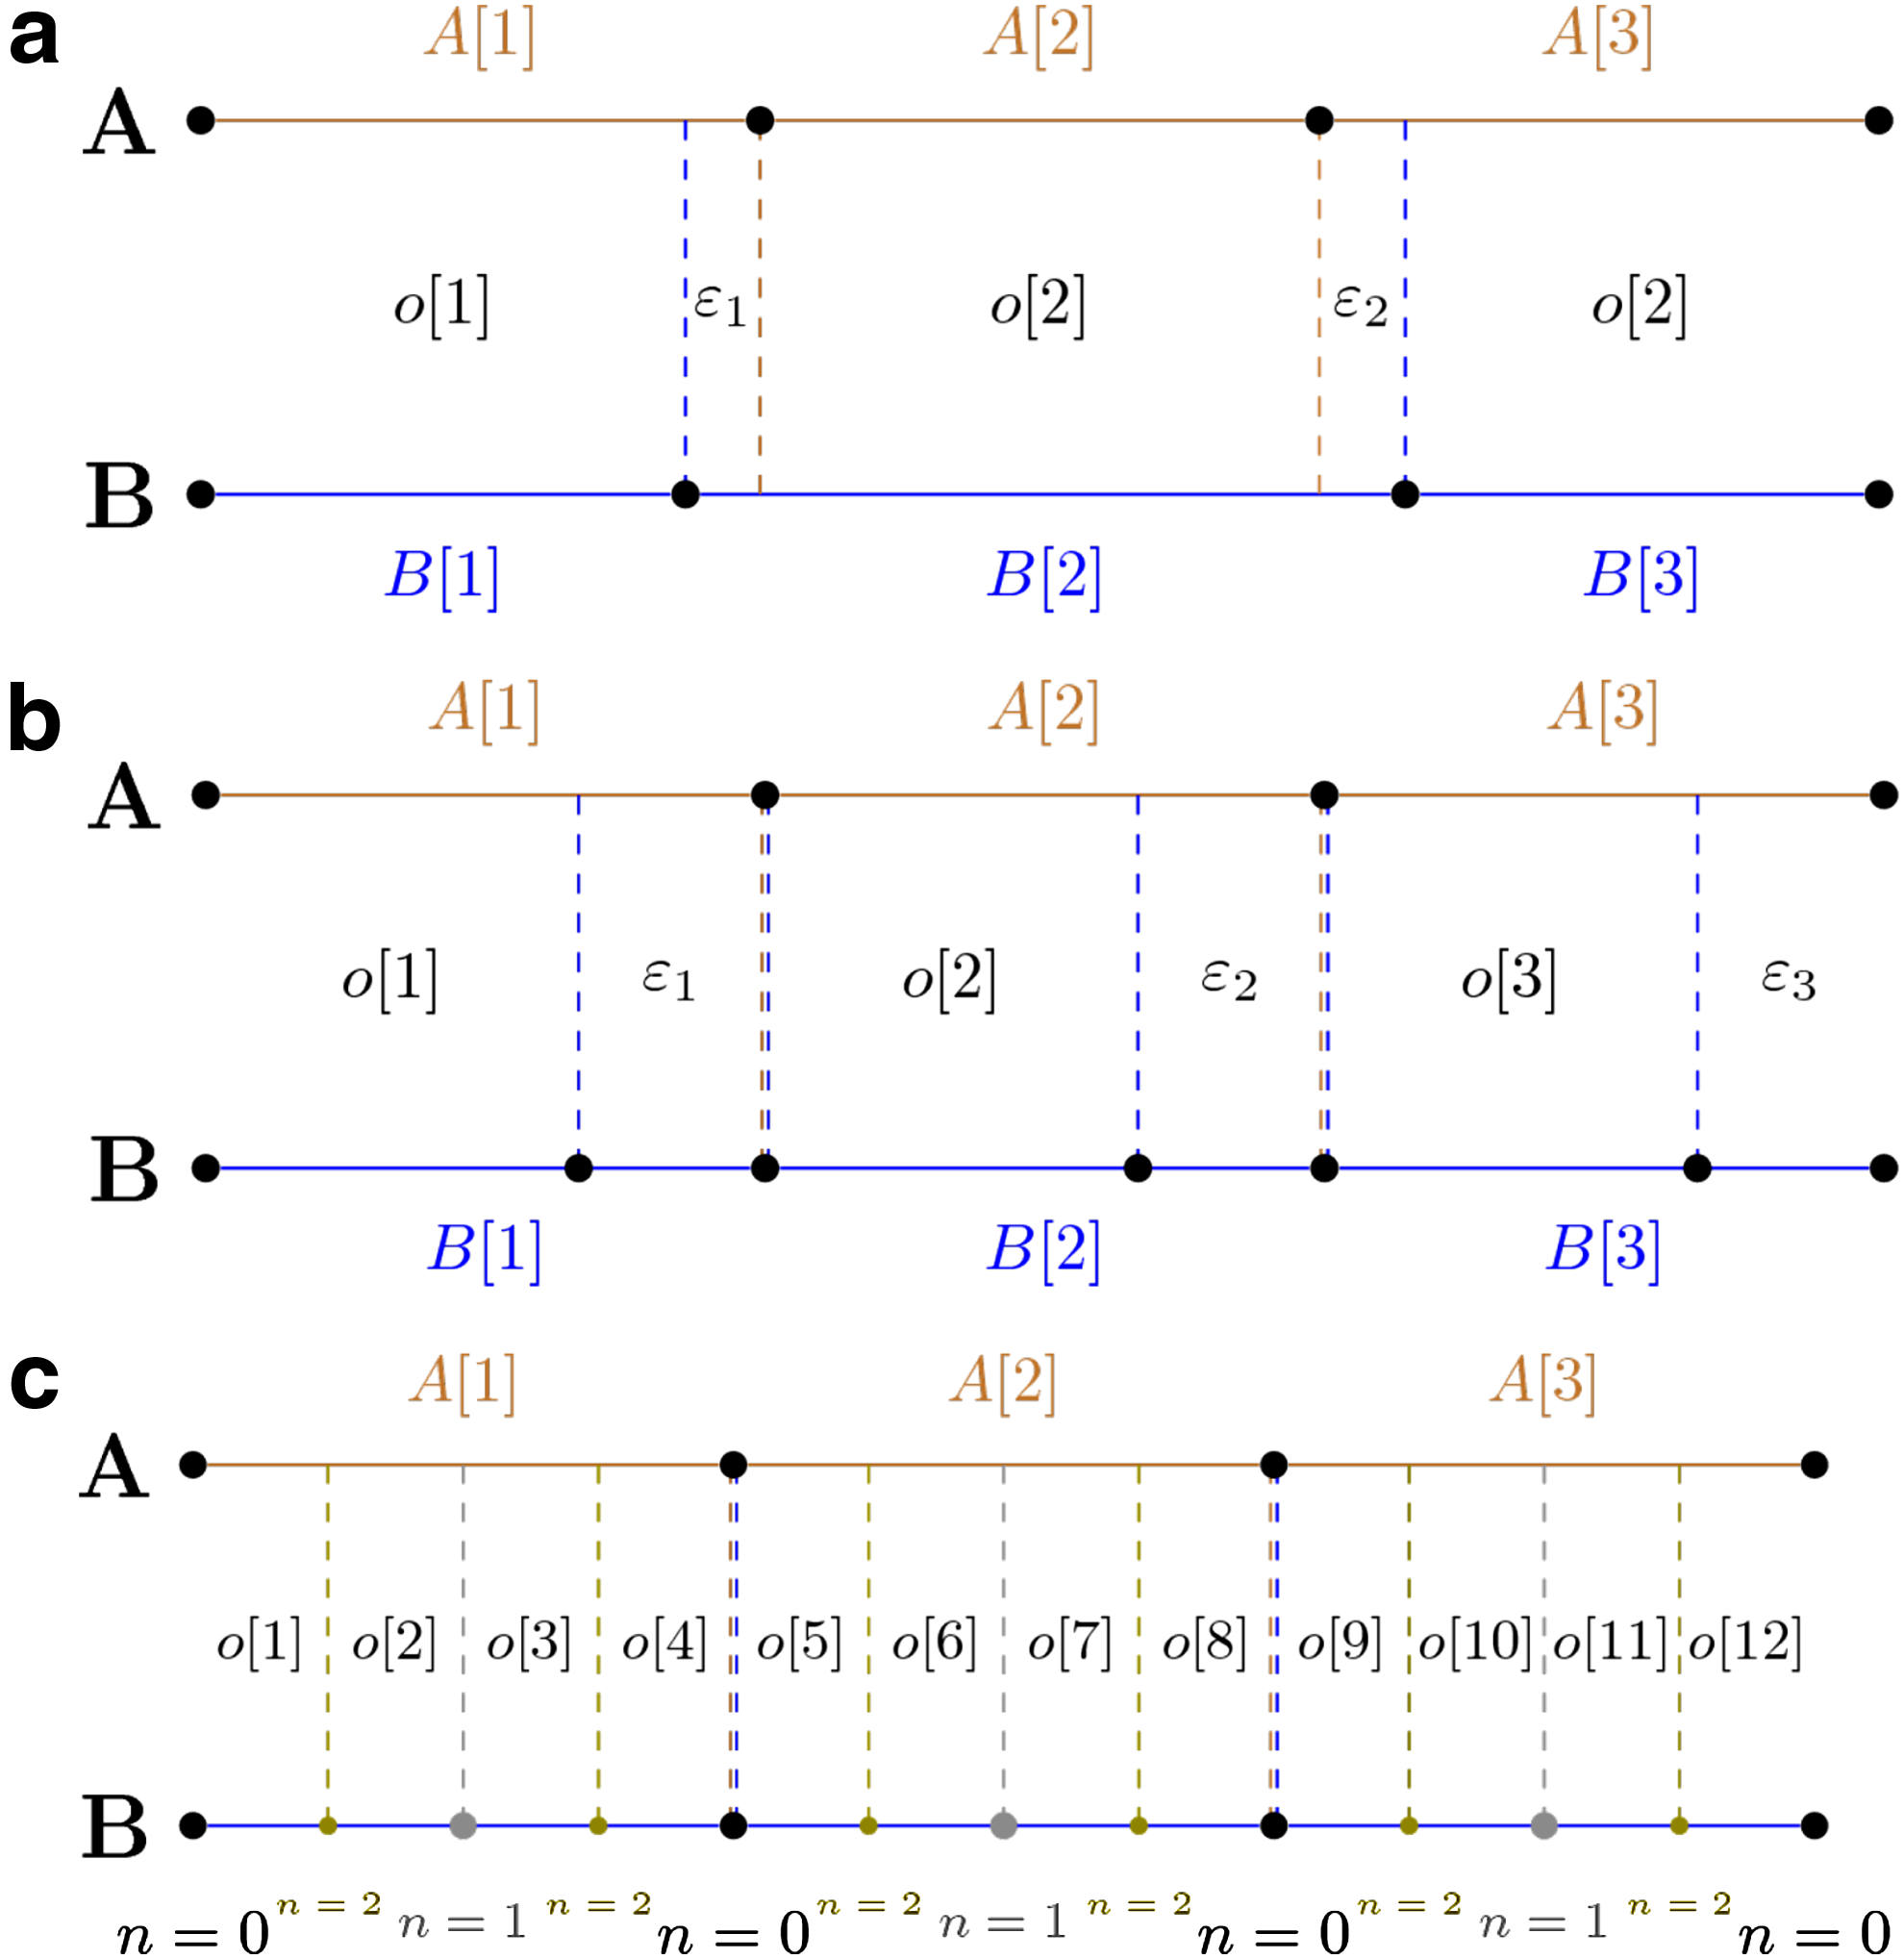
Let A and B define two intervals of equal length N. Each of them is partitioned on subintervals
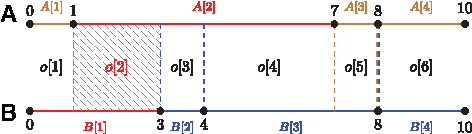
Chromosome partitioning and the induced segmentation. Red domains
where The ratio of overlap (segment) length divided by the length of longer subinterval (domain) that induced this overlap expresses the extent of rearrangement between a pair of domains. The ratio of overlap length divided by the overall length of interval (N) expresses the weight of given match/mismatch—larger regions contribute more to overall score than smaller regions.
The proof can be found in Supplementary Material. Hereunder we present some properties of function Every change that is introduced has proportional impact to the length of the interval affected. Inclusions, deletions, and shifts are treated equally. We can compare domain sets of different sizes.
The mentioned properties help avoid problems, which arise in alternative TADs similarity measures, where one assesses similarity based on the number of TAD boundary overlaps across chromosome (see the following section, “Comparison with existing methods”).
2.2. Comparison with existing methods
To demonstrate advantage of our metric over boundaries overlap count approach, we simulated artificial sets of TADs. We wanted to ensure that TAD length resembles real data distribution. To achieve this, we used negative binomial distribution to fit TAD length distribution of human chromosome 1 embryonic stem cell (ESC) TADs determined using dynamic programming (DP) approach (Filippova et al., 2014). Then we used the fit to produce 600 TADs—the approximate number of TADs in a real data set. Next we generated match sets according to three scenarios:
New boundary at Binary boundary additions—
Moreover, each of the mentioned cases is replicated three times with increasing parameter
In addition, we compare our metric with VI metric adopted to assess similarity of segmentation as described in Filippova et al. (2014).
For each scenario and possible parameter value, we report three numbers (Fig. 3): our distance (referred to as BP), Jaccard index distance (referred to as JI), and VI distance. The JI distance is calculated by dividing the number of TAD boundary overlaps between A and B by the number of all boundaries (overlaps are counted once) and subtracting the resulting fraction from 1. Calculation of VI distance is described in Supplementary Material.

Comparison with JI and VI distance. The captions report the type of metric used to compare partitions. The VI distance is scaled by
When the true location of TAD boundaries is shifted (
2.3. Differentiating technical from biological replicates data
To demonstrate usefulness of our metric, we present a case where one might be interested in assessing structural similarities genomewide for multiple samples. We selected publicly available sets of Hi-C data consisting of six cell lines: ESC, mesenchymal stem cell (MSC), mesendoderm cell (MDC), neural progenitor cell (NPC), trophoblast-like cell (TDC), and IMR90 (Dixon et al., 2012, 2015). ESC line was available in two samples from separate experiments (Dixon et al., 2012, 2015), each of which (as well as remaining cell lines) in two technical replicates. We processed each data set using Armatus software (Filippova et al., 2014) to produce sets of TADs. Finally, we made pairwise comparisons for every pair of TAD sets separately for each chromosome. Figure 4a illustrates comparisons divided on two categories: within cell type and between cell types for BP metric (left), JI metric (center), and VI metric (right). As can be seen, all metrics discriminate between two groups under consideration, that is, the scores of within cell type comparisons are consistently lower than between cell type comparisons.
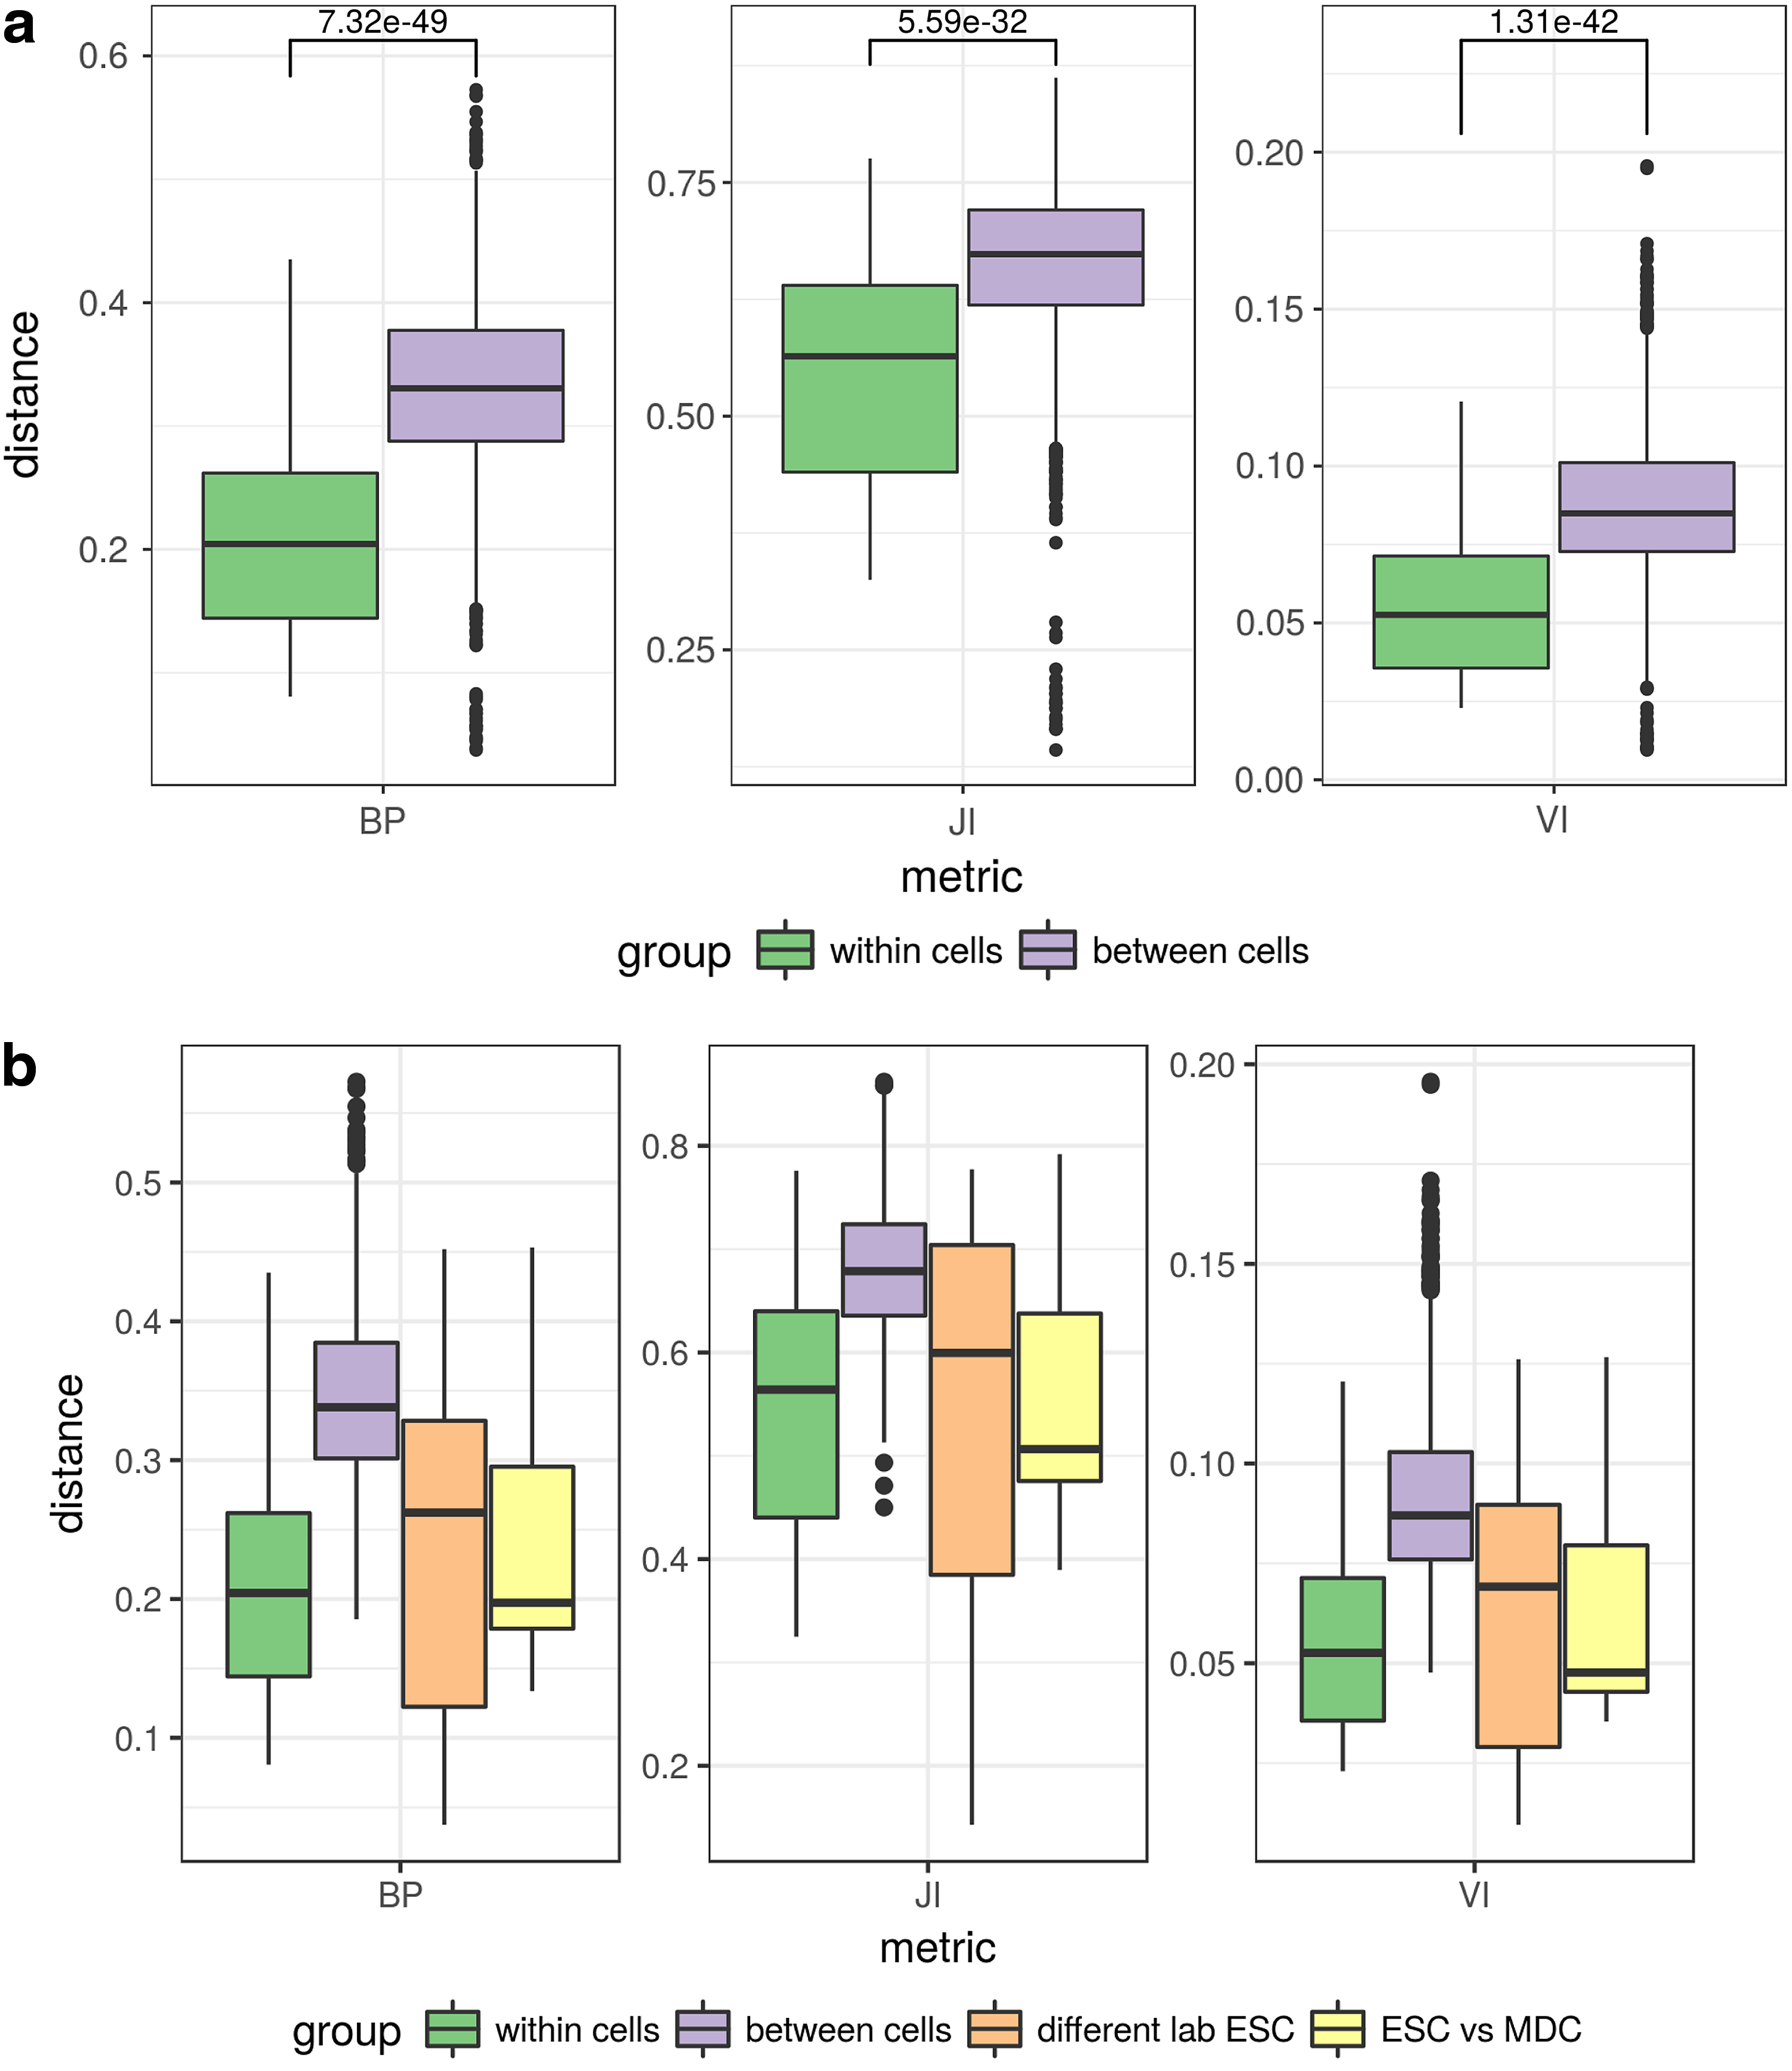
Pairwise comparisons of real Hi-C data sets with different metrics. Each boxplot represents a distribution of distances between pairs of partitions of every chromosome (calculated individually) assigned to different groups. (
However, the distributions are substantially overlapping. We have looked more deeply into this issue and it seems that the majority of unexpected values can be attributed to ESC lines from different laboratories (higher variability) and to ESC versus MDC comparisons (lower variability than expected). After putting these pairs in separate groups (Fig. 4b), it seems more plausible to put them into different categories than initially, since ESC versus MDC comparisons seem to be drawn from the within cell type distribution, whereas ESC cells between laboratories exhibit much higher variance. This is consistent with the reports on the differential chromatin organization between cell lines presented in Dixon et al. (2015).
Although all metrics give significant discrimination, we note that the significance of the difference, as well as the separation between the two groups, is better for the VI and BP scores than for the JI. Of the two metrics with better separation, BP score is giving slightly lower p value; however, this is unlikely to be a difference of practical importance. Similar behavior is observed when comparing individual chromosomes (Supplementary Fig. S2).
2.4. Local BP score
Another potentially important application of comparing chromosomal segmentations is the search for locally reorganized fragments induced by two partitions for selected fragment of a chromosome. For example, to check whether differential gene expression or methylation pattern correlates with segmentation pattern. For this kind of analysis, we suggest to use local BP score—a measure associated with our metric. Local BP score of segment i is defined as
Local BP score satisfies
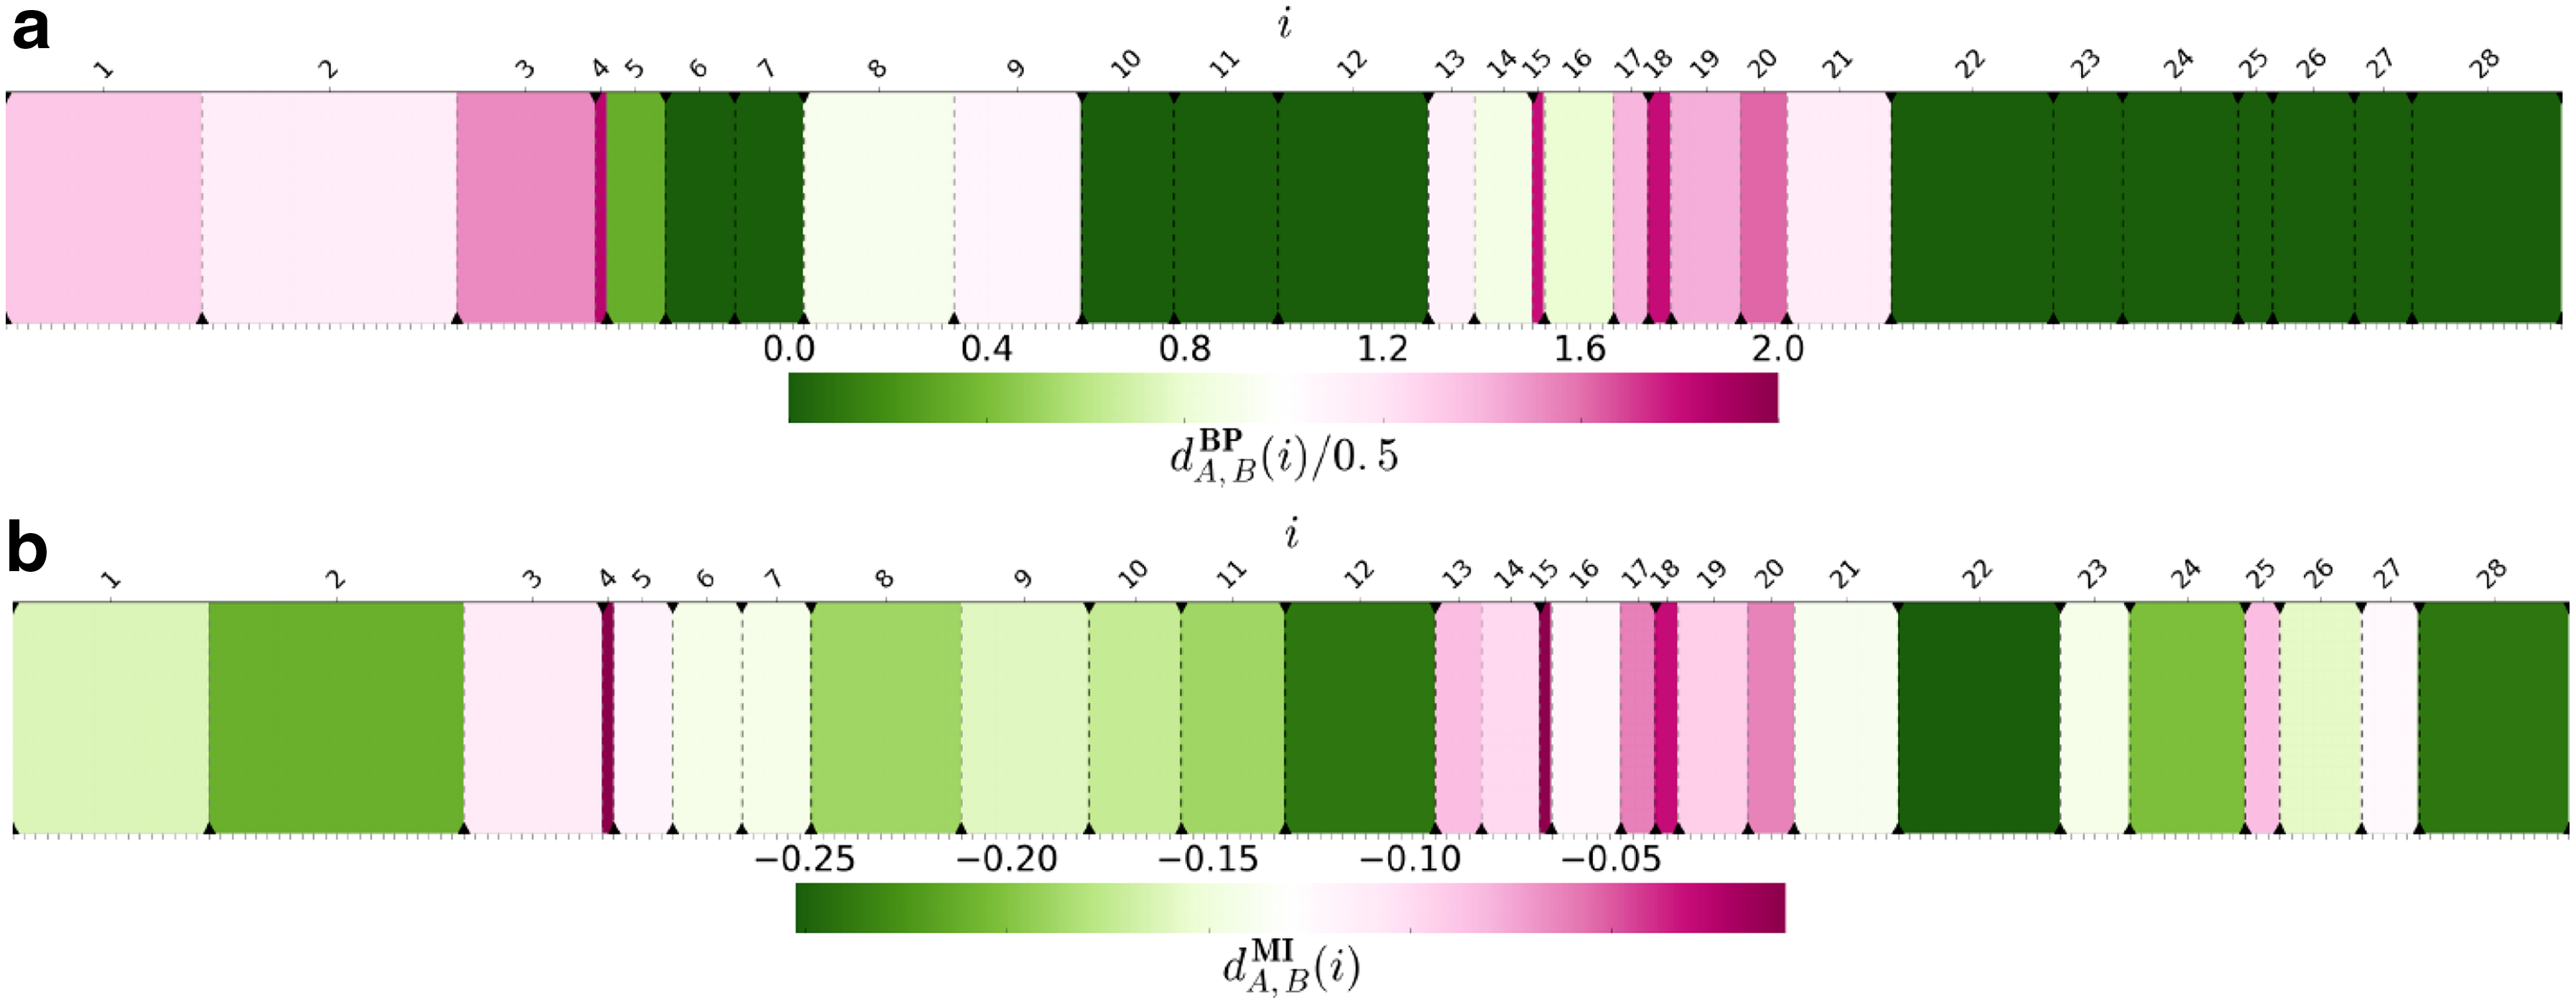
Local BP and MI scores.
Although Filippova et al. (2014) only consider the VI measure for global segmentation comparisons and do not discuss any local version of this measure, we thought that a natural measure of local segmentation related to VI would be local mutual information (MI) expressed with the following formula:
where
Based on hypothesis that TADs define regulatory landscapes and may limit activity of certain regulatory elements (Andrey et al., 2013; Nora et al., 2012), we decided to check whether there is a correlation between local score and differential gene expression or methylation pattern genome wide. To validate our prediction, we derived differential gene expression and methylation data from publicly available resources. We then created all by all pairing of Hi-C data sets for available cells, and for each pair we assigned local BP and MI scores and fold change of gene expression or methylation for every gene. Owing to large number of genes, we aggregated genes into 30 quantiles based on the local score value to reduce noise. Then for each group, we plotted its median quantile local score versus median fold change. This revealed correlations between gene expression or methylation fold change and the local domain rearrangement score (Supplementary Figs. S3 and S4).
As can be seen, the relationship is not strong, although visible and significant most of the time. In 8 out of 15 cases when using local BP score and 12 out of 15 cases when using local MI score, the relationship between local score and gene expression fold change (measured with Pearson correlation) has p value <0.05 (Supplementary Table S1). The trend is even more pronounced between methylation fold change versus local score, in which situation all 20 cases have significant relationship when using local BP score, and there are 16 significant cases when using local MI score (Supplementary Table S2).
3. Discussion
In this article, we have considered the problem of comparisons between different segmentations of chromosomes into TADs. Currently, such comparisons are mainly based on comparing the locations of TAD boundaries and quantification of discrepancies between two sets of such locations. This is usually done using the Jaccard coefficient or some analogous function. We show in this study that under a number of realistic scenarios, where the differences between TAD segmentations are driven by experimental noise, this is not an effective strategy. By utilizing different
We provide an alternative scoring scheme, so called BP score, deriving its name from the bi-partite segment overlap graph. This score has several advantages over the JI. First, it is naturally scaling with the size of chromosomes and the resolution at which the segmentation is done, that is any change in the TAD structure will contribute to the metric proportionally to its size. In addition, the method treats equally all kinds of changes (insertions, deletions, and shifts of domain boundaries) and can be meaningfully used to compare domain sets with different granularity, that is, containing significantly different number of domains. On the technical level, the BP score is a proper distance metric, which has advantages for applications that need symmetry or triangle inequality, including clustering methods. The global BP metric is similar in the applicability to the VI metric suggested for the task earlier (Filippova et al., 2014). Not only are these methods giving more sensible results than JI in the three simulated scenarios of
In addition to the global VI and BP scores, we propose the analysis of local versions of the two: local BP and local MI scores. The usefulness these local measures of domain rearrangement is supported by our analysis of experimental data. We show that in actual comparisons between different TAD segmentations performed on different cell lines, the regions with high local BP and local MI scores, that is, those identified by the BP and MI scores as the most rearranged, show the highest fold changes in gene expression and methylation changes. This might be very useful in uncovering the mechanisms connecting chromosome structure rearrangement to functional changes such as gene expression.
We provide an implementation of the BP, VI, and JI scores that allows all researchers to test them on their own data. The implementation of the BP score is relatively simple as it can be computed as a sum of local scores for each of the atomic segment induced from the two segmentations being compared. This allows also to identify local contributions to the BP score, therefore, leading to the identification of fragments of chromosomes that yield the most divergent parts of the chromosomes between the two segmentations under consideration. This might be specifically useful to the researches studying chromosomal domain dynamics, allowing them to focus their attention on parts of chromosomes that undergo the most dynamic TAD rearrangements.
4. Conclusion
All these results together show that the BP score is a valid metric for comparisons of TAD segmentations. It is superior to the widely used JI, and can be useful in many comparative studies of chromatin domains. Not only is the BP score a better metric than the JI for the global comparison of segmentations, but its local version can also give us an interesting measure of domain rearrangement that we show to be correlated with functional measurements.
We have focused our analyses of the BP score solely on its application to the TAD segmentations originating from Hi-C experiments. This is, however, not an exclusive application of this measure. Mathematically, there is nothing in the BP score that would limit its adoption in the field of other chromosome segmentation situations, such as haplotype inference, epigenetic domains, and many others.
Footnotes
Acknowledgment
This study was supported by the Polish National Science Centre grant decision No. (DEC 2015/16/W/NZ2/00314).
Author Disclosure Statement
The authors declare that no competing financial interests exist.
References
Supplementary Material
Please find the following supplemental material available below.
For Open Access articles published under a Creative Commons License, all supplemental material carries the same license as the article it is associated with.
For non-Open Access articles published, all supplemental material carries a non-exclusive license, and permission requests for re-use of supplemental material or any part of supplemental material shall be sent directly to the copyright owner as specified in the copyright notice associated with the article.