
Abstract
Sequence alignment is a fundamental concept in bioinformatics to distinguish regions of similarity among various sequences. The degree of similarity has been considered as a score. There are a number of various methods to find the statistical significance of similarity in the gapped and ungapped cases. In this article, we improve the statistical significance accuracy of the local score by introducing a new approximate p-value. This is developed according to Poisson clumping and the exact distribution of a partial sum of random variables. The efficiency of the proposed method is compared with that of previous methods on real and simulated data. The results yield a remarkable improvement in accuracy of the p-value in the gapped case. This is an evidence for the method to be considered as a prospective candidate for sequences comparison.
1. Introduction
Comparing query sequences with databases of known sequences is one of the most important research area in bioinformatics. There are many algorithms for aligning biological sequences, in which their results in the gapped and ungapped cases can be evaluated by some statistical methods.
Let
Statistical significance for the gapped case is derived from the ungapped case, in which its parameters are estimated by simulation and some other different methods, such as method of moments (Altschul and Gish, 1996), maximum likelihood (e.g., Bailey and Gribskov, 2002), and faster methods based on island approach (Bundschuh, 2002). In addition, previous empirical studies by Mott (1992), Waterman and Vingron (1994a), and Altschul and Gish (1996) showed that the extreme-value distribution can be applied in the gapped case. In 1999, a heuristic p-value was proposed using the greedy extension model (GEM) (Mott and Tribe, 1999). GEM is one of the most important means of this article. Siegmund and Yakir (2000) introduced a p-value in the gapped case by combining the results of Karlin and Dembo (1992) and Mott and Tribe (1999). Also, Zhang et al. (2000) introduced a greedy algorithm to align DNA sequences, which is faster than traditional methods. Fayyaz Movaghar et al. (2007) proposed a p-value for local score by dividing sequence to segments with length h when the gaps are allowed. Hassenforder and Mercier (2007) introduced a p-value for the local alignment score in the Markov framework. Chabriac et al. (2014) introduced a new method to derive asymptotic behavior of the local alignment score by using the Brownian motion. Also, statistical significance of the local alignment score with respect to length and position was studied by Lagnoux et al. (2016).
In Section 2, we review the GEM and the related concepts, then in Section 3, we describe our new p-value for the GEM, based on the exact and an approximate distribution of the local score in one and two sequences frameworks, respectively. Finally, in Section 4, the accuracy of our new p-value is assessed through simulated and real data.
2. Greedy Extension Model
In this section, we review the GEM in detail (Mott and Tribe, 1999). At first, some notations are presented.
2.1. Definitions and notations
Consider two sequences
As it is mentioned in Section 1,
Let
In dot matrix,
For a fixed d, a random walk is generated by the partial sum,
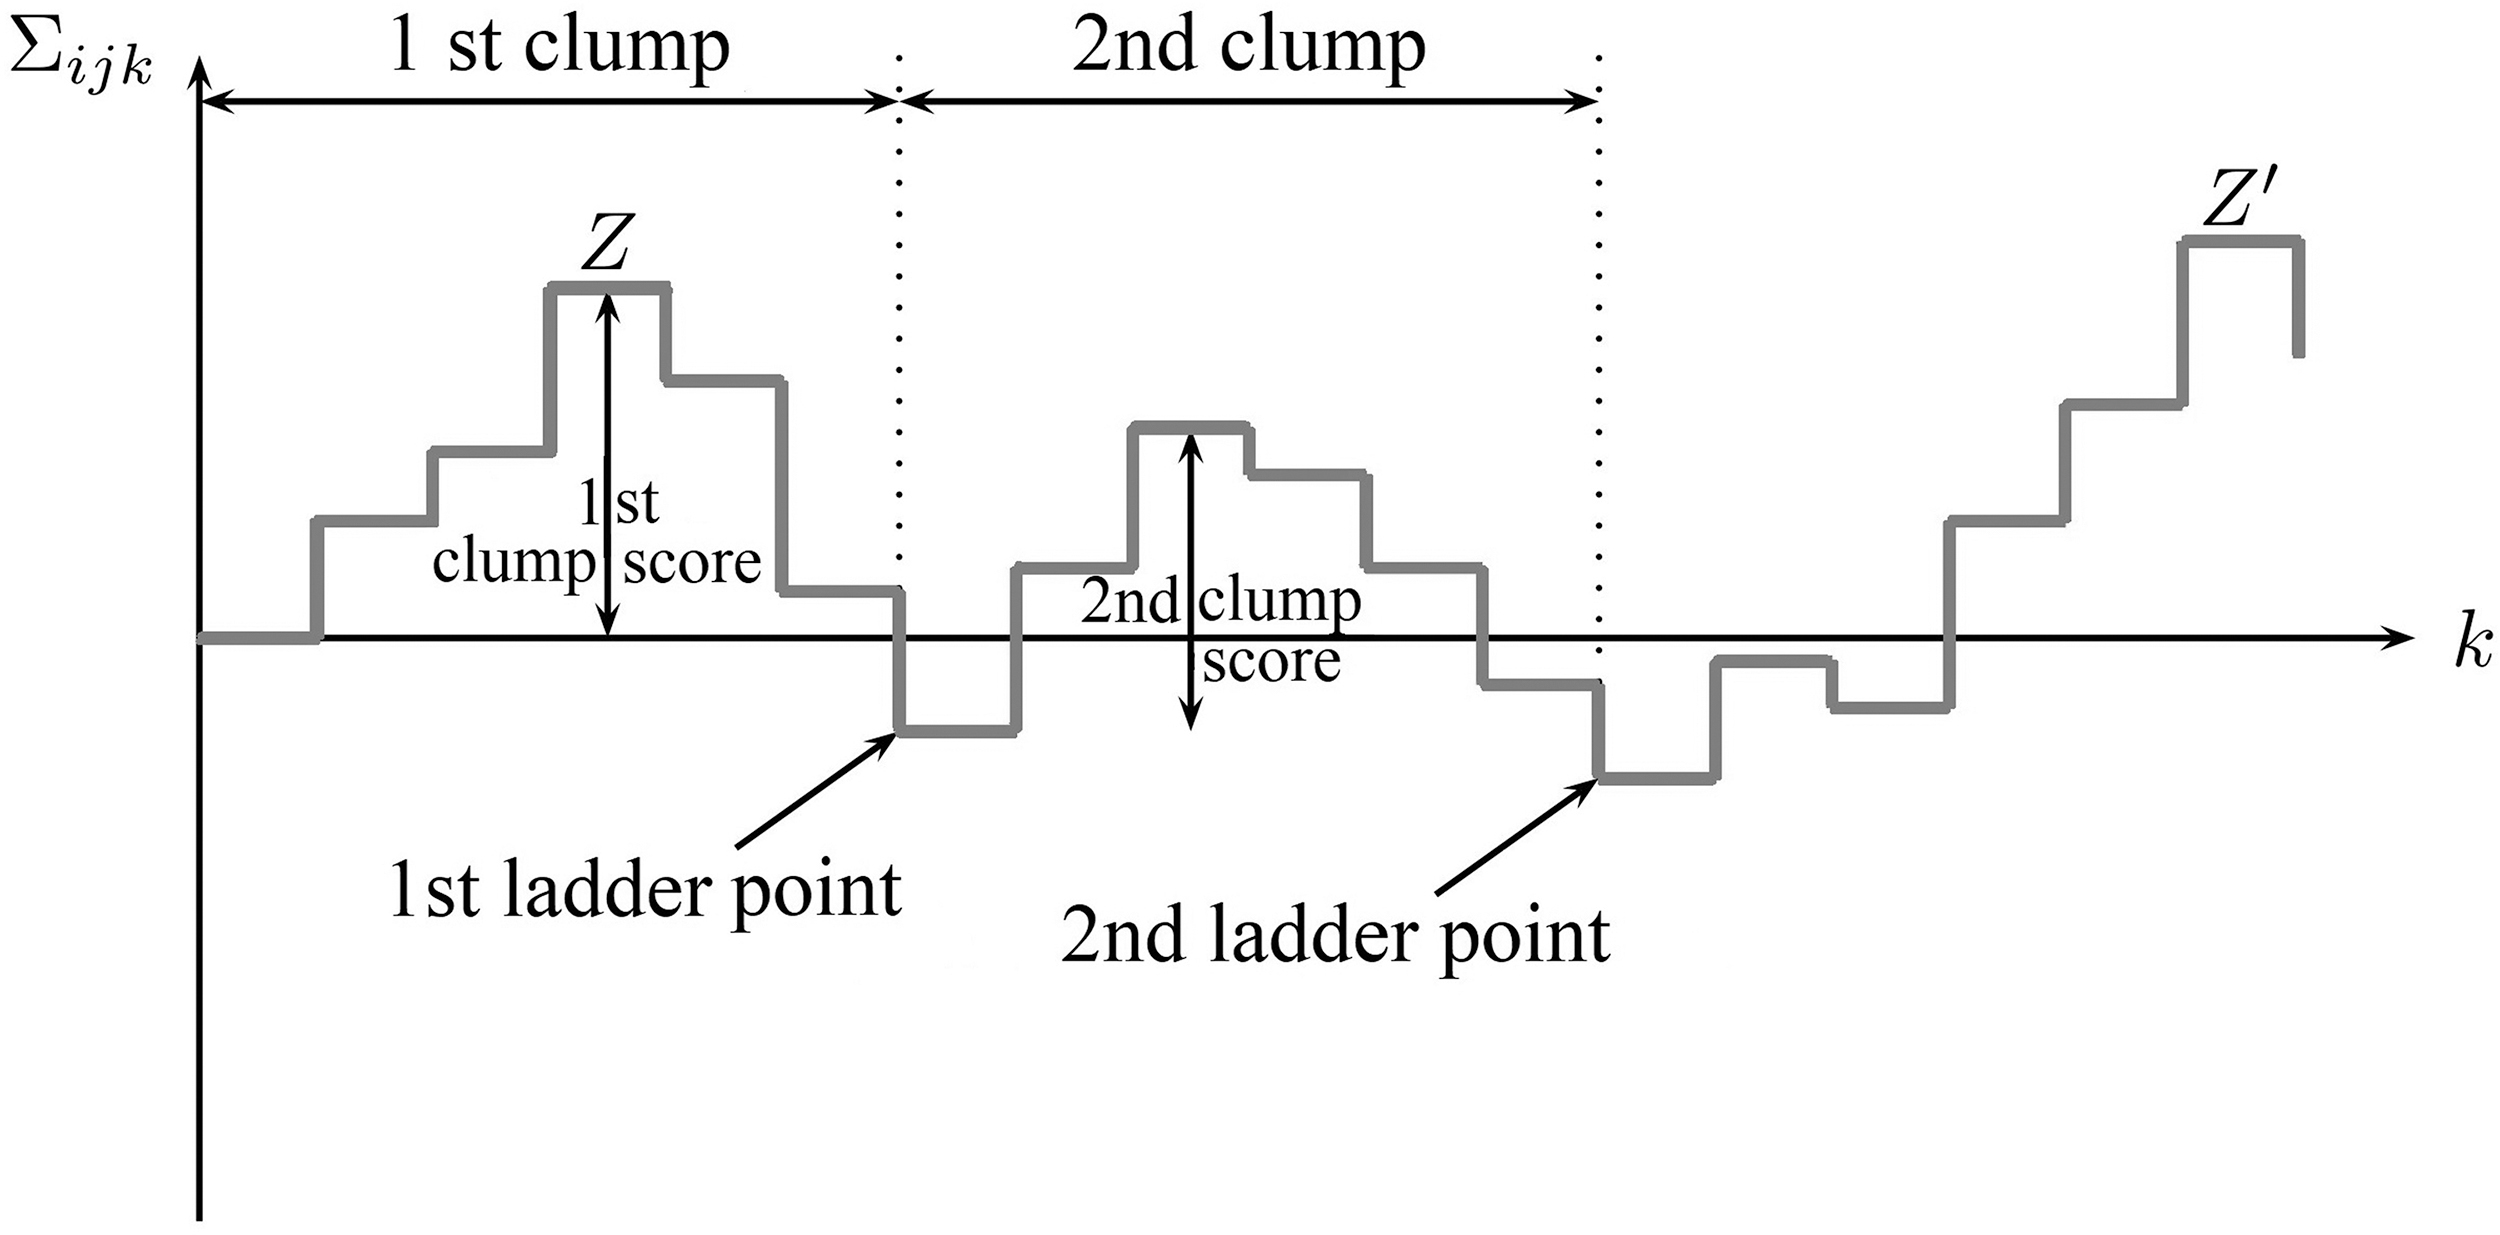
The ladder points, clump, the constrained, and unconstrained maxima, Z and
Based on Unconstrained maximum: For a fixed coordinate Constrained maximum: For a fixed coordinate
Let

where
Likewise, the gapped local score of two sequences
where
the maximum is taken over all global alignments given by two increasing sequences
2.2. Procedure of GEM
The greedy algorithm was described by Neuhauser (1994) for aligning DNA sequences. The Chen–Stein method for Poisson approximation is a powerful tool for deriving the statistical significance of the local alignment score obtained by the greedy algorithm. Mott and Tribe (1999) applied GEM to compare two biological sequences by using a standard scoring scheme and the gap penalties. They obtained an approximate local score when gaps are allowed.
The following steps are performed to obtain an approximate local alignment score based on GEM, namely

Local alignment is made by GEM.
Consider all ungapped clumps in the dot matrix. Let
Greedy step: Look for neighboring diagonals from
Note that under circumstances that the aforesaid maximum occurs at
Repeat greedy step to produce
Let
Finally,
To compute the p-value of similarity score based on GEM, Mott and Tribe (1999) assumed a linear relation between the parameters of the gapped and ungapped frameworks,
where
Mott and Tribe (1999) estimated
This project addresses the estimation of
3. Our Proposition
In this section, we introduce a new approximate p-value based on
Similarly to Equation (2), the local alignment score of a sequence of length n, Hn, is defined as
where Qi is the maximum score of the ith clump. Note that the clumps are mutually independent. In contrast, the exact distribution of Hn has been derived as the following:
where Pi is a
where
where
For the maximal partial sum, unconstrained maximum, an exact distribution is derived (Mercier et al., 2003) as
where Ri's are the roots of a polynomial that satisfy
3.1. Exact distribution of the constrained and unconstrained maxima relative to U walk
Let V and
where Ri's are the roots of a polynomial and f is the number of the roots with absolute values strictly <1. The inner summation is a convergent series since
The exact distribution of
where the parameters are computed similar to those of Equation (11) with the difference that the greedy score, U, is used rather than scoring scheme, s. Note that the average of greedy extension scores is required to be negative.
The exact distribution of V is obtained from Equation (8), which is calculated for U sequence. Let
where du is the expected number of clumps. Note that, for the calculation of
where
3.2. Distribution of
As already mentioned, the distribution of
To determine p (the coordinate marks the start of a gapped alignment of score
the unconstrained maximum of GEM algorithm that runs backward from
So,
Finally, by the Poisson clumping heuristic and like Equation (5), the approximate distribution of
4. Numerical Results
In this section, the efficiency of the proposed p-value is assessed. For this propose, the gap number distribution should be determined. Here, we are interested in short and medium sequences wherein the classical methods such as BLAST failed.
4.1. Gap number distribution
As is mentioned in Section 3.1, the length of U sequence, nu, is necessary to determine the distribution of V in Equation (14). As far as we know, this is the first study on the gap number distribution that is independent of gap length. A number of studies have been carried out on gap frequency relative to gap length, which empirically shows that gap distribution follows a power law distribution (Gu and Li, 1995; Qian and Goldstein, 2001; Zhang and Gerstein, 2003; Goonesekere and Lee, 2004).
To derive the gap number distribution, several databases are independently generated from a fixed letter distribution obtained from the letter frequencies of some Homo sapiens (human) sequences. Each database has 10,000 independent pairs of sequence with given length. For each sequence pair, the path and the score of an optimal global alignment are determined by using the Needleman–Wunsch algorithm, and the gap number, Ng, is counted. The scoring scheme used in calculation is BLOSUM62 and gap opening penalty is set at 9, 11, and 13 with gap extension penalty 2.
It is clear that
where

Comparison between logarithm of the empirical and theoretical Equation (17) distribution of Ng for different length of sequences and various gap openings. Circle and triangle present the empirical and truncated distribution, respectively.
p-Values of the Kolmogorov and Smirnov Test Pertaining to Comparison of the Distribution of
4.2. Simulation study
Here, we take into account two strategies to compare IGEM in Equation (16) with MT: (1) comparison obtained p-values from IGEM and MT with empirical values and (2) the assessment of IGEM and MT using real and simulated sequences with different degree of similarity.
For the first strategy, according to the letter distribution proposed by Robinson and Robinson (1991), we independently generated
Local scores are calculated using the scoring scheme BLOSUM62 with gap opening and extension of 11 and 2, respectively. An empirical p-value, Pe, is computed based on generated sequences by
Table 2 indicates that for achieving
For a p-Value of Magnitude
IGEM, improved greedy extension model; MT, Mott and Tribe.
Table 2 gives the empirical local scores, Se, and two intervals of local score,
Mott and Tribe (1999) highlight the fact that their method provides a better way for calculating the p-value than BLAST by obviating the need for an empirical p-value as a reference. Our goal, however, is to propose an alternative to BLAST p-value, especially for short sequences. Hence, we need an empirical p-value. This fact complicates our simulations because the p-values of our interest are very small, which requires larger databases.
To overcome the limitation of simulation, we use the Metropolis Coupled Markov Chain Monte Carlo (MCMCMC) (Geyer, 1991). This method has been applied in several fields such as physics (e.g., Earl and Deem, 2005) and biology (e.g., Zhou et al., 2001; Hartmann, 2002; Zhou, 2004; Wolfsheimer et al., 2007). Wolfsheimer et al. (2007) used MCMCMC algorithm to generate amino acid sequences with high degree of similarity, which is our main goal in simulation.
To generate similar sequences, sampling regions can be divided into different segments and sample can be chosen from a specific segment (in this case, tail of local score distributions) with high probability. In other words, the simple idea to achieve a large local score is sampling from different distributions. The statistical significance of an observed score, s, for two sequences x and y is
where
By drawing a sample according to
where T is a parameter that describes temperature of a physical system. In other words, each pair of sequences,
This process leads a random sample of sequences to compute the p-value of similar sequences (Newberg, 2008). In our calculation, the scoring scheme BLOSUM62 is used with gap opening and extension of 11 and 2, respectively. The results of comparing MT and IGEM methods are presented in Table 3. For each sequence length, magnitude of p-value and its corresponding intervals of local score are calculated. As is seen, the local score of the MT method is larger than one of IGEM for the same p-value, which explains the sensitivity of IGEM. In other words, in the MT method for high similarity cases, a larger local score is required to achieve a smaller p-value.
For a p-Value of Magnitude
4.3. Real sequences
To evaluate the MT and IGEM methods on a real database, we use a subset of the SCOP 2.06 (Structural Classification of Proteins) database at family, superfamily, and fold levels.
Receiver operating characteristic curve is used to assess the performance of the MT and IGEM methods (Fig. 4). A method with a larger area under curve is considered as a method with a more precision and accuracy in a discrimination (Teichert et al., 2010). Table 4 indicates the performance of the IGEM method over the MT method at all levels.
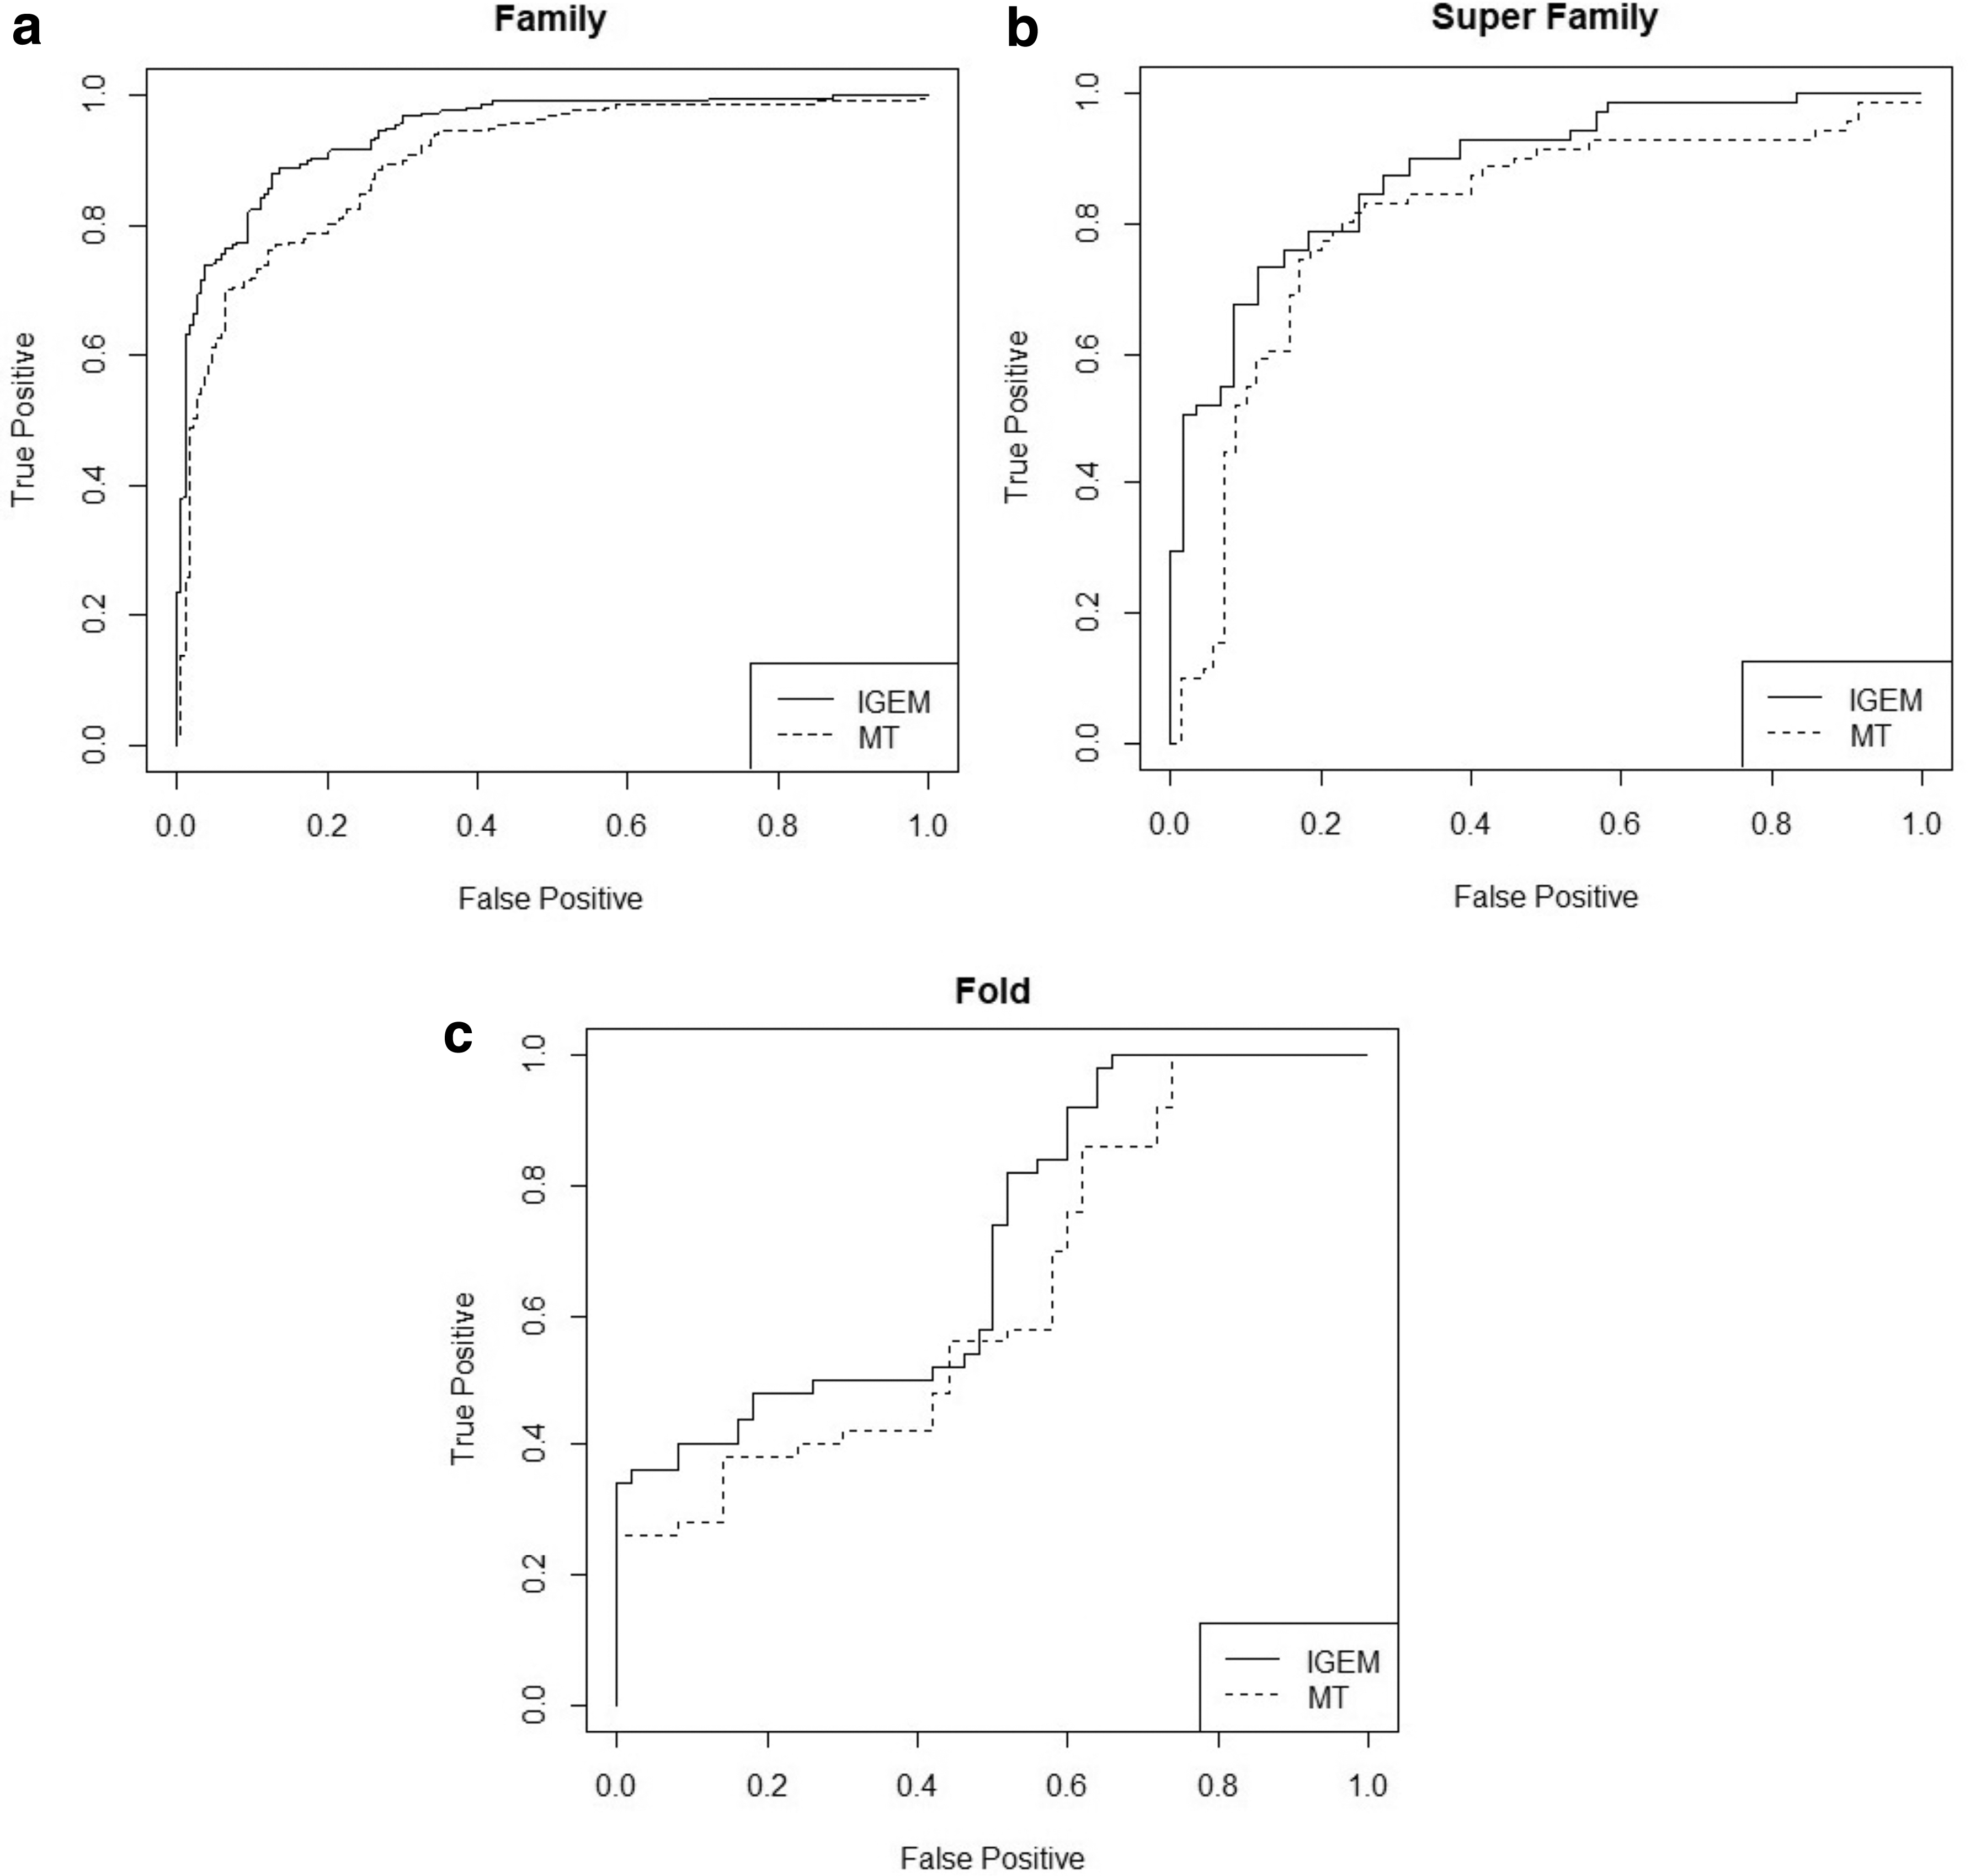
ROC curves related to sequence comparison at family
Area Under Curve Values Related to the IGEM and MT Methods Relied on Some Real Sequences
AUC, area under curve.
5. Conclusion
Using approximation to obtain the p-value of sequence alignment is a common method in biological and bioinformatic studies. However, the approximate p-value suffers from the lack of precision. Therefore, the accuracy of an approximation is crucial, which leads to introduce a new method with high accuracy in terms of statistical significance. For this purpose, we suggest an improved approximation of p-value based on the greedy extension method, namely IGEM, which is derived from the exact distribution of constrained and unconstrained maxima. As is discussed in Section 4, the proposed method presents some considerable advantages against previous methods, which makes it as a prospective candidate for the sequence alignment studies.
Footnotes
Author Disclosure Statement
The authors declare they have no competing financial interests.
Funding Information
No funding was received for this article.