
Abstract
Abstract
Karyotype analysis has important clinical significance in the diagnosis, treatment, and prognosis of diseases such as birth defects and hematological tumors. Identifying chromosomes and their structure variations from G-banded metaphase images is an important process in karyotyping, and also is the most difficult one. Automatic chromosome classification becomes urgent in recent years since more and more samples of patients are subject to medical test such as bone marrow biopsy. With the development of artificial intelligence, convolutional neural networks (CNNs) have shown good performance in image recognition. In this study, a CNN with 6 convolutional layers, 3 pooling layers, 4 dropout layers, and 2 fully connected layers was trained using the labeled data set to classify chromosomes into 24 classes through softmax activation function mapping. The classifier gave an accuracy of 93.79% for chromosome identification. The result demonstrated that the CNN has potential application value in chromosome classification and will contribute to the construction of an automatic karyotyping platform.
1. Introduction
DNA molecules with part or all of the genetic material of an organism are located in nuclei of eukaryote cells. During the prophase of mitosis, the loosely packed chromatin fibers tightly condensed into discrete chromosomes. There are 23 pairs of chromosomes in normal human cells, where 22 pairs are autosomes and the 23rd pair is related to gender (XX for a female, XY for a male). Each chromosome has two chromatids held together by the constricted region called centromere and will be divided into two cells in the telophase. Chromosomes are in their most condensed state during the metaphase and can be clearly observed under the optical microscope. Metaphase is the most appropriate state in cell cycle to classify each chromosome and identify abnormalities.
A karyotype image contains all chromosomes in a cell at metaphase, which can be captured by an optical microscope. The slides are stained with Giemsa-trypsin staining technique to show the different properties of each chromosome region. Chromosomes appear as bars of different lengths with black and white bands. The gray level of the bands is related to the base contents (higher G-C ratio, deeper band color), which is a profile of genetic material distribution. In karyotyping process, all chromosomes in one cell are identified, paired as 24 classes (22 autosomes from 1 to 22, sex chromosomes X and Y), and are arranged in decreasing order by size. Finally, they are classified into group A-G based on the Denver group classification standard. Figure 1 shows a sample of chromosomes in a cell and the corresponding karyotype.
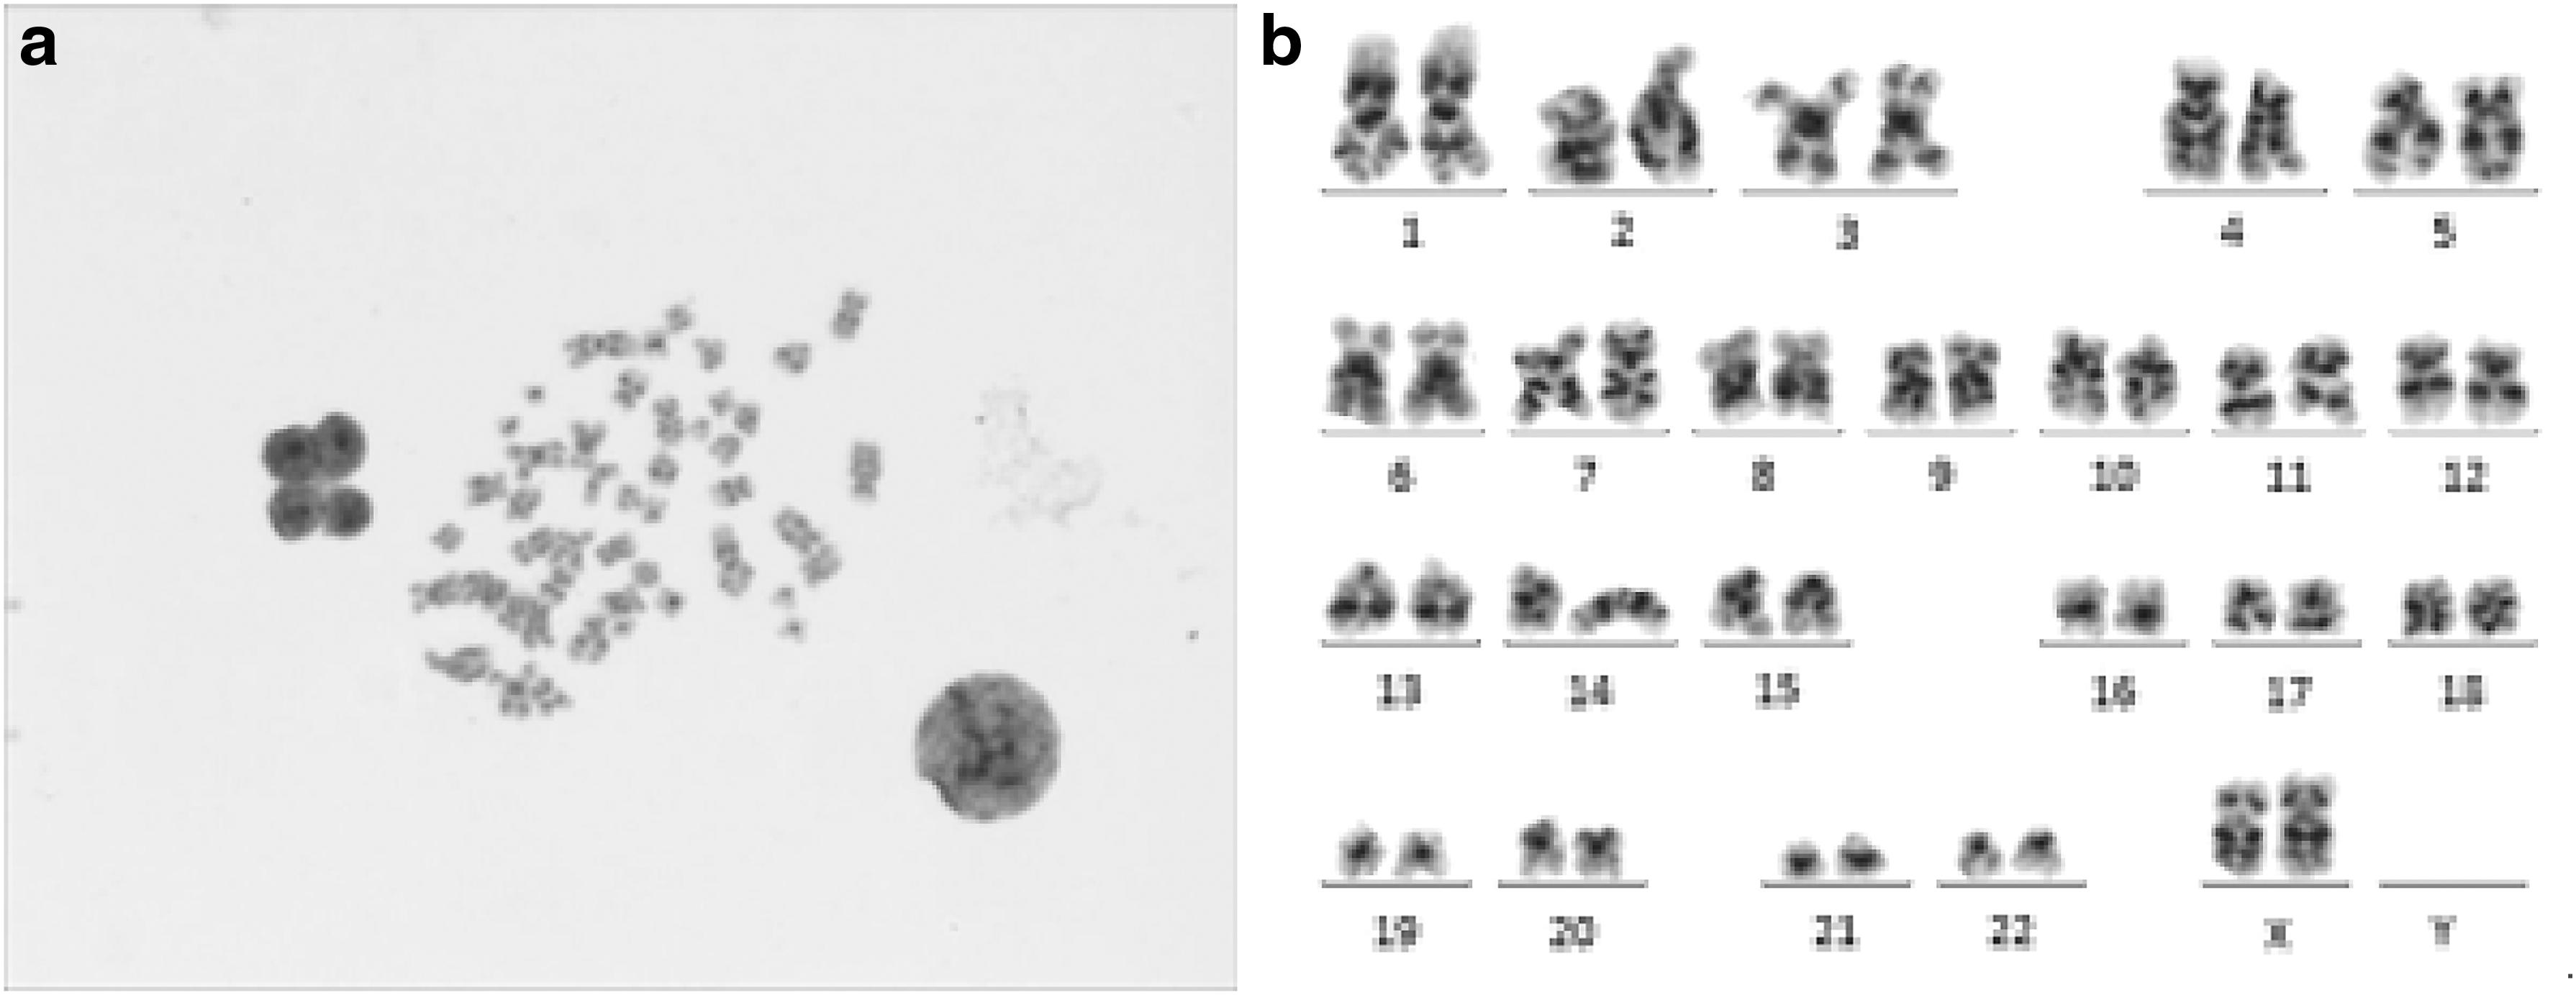
A sample of chromosomes in a normal female cell and the corresponding karyotype.
Karyotyping analysis is an important screening and diagnostic procedure for detecting several genetic diseases or chromosomal anomalies (Madian and Jayanthi, 2012). It is widely used in prenatal diagnosis, biological radiation damage assessing, and hematological tumor diagnosis. Chromosome abnormalities include increase and/or decrease of chromosomes in quantity, and structural abnormalities in one or more chromosomes. Quantitative abnormalities often cause fatal problems such as Down syndrome (trisomy 21) and Edwards syndrome (trisomy 18). In the diagnosis of acute myeloid leukemia (AML), chromosome structural abnormalities are closely related to disease subtypes, prognostic of AML, and even the selection of targeted drugs. Recurrent chromosomal rearrangements such as t(8; 21)(q22; q22), t(15; 17)(q22; q12), and inv(16)(p13; q22) are frequently identified as abnormality in AML and have different incidence rates in AML subgroups (Pankaj et al., 2016). Chronic myeloid leukemia, one of the four common types of leukemia with a poor prognosis, is always found to have one chromosome 9 (chr9) and one chr22 swap gene between each other and cause BCR-ABL gene fusion as a result in patients' cells (Wang et al., 2010).
The spectral karyotyping method is a new method that is easy to identify different chromosomes, but it also has disadvantages of high cost and complicated experimentation. Most currently used automated karyotyping systems provide a graphical environment with basic segmentation operations and manual chromosome classifications. The interactive system is time-consuming, laborious, and dependent on a professional technician. Taking the diagnosis of hematological tumor as an example, to ensure the accuracy and comprehensiveness of the diagnosis, the technician needs to select at least 30 metaphase images suitable for analysis and then segments, arranges, and classifies chromosomes in each image, which is labor-intensive. It takes more than 2 years to train a professional who can perform karyotyping analysis independently and efficiently. This has led to the fact that in small hospitals, karyotyping cannot be carried out effectively due to the lack of professionals, and in specialist hospitals, the analysis pressure keeps increasing because of more patients go there to make precise diagnostics.
Karyotyping is essentially an image analysis problem. Within the last few decades, artificial neural networks have showed impressive performance in image analysis and interpretation. In particular, convolutional neural networks (CNNs) are widely used in complex image recognition and classification such as handwritten character recognition (Cun et al., 1990). The CNN extracts high-level semantic information from the original data through a series of operations such as convolution, pooling, and nonlinear data mapping. The process extracts features layer-by-layer and forward-propagating signal by “feed-forward.” Another important process, “back-forward,” refers to the back-propagation of errors in the network training. By calculating the loss between the predicted value and the true value, the back-propagation algorithm feeds back the loss from the last layer, thereby updating the parameters (weights) of previous layer, and then feed-forward again. Training stops until the CNN converges to a certain degree of precision.
CNNs have exhibited good performance in medical image processing. Liskowski and Krawiec (2016) used improved deep CNN for detecting blood vessels in fundus imagery and showed the possibility of its application in clinical diagnosis. Sharma et al. (2017a) explored CNN for computer-aided classification in hematoxylin and eosin-stained histopathological whole slide images (WSI) of gastric carcinoma, however, the accuracy is not high because of the small data set. The CNN also gives good performance in a study on detecting mitosis signature from breast histopathology, WSI combining handcrafted features at the same time (Saha et al., 2018). There are many off-the-shelf and versatile bioimage analysis tools such as ImagePy (Wang et al., 2018), which may have good performance in images such as computed tomography (CT) and magnetic resonance imaging (MRI) with high quality. For chromosome images with low resolution and blurred edges, these tools cannot be adjusted to solve these problems adaptively.
2. Related Work
The metaphase images are noisy or with low contrast, and usually have deformative or overlapped chromosomes. The karyotyping process is a series of operations with many steps that include image enhancement, segmentation, feature extraction, classification, and so on. Many methods have been proposed to solve the above problems and showed good performance (Nair et al., 2015).
Computer-based classifiers are designed using various methods to simplify and speed up karyotyping. Mainly two types of methods, statistics based and artificial-intelligence based, are usually discussed (Yan and Bai, 2013). Statistic-based methods include knowledge-based classifier (Sjahputera and Keller, 1999), Bayesian classifier (Piper and Granum, 1989), maximum likelihood classifier (Ventura et al., 2010), and so on. Although they explored sophistic methods, currently they have not shown ideal performance.
Artificial-intelligence-based methods showed some promise in chromosome classification. In a recent study, Joshi et al. (2013) proposed the incremental learning method to classify chromosomes into seven groups based on the Denver group classification standard. The method was also suitable for dynamically changing data and gave an overall average classification accuracy of 97%.
Cho et al. (2004) first classified chromosomes into 7 major groups based on their morphological features and then used each group classifier to classify the 7 groups into 24 subgroups. Markou et al. (2012) extracted a feature vector for each chromosome based on its visual characteristics and trained a support vector machine (SVM) classifier using the corresponding feature vector for each chromosome class. The biological context (male or female; whether each autosome class includes two chromosomes) was considered after SVM to improve accuracy. Sharma et al. (2017b) used crowdsourcing for generation of chromosome segments and then fed the images to the deep convolutional neural network to make chromosome identification. Other methods such as wavelet-transform-based algorithms also have been used and showed different performances with different wavelet packets (Wu and Castleman, 2000).
In this work, we apply convolutional neural network-based image classification to the problem of identifying chromosomes into 24 classes. The CNN is built using the Keras deep learning framework, including six convolutional layers, three pooling layers, and two fully connected layers. Rectified linear unit (ReLU) activation function together with dropout layers is used to avoid overfitting. Softmax activation function is used at last to determine the category to which the input chromosome image belongs. The CNN is trained using the stochastic gradient descent (SGD) method. Various hyperparameters of the model are explored and tested.
3. Data and Methods
The raw metaphase chromosome images were from 91 different individual samples, photographed by the IKAROS system in the Molecular Pathology Department of Beijing Ludaopei Hospital. Each chromosome in all raw images was karyotyped by experts and labeled. Block diagram of the proposed chromosome classification methodology is shown in Figure 2.
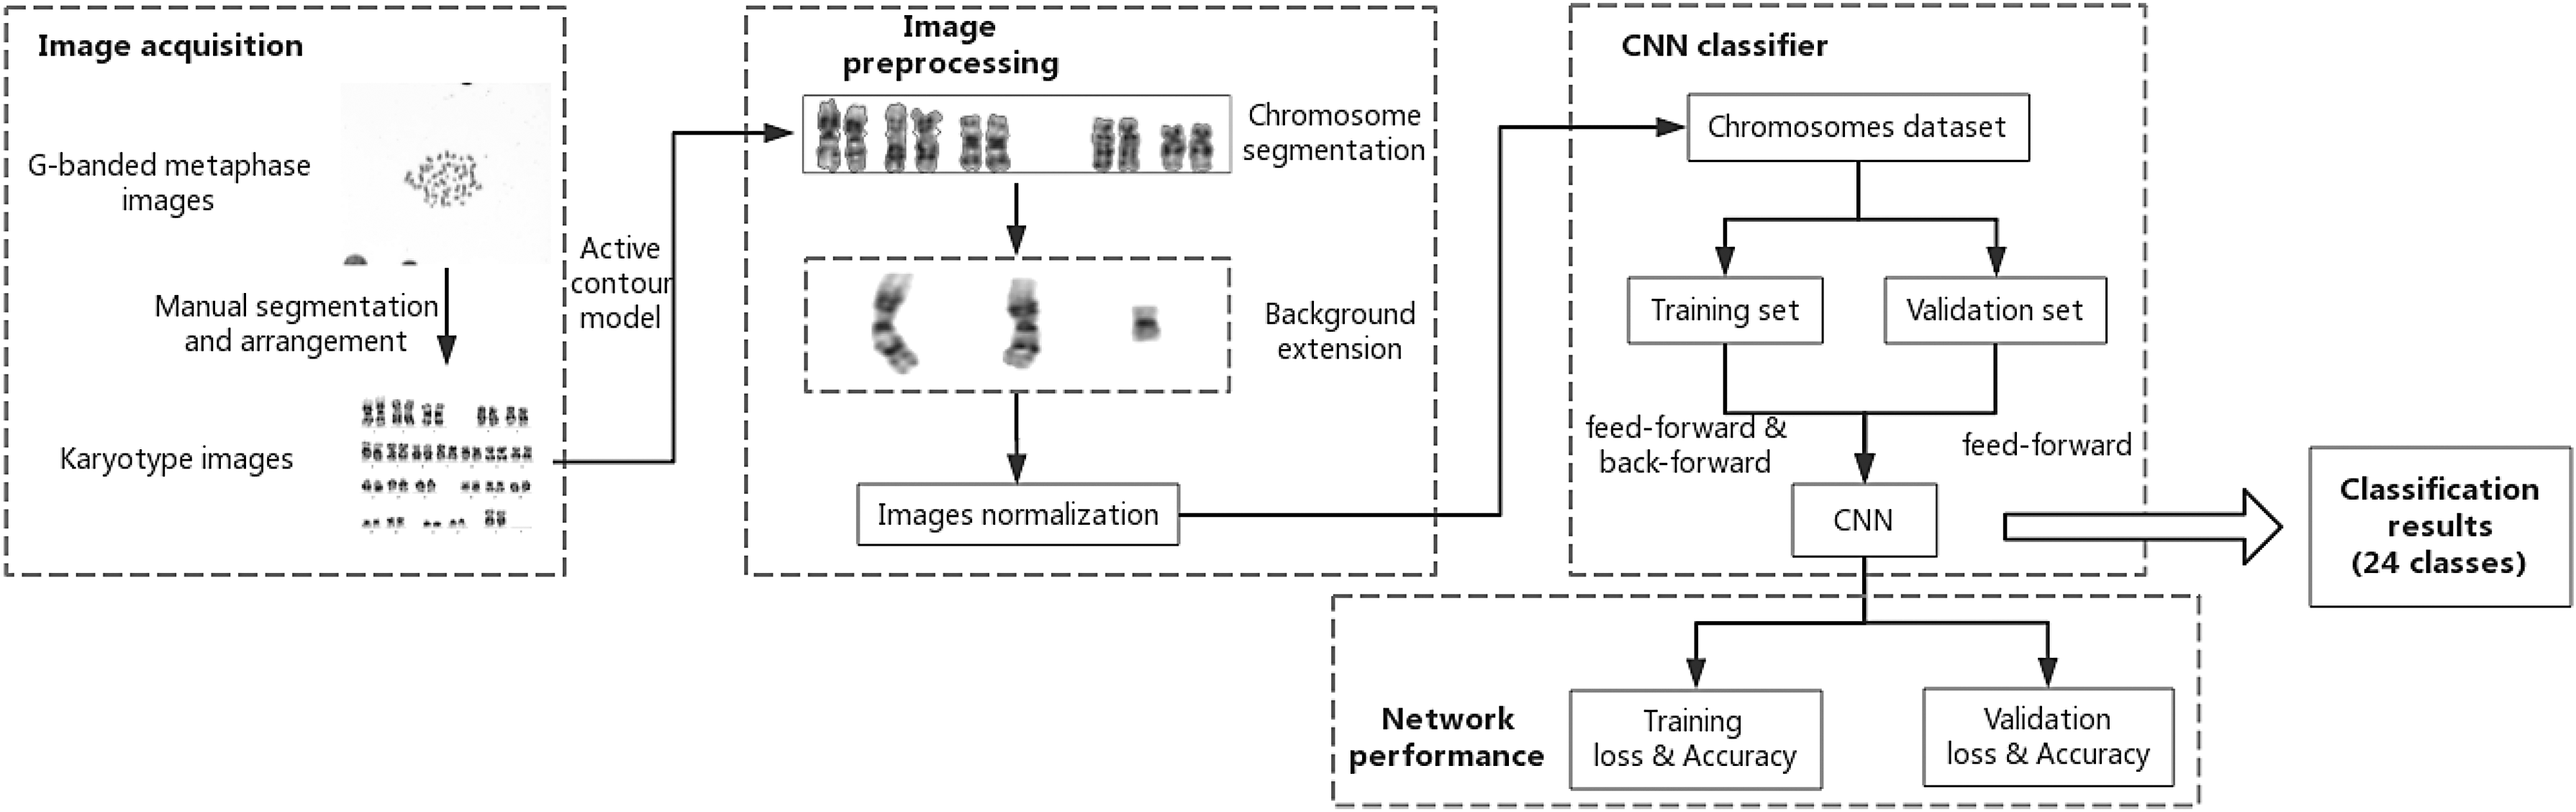
Block diagram of the proposed chromosome classification methodology. CNN, convolutional neural networks.
3.1. Segmentation of chromosomes
All the individual chromosomes are isolated from 91 karyotype images, which contain the manually arranged chromosomes of one cell segmented from the metaphase image of the same cell. Compared with metaphase images, chromosomes easy to segment for karyotype images have no background interference, have clearer bands because of the enhancement of IKAROS software, and have been correctly labeled. It is easy to extract the category information from karyotyping images and thus suitable for making input data for the CNN. The active contour model (snakes model) is used to realize the chromosome segmentation from karyotype image through MATLAB.
The snakes model was proposed by Kass et al. (1988). It subtly transformed the problem of image segmentation into the problem of minimizing energy functional and has been widely used in many fields such as digital image analysis and computer vision. The method was chosen as it is well suited for the processing of medical images such as CT and MRI due to its ability to extract contours of target objects in specific areas (Mcbee et al., 2018).
The edge-based active contour model is efficient to detect the gradient change at the edge of an object. An initial contour is placed first in the vicinity of the object to be segmented, and an energy function is defined for the contour such that the contour moves in the direction of decreasing energy. As the energy function is gradually minimized, the initial contour gradually moves toward the edge of the object and eventually converges to the target edge. In this way, an individual chromosome can ultimately be segmented from the karyotype image (Fig. 3).

Segmentation of each line of chromosomes in the karyotype image by the active contour model. The initial position of the contour is represented by a dotted line. The segmented contour of each chromosome is represented by a solid line.
Since the contour is sensitive to the initial position, it is necessary to place the initial contour near the object to be segmented. After testing, we chose to use the active contour model for segmentation of each line of chromosomes in the karyotype image. The operation needs fewer iterations, and the blurred edges of chromosomes are not overidentified thus retaining more edge information. To meet the requirements of the CNN input, the smallest circumscribed rectangle for each segmented chromosome is taken (Fig. 4a). After the segmentation of 91 karyotype images, we obtained 4184 normal chromosomes in total as our data set, including 181 chr9, 181 chr20, 152 chromosome X, 30 chromosome Y, and 182, respectively, of remaining classes of chromosomes (one chr9 and one chr20 were lost). The images are available on (https://github.com/Xi-Hu/Chromosome-Images.git).
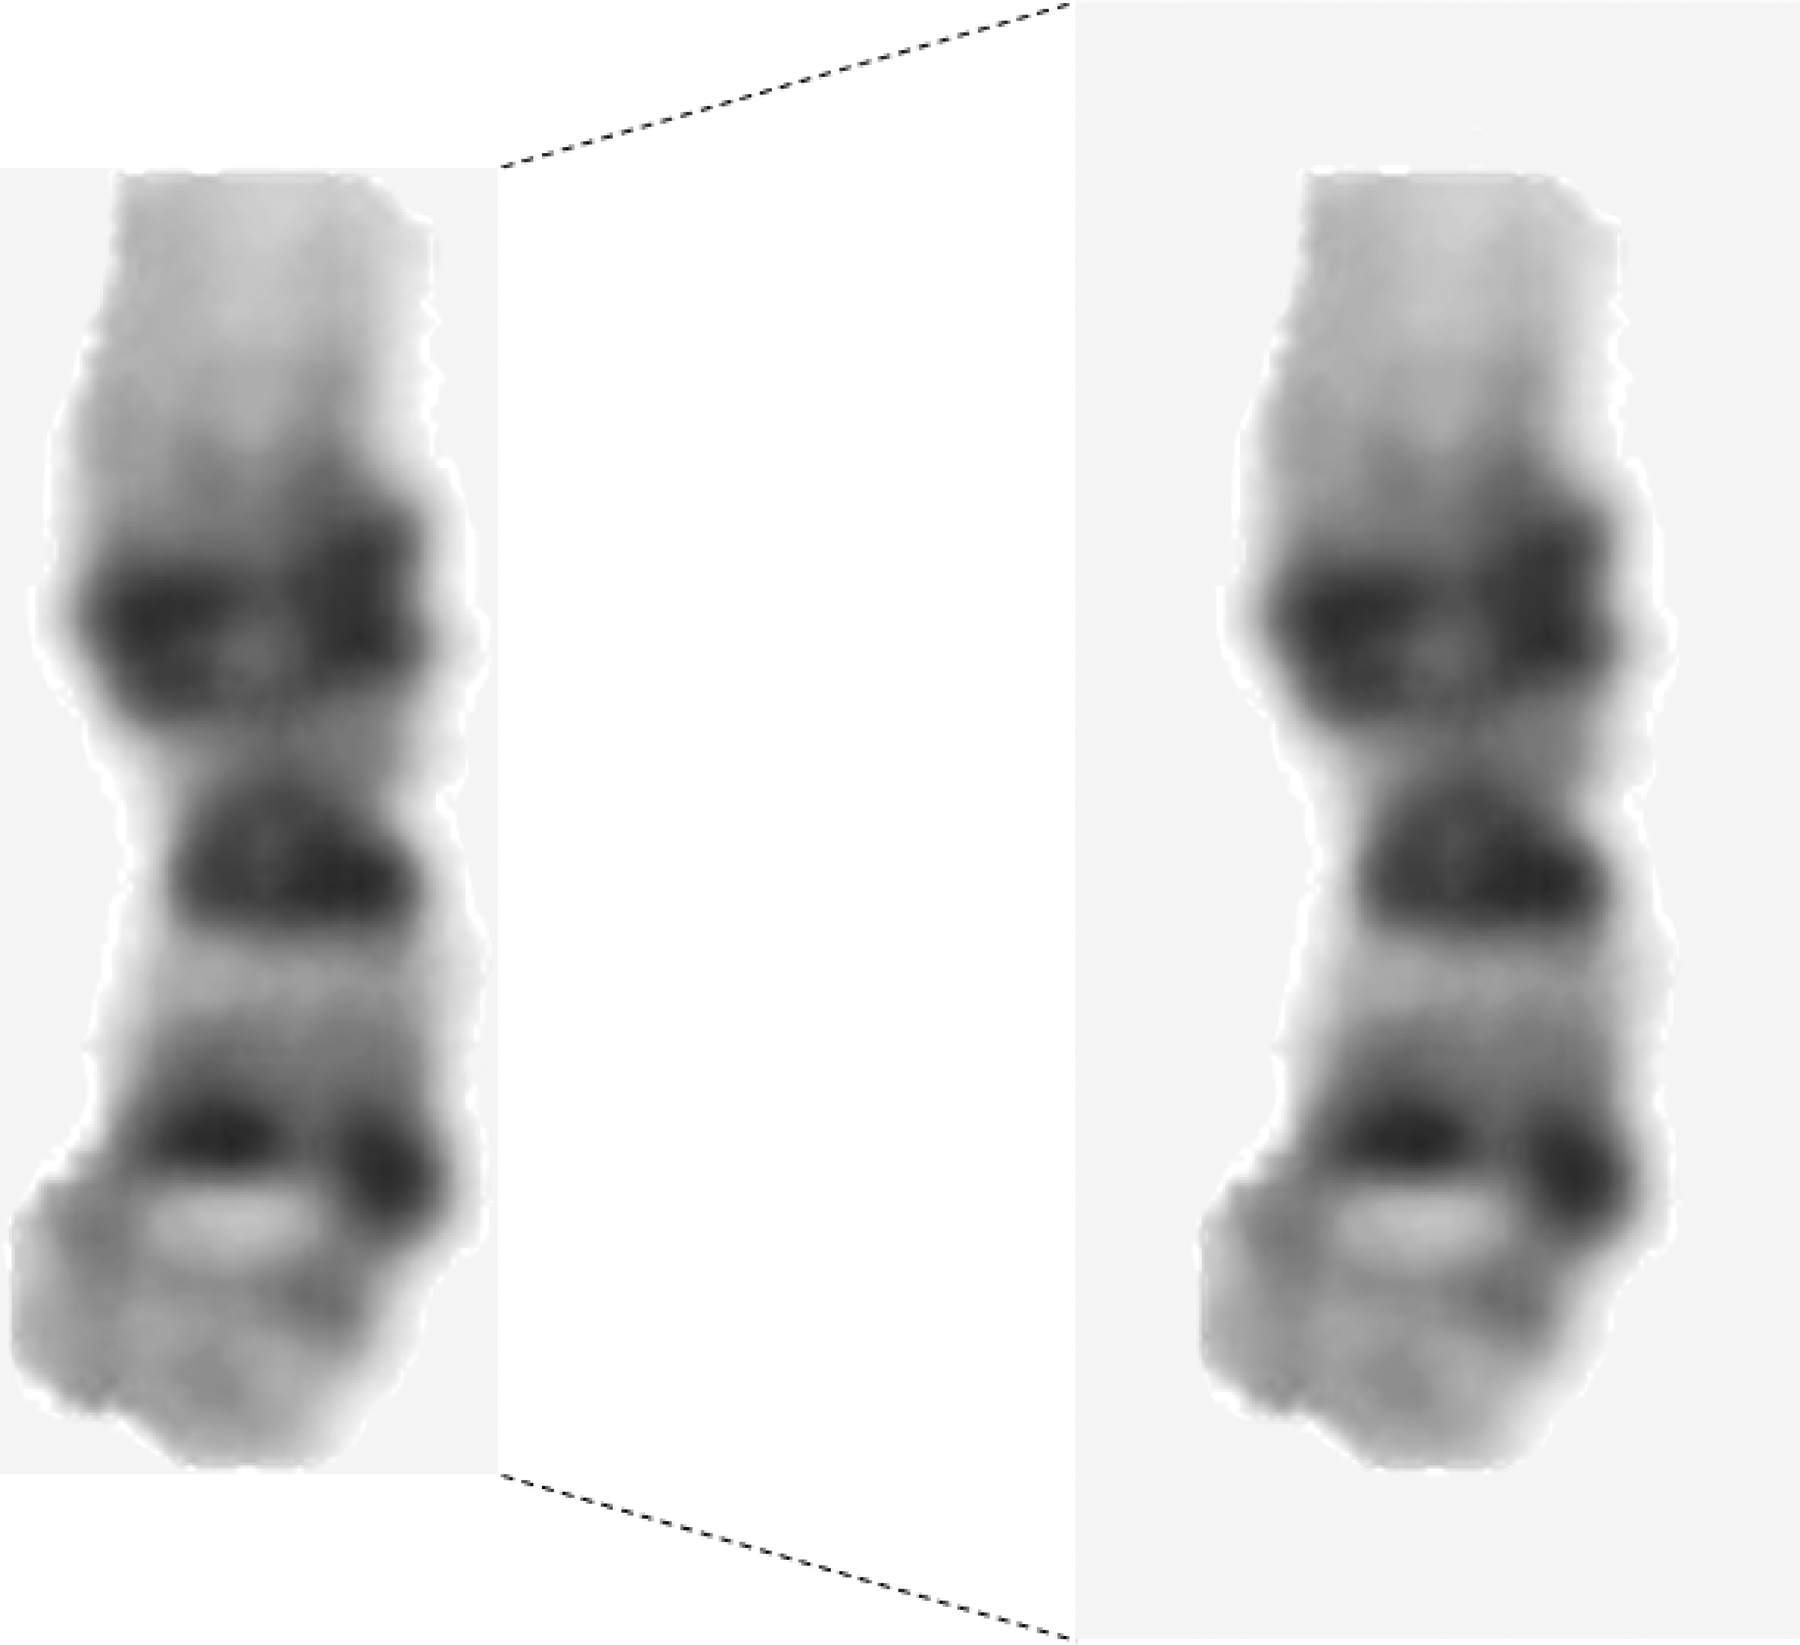
A sample of segmented chromosomes. The background of a chr1 with the smallest circumscribed rectangle (left) was extended to 100 wide and 220 high (right).
3.2. Image preprocessing
CNNs can perform better on appropriately preprocessed images. After being segmented from karyotype images and the smallest circumscribed rectangles taken, each chromosome is saved as an image with different height and width because of different chromosome sizes. To put all chromosome images into the same CNN for training, we extend the background of all chromosomes to obtain a uniform image size with a width of 100 and a height of 220 (Fig. 4b). Then, the value for each chromosome image pixel is normalized in range [0,1]. The above preprocessing can improve the accuracy of the classifier and speed up convergence during network training.
At last, we mark the Y chromosome as chr24 and use the one-hot encoding method to encode chromosome category. The eigenvector of each chromosome is used for loss calculation in model training.
4. Methodology and Model Architecture
A deep convolutional neural network (CNN) was built and trained on the prepared image data set using Keras. The structure of the chromosome classification model borrows from the VGGNet neural network. The end fully connected layer is connected to the softmax classifier and the results are output in probabilistic form. Description of the proposed CNN is as follows.
4.1. Structure of the CNN
The structure of the proposed CNN is shown in Figure 5. It consists of three blocks where each block contains two convolutional layers with ReLU activation, one max-pooling and one dropout layer. These blocks are followed by a flattened layer, a fully connected layer with ReLU activation, a dropout layer, and a softmax layer of 24 U at the end.
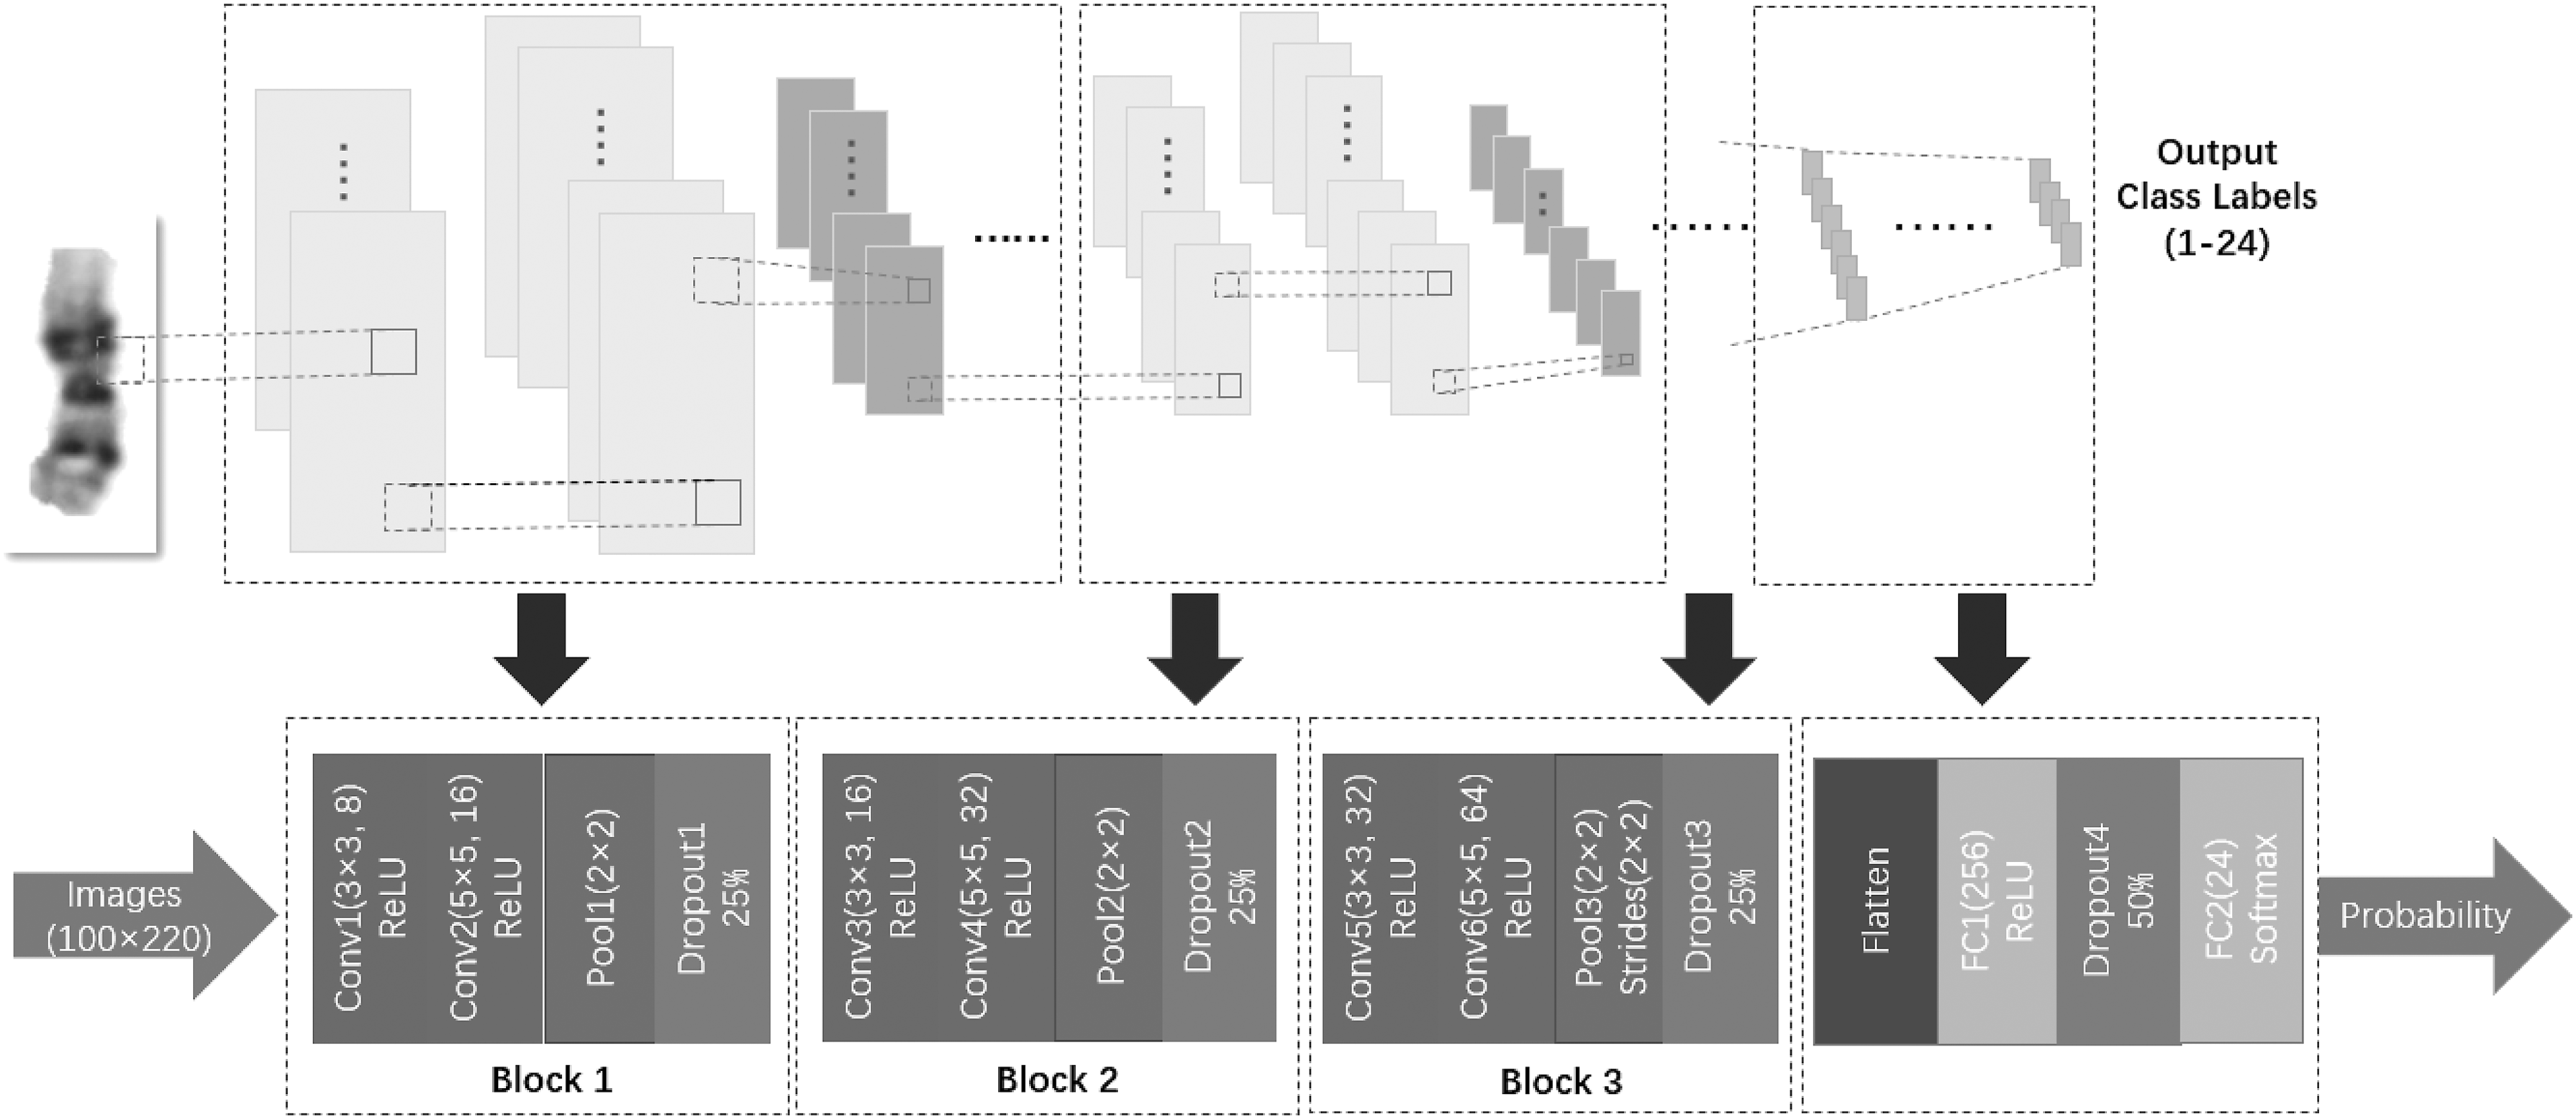
The structure of the proposed CNN. Conv 1–6 are convolutional layers, Pool 1–3 are pooling layers, Dropout 1–3 are dropout layers, FC 1–2 are fully connected layers. The input chromosome image is classified through the CNN and the result is output in probabilistic form.
Convolutional layers extract features of input images by performing a convolution operation. The Conv 1 layer extracts low-level features such as edges of chromosomes, and other convolutional layers are used to continuously extract more complex features. A deeper feature map could be obtained using multilayers of convolution operation. In this work, the kernel size of the first convolutional layer of each block is 3 × 3 and the second of each block is 5 × 5. The stride of each convolutional layer is 1. The edges of the image are zero-padded to keep the input and output sizes of the convolutional layer the same.
Pooling layer is used after the convolutional layer to compress the input feature map, thereby making the feature map smaller, simplifying the complexity of network computing, and compressing the features to extract the main features. In this article, max-pooling is selected. The maximum value of the feature map in pooling region is selected as the value after the pooling operation of the region. The pool size is set as 2 × 2 and the stride is 1 in Pool 1 and Pool 2 (Fig. 5). The stride is changed to 2 with the same pool size in Pool 3.
At present, CNNs mostly adopt the ReLU+dropout technology to increase the generalization ability of networks, and have achieved good classification performance (Krizhevsky et al., 2012). To avoid overfitting of network, the CNN built in this article also adopts the above structure. During training, 25% of nodes are randomly inactivated in the above three blocks, and 50% are randomly inactivated after the first fully connected layer. Inactivated nodes do not participate in the forward-propagation and the back-propagation process of the CNN. The operation reduces the mutual adaptation of neurons, makes the CNN more robust, and thus avoids overfitting.
These feature extraction blocks are followed by a flattened layer to compress multidimensional data into one-dimensional data for the transition from convolutional layer to fully connected layer. Fully connected layers connect all extracted features and are fed to the classifiers at the end of the network. The FC1 keeps 256 features and uses ReLU activation function. Then, the multiclass classifier uses softmax function and finally outputs the prediction probability of the corresponding 24 classes of each chromosome image. The class corresponding to the largest probability is the prediction result.
4.2. Training and preservation of the CNN
This network was trained using error back propagation and mini-batch SGD optimization. Batch size is set as 64. For each batch, loss between prediction result and real label is calculated and then updates the network according to the back-propagation algorithm. Samples of training set are traversed between different batches according to the principle of no-return sampling. A whole traversal is called “1 epoch.” When the model evaluation indicator no longer rises, the training is stopped. In this work, epoch is set as 80 after testing.
Randomly select 20% from the data as a validation set for cross-validation. The validation set is not involved in training and is used to calculate model indicators such as accuracy and loss after each epoch. Before training, data augmentation is realized using ImageDataGenerator function from Keras. Considering the characteristics of the chromosome image itself, and after testing, we rotate images in the range of [0,20] and change the size of images in the range of [1 – 0.1, 1 + 0.1]. Finally, the data set is expanded by a factor of three.
When the network performance is no longer improved and the result is converged, that is, the accuracy and loss are stable, the training is stopped. After adjusting the network structure and parameters multiple times, the CNN structure with the best network performance and its parameters such as weights and functions are determined and the model is saved to an HDF5 file; thus, the model can be used to make prediction on new data.
4.3. Parameters used in the CNN
Activation function increases the nonlinear mapping ability of the entire network, simulating the response characteristics of neurons. In this work, ReLU activation functions are used. ReLU is the most commonly used activation function in CNNs. It is defined as follows:
Compared with sigmoid activation function, ReLU avoids gradient saturation effect and contributes to the convergence of the SGD method.
Softmax loss function is the most commonly used objective function for the output of a multiclass neural network. The form of network output is converted to probability by exponential changes. Let
where
To find the direction of gradient descent and adjust the learning rate adaptively, RMSProp optimizer is used. Following the suggestion of Hinton (Ruder, 2016), the parameter γ is set to 0.9 and the learning rate η is 0.001. The gradient update rule of RMSProp is as follows:
where gt is the gradient corresponding to parameter
5. Experimental Results
5.1. Segmentation of chromosomes by snakes model
First, the whole karyotype image is divided into four rectangle regions according to the arrangement. The segmentation sets the initial contour position to isolate single chromosome in the same rectangle (Fig. 3). In the parameter of snakes model, the minimum number of iterations
As shown in Figure 3, there are still cases of overfitting and underfitting on the edge of the chromosome. The reasons for these errors include low resolution of the karyotype image, blurring of the chromosome edges, and natural defects in the snakes model. These mistakes on edges are considered to have little impact on the overall network performance for the following reasons. First, the smallest circumscribed rectangle of chromosome can keep some edge information. Second, in the front convolutional layers, learned kernels attend to the shapes of chromosomes as well as the intensity difference between chromosomes and surrounding background, while high-level concepts from output features of bottom layers are constructed by latter convolution kernels (Dou et al., 2016).
5.2. Classification of chromosomes using the CNN
The network structure was finally determined by comparing the training speed, classification result, and specificity of different combinations of hyperparameters and network substructures.
In the data augmentation, we do not use the translational transformation of images to avoid affecting more edge features. The accuracy of CNN is improved when translational images were removed from the data set. The optimizers, such as Adam, AdaGrad, and RMSProp algorithms, can automatically adjust the learning rate in model training and improve shortcomings of SGD. In the AdaGrad parameter update algorithm, all the gradient squares need to be accumulated, resulting in the gradient approaching 0 in late stages of training, and the training ends prematurely, which does not achieve the desired training effect. In this study, Adam and RMSProp show little difference and RMSProp is finally chosen. During training, if the batch size is set too small, it will easily cause oscillation. After determining the network structure and other parameters, the batch size is set to 32, 64, 128, and 256, respectively, for training test, and the maximum training epoch is set to 100. Comparing experimental results, the optimal batch size of the chromosome classification model is 64, and the number of training epoch is adjusted to 80 according to the convergence result.
The CNN with architecture described above is trained using our data set through GPU server. Due to the small amount of male karyotype images collected in our data set, the number of Y chromosomes is much smaller than that of other chromosomes (30 vs. 182). The uneven distribution of samples will affect the training results of the model to some extent.
In the 80 epochs of the training process, the prediction accuracy and loss value of the training set and cross-validation set are shown in Figure 6. As the epoch of training increases, the accuracy of the training set and the validation set increases and gradually converges at 93.79%, and the loss value gradually decreases and finally converges to 0.2181.

The prediction accuracy and loss value of the training set and cross-validation set during training.
The confusion matrix, indicator used for model evaluation in supervised learning, also shows the good performance of the CNN on chromosome classification (Fig. 6). In the confusion matrix, the abscissa indicates the predicted category and the ordinate is the true category. The darker the color, the more the data are concentrated. As can be seen from Figure 7, the color is concentrated on the diagonal line, which means that most samples are correctly classified. As a result, the proposed CNN model can make precise classification of chromosomes into 24 categories efficiently.

The confusion matrix of chromosome classification.
6. Conclusion and Future Work
Chromosomal abnormalities are of great significance in clinical diagnosis. At present, the karyotyping system requires professionals to perform interactively and takes a lot of time. Training an experienced doctor is time-consuming and tough, so it results in a shortage of professionals. We train a convolutional neural network, which is widely used in image processing problems nowadays, to construct a module that can realize automatic chromosome recognition by inputting chromosome images. In the rapid development of the cloud computing, the module is expected to be placed in the cloud, enabling telemedicine for karyotyping.
In this experiment, only <5000 images were used as the data set, which achieved an accuracy of 93.79%. We compare our result with some other studies (Table 1), the accuracy of our work is ideal. For chromosome images with incorrect classification, we chose some samples to make deep investigation (Fig. 8). As shown in Figure 8a, the chr2 is misclassified into chr1. Comparing band features of chr1 and chr2, the dark area near the centromere and the light stain of other bands on the chr2 may cause the mistake. As shown in Figure 8b, the chr12 is misclassified into chr11. The similar band features in chr11 and chr12 may be the cause. As shown in Figure 8c, the chr19 is misclassified into chr16 for the two chromosomes have dark bands near centromeres, and the bend of the chr19 may have an impact on the extracted features. In the process of identifying chromosomes manually, morphological features such as relative length and centromere index of chromosomes are efficient to distinguish chromosomes such as 16 and 19. However, in the automatic classification system in this study, morphological features cannot be an efficient feature for they would vary in different samples and do not have a standard. Improving the quality of chromosome images and increasing the number of samples may further improve the performance of the classification CNN.

Chromosome images with incorrect classification.
Comparisons with Other Methods Reported in the Literature
ANN, artificial neural network; CNN, convolutional neural networks; SVM, support vector machine.
The CNN classifier we established can quickly identify normal chromosomes, achieve high accuracy and high efficiency, and is very promising for replacing some manual work in karyotyping, reflecting the application of artificial intelligence in karyotype diagnosis. For diseases, some specific forms of chromosomal mutations, such as quantity changes and addition/deletion of chromosome fragments, can provide basis for diagnosis. When more abnormal chromosome data are obtained, our system can also correctly identify the karyotypes associated with these diseases.
Segmenting of chromosomes is required before karyotyping. The segmentation in this work was based on manually labeled chromosome samples. If we solve the problem of overlapping chromosome recognition and directly segment chromosomes from metaphase images, we can combine our work to form a more efficient automatic karyotyping system.
In future work, more metaphase images labeled by experts will be collected and used in the network training. Image enhancement, filter, and accurate chromosome segmentation will be improved. The automatic karyotyping system consisting of the CNN classifier and a system for automatic segmentation of chromosomes from metaphase images is promising enough to be integrated into the cloud to facilitate karyotype analysis and solve the problem of shortage of technicians in small hospitals. Karyotype analysis will be more widely used in clinical diagnosis and treatment.
Footnotes
Acknowledgments
This work was supported by the Science and Technology Project of Beilin District, Xi'an, China (No. GX1801), the National Natural Science Foundation of China (No. 81671778 and No. 61672422), and the National Key Research and Development of China (No. 2017YFA0205202).
Author Disclosure Statement
The authors declare that no competing financial interests exist.