
Abstract
Abstract
Approximate Bayesian computation (ABC) is a useful technique developed for solving Bayesian inference without explicitly requiring a likelihood function. In population genetics, it is widely used to extract part of the information about the evolutionary history of genetic data. The ABC compares the summary statistics computed on simulated and observed data sets. Typically, a forward-in-time approach is used to simulate the genetic material of a population starting from an initial ancestral population and following the evolution of the individuals by advancing generation by generation under various demographic and genetic forces. This approach is computationally expensive and requires a large number of computations making the use of high-performance computing crucial for decreasing the overall response times. In this work, we propose a fully distributed web service-oriented platform for ABC that is based on forward-in-time simulations. Our proposal is based on a client-server approach. The client enables users to define simulation scenarios. The server enables efficient and scalable population simulations and can be deployed on a distributed cluster of processors or even in the cloud. It is composed of four services: a workload generator, a simulation controller, a simulation results analyzer, and a result builder. The server performs multithread simulations by executing a simulation kernel encapsulated in a proposed libgdrift library. We present and evaluate three different libgdrift library approaches whose algorithms aim to reduce execution times and memory consumption.
1. Introduction
The Approximate Bayesian computation (ABC) is a useful technique developed for solving Bayesian inference without explicitly requiring a likelihood function (Beaumont et al., 2002; Turner and Zandt, 2012). It is widely used by evolutionary geneticists to infer parameters of distributions (such as mutation rates, population scenarios, and demographic events) that govern certain events that, according to the hypothesis, happened somewhere in the past of a population when reconstructing its genetic history. The core of ABC is the likelihood function that expresses the probability of the observed data under a particular statistical model. However, when using simulation models, the likelihood function is difficult to be defined analytically and tends to be computationally expensive. Simulation is used as a tool for estimating the evaluation of the likelihood function.
In this context, two main approaches have been used for simulation: backward-in-time and forward-in-time. The backward-in-time simulation also known as coalescent theory (Kingman, 1982) identifies the most recent common ancestor of two individuals of a population. Then, a stochastic process coalesces these individuals. Thus, this approach starts from the observed sample of the population in the present and works backward to infer the genetic history of the population. The forward-in-time simulation focuses on individuals and usually uses a discrete generation scheme where different genetic or demographic events such as mutation and selection may occur at every generation. It starts from an ancestor population and follows its evolution by simulating the life cycle of each individual: birth, selection, mating, reproduction, mutation, migration, and death.
In this work, we focus on forward-in-time simulations driven by genetic drift algorithms because it allows to simulate genetic samples under complex realistic demographic scenarios. Forward-in-time simulations are only restricted by the assumptions of the model used to describe the genetic drift. Genetic drift is one of the basic mechanisms of evolution. It is used to represent the situation when some individuals may—by chance—leave behind a few more descendants than other individuals.
Currently, there are a number of simulators proposed in the technical literature for performing forward-in-time genetic simulations, such as the simuPOP tool (Peng and Kimmel, 2005), which is a general purpose forward-in-time population genetics simulator. It uses Phyton scripts to manipulate populations. Messer (2013) presented the SLiM simulator. It was designed to study the effects of linkage and selection on a chromosome-wide scale. Later, Haller and Messer (2016) presented the SLiM 2 simulator, which includes a graphical user interface (GUI) for simulation construction, interactive runtime control, and dynamic visualization of simulation output. Thornton (2014) proposed a C++ library of routines named Fwdpp, which is intended to facilitate the implementation of forward-in-time population genetics simulations by abstracting basic operations required for simulating custom models. However, most of the current simulators are developed either for desktop computers or for high-performance computing (HPC) clusters. The simulators for desktop provide a GUI but are restricted to small models due to hardware limitations and simulations take too long to complete. Simulators designed for HPC clusters require advanced knowledge on shell scripting and compiling skills but allow to simulate several (and bigger) models.
In a previous work (Sepulveda et al., 2017), we presented a simulation library named libgdrift 1.0. It was designed to execute forward-in-time simulations driven by genetic drift algorithms. The library optimizes the memory access and uses a two-phase compression technique based on a quaternary conversion to reduce the amount of memory and the execution time of the simulations. We showed that our library can outperform other state-of-the-art simulators.
In this work, we present a fully distributed web service-based platform, named gdrift++ (available at http://200.9.100.196:31080/#/home). Our genetic drift simulation platform aims to tackle the following requirements (Liu et al., 2008): (1) speed (perform as much simulations as possible in a short time), (2) scalability (because of large number of simulations executed and their computational costs), and (3) flexibility (to properly simulate different population dynamics).
The proposed platform is designed with a client-server approach to perform ABC (Beaumont, 2010; CsillÃl'ry et al., 2010) for parameter inference and model selection. It provides a user-friendly GUI and takes full advantage of HPC cluster resource capabilities. At the client side of our platform, we can define different simulation scenarios and set some parameters like the mutation rate. The server can be deployed on the cloud, which uses REpresentational State Transfer (REST) protocol (Fielding, 2000). REST defines the architecture for building large-scale distributed systems by delivering an alternative method for remote procedure calls across the Internet. REST provides an easy way to publish and consume web services (Vinoski, 2008). The server is composed of four services: (1) a workload generator (WG) used to build the simulation scenarios and prepare the workload, (2) a simulation controller (SC) used to execute the simulations with different parameters in parallel by triggering the execution of the libgdrift library, (3) a simulation results analyzer (SRA) that evaluates partial results of the simulations and may adjust certain parameters, and (4) a results builder that builds graphics to present the statistical results.
The libgdrift1.0 library stores for each individual from every population all the information regarding their genetic markers variations during the simulation, including all applied mutations. Although this feature simplifies the conceptual model of the simulator, it implies a great amount of replicated information, in all individuals that share the same version of a marker. Moreover, many variations are only valid for a certain amount of time during the simulation, but they could be discarded before reaching the final generation, so there is also a certain amount of wasted computation. Therefore, in this work, we also introduce two additional simulation libraries, named mutation-tree and mutation-vector. The former is based on a tree data structure and the latter uses a vector data structure to represent the mutations produced in each generation. Both libraries aim to reduce the amount of memory, improve CPU-cache memory access, and reduce the execution time of the simulations. To evaluate our proposal, we use the Wright–Fisher model (Wright, 1931; Fisher, 1999) where each individual has one gene, and at every generation, the population dies but another one is born at the beginning of the next generation, so the population size remains stable.
The remaining of this article is organized as follows. In Section 2, we present related works. In Section 3, we present our proposed platform. Section 5 shows the experimental results and we conclude in Section 6.
2. Related Work
There are several approaches presented in the technical literature to perform ABC. Bouckaert et al. (2014) presented BEAST2, which is an open source, extensible, and flexible software platform devised to analyze Bayesian evolution. It implements a structured coalescent model that allows inference of subpopulation sizes and migration rates together with location-annotated genealogies (structured trees) from genetic data. Huang et al. (2011) proposed MTML-msBayes (multi-taxa multi-locus msBayes). It is a software that implements a comparative phylogeographic analysis of multiple codistributed taxon-pairs using a hierarchical ABC model. The DIYABC (Cornuet et al., 2014) is a software package for a comprehensive analysis of the history of populations using ABC on DNA polymorphism data. It can be used to compare evolutionary scenarios and quantify their relative support and estimate parameters for one or more scenarios. It is based on a backward-in-time approach.
Liepe et al. (2010) presented a framework named ABC-SysBio for parameter estimation and model selection from experimental data in biological systems using ABC. ABC-SysBio implements likelihood-free parameter inference and model selection in dynamical systems. It is designed to work with both stochastic and deterministic models written in Systems Biology Markup Language. Arenas et al. (2015) presented a computer framework named CodABC to co-estimate recombination, substitution, and molecular adaptation rates by ABC from aligned coding sequence data. The tool is based on a special version of the coalescent simulator CoalEvol that implements recombination, a variety of migration models, demographics, and user-defined populations/species trees.
De Mita and Siol (2012) presented an Evolutionary Genetics and Genomics Library (EggLib) software package written in C++/Python. It provides a set of tools for processing biological sequence data, analyzing nucleotide alignments, performing coalescent simulations allowing rarely featured mutation models, mutational bias, as well as explicit selfing and estimating demographic parameters through ABC. Sandoval-Castellanos et al. (2014) presented a Bayesian Statistical Inference of Coalescent Simulations (BaySICS) program that provides an integrated and user-friendly platform to perform coalescent simulations for DNA sequence data and ABC analysis including the estimation of posterior densities for population parameters and Bayes factors to compare models.
Dutta et al. (2017) proposed ABCpy, which is a modular scientific library for ABC written in Python. It provides an interface to run large-scale parallel simulations without the need for users to have knowledge of parallel programming. Wegmann et al. (2010) proposed a tool named ABCtoolbox. It is formed by a set of open source programs to perform ABC written in C++. The user can perform all the necessary steps of a full ABC analysis, including parameter sampling and prior distributions, data simulations, computation of summary statistics, estimation of posterior distributions, model choice, validation of the estimation procedure, and visualization of the results.
Most of previous works are based on the backward-in-time approach, which is faster because only genomics samples that survived until the present are simulated backward-in-time. The limitations of using a forward-in-time approach rely on the excessive computational requirements (execution times tend to be at least linear with respect to the number of individuals multiplied by the number of generations). In a previous work (Sepulveda et al., 2017), we presented a simulation library based on a forward-in-time approach driven by genetic drift algorithms. Results showed that our library reduces the running time and the amount of memory storage required by other well-known simulation software such as SLiM2 (Haller and Messer, 2016) and fwdpp (Kessner and Novembre, 2014). In this work, we propose a web service-based platform to perform ABC, which executes an optimized simulation library for population genetic drift.
3. Platform Overview
The gdrift++ platform is a fully distributed system designed for performing ABC for parameter inference and model selection in population genetic models. The gdrift++ platform is composed of a set of RESTful services. RESTful refers to web services that run the REST architecture, and REST is the architecture that runs over HTTP. The services communicate to each other by exchanging JavaScript Object Notation (JSON) documents via HTTP requests. Figure 1 shows the interaction between the client side (front-end) and the server side (backend). The server side consists of four main services: WG service, SRA service, results builder service, and SC service.

System overview: The client defines the simulation scenarios and visualizes the statistics. The server is composed of four services: the workload generator, the simulation controller, the simulation results analyzer, and the results builder.
3.1. Client side
The client side (front-end) consists of a Web-based service that allows the user to define different simulation scenarios. This service provides a user interface (Fig. 2) that helps to set general simulation parameters, such as the user identifier, simulation identifier, and maximum number of simulations, to define individuals (ploidy, chromosomes, genes, mutation rates, etc.) and to configure scenarios (event lists). With these settings, the service produces a user settings document for each experiment, which is sent to the server. A second file with the data sample of the target population is also sent to the server.
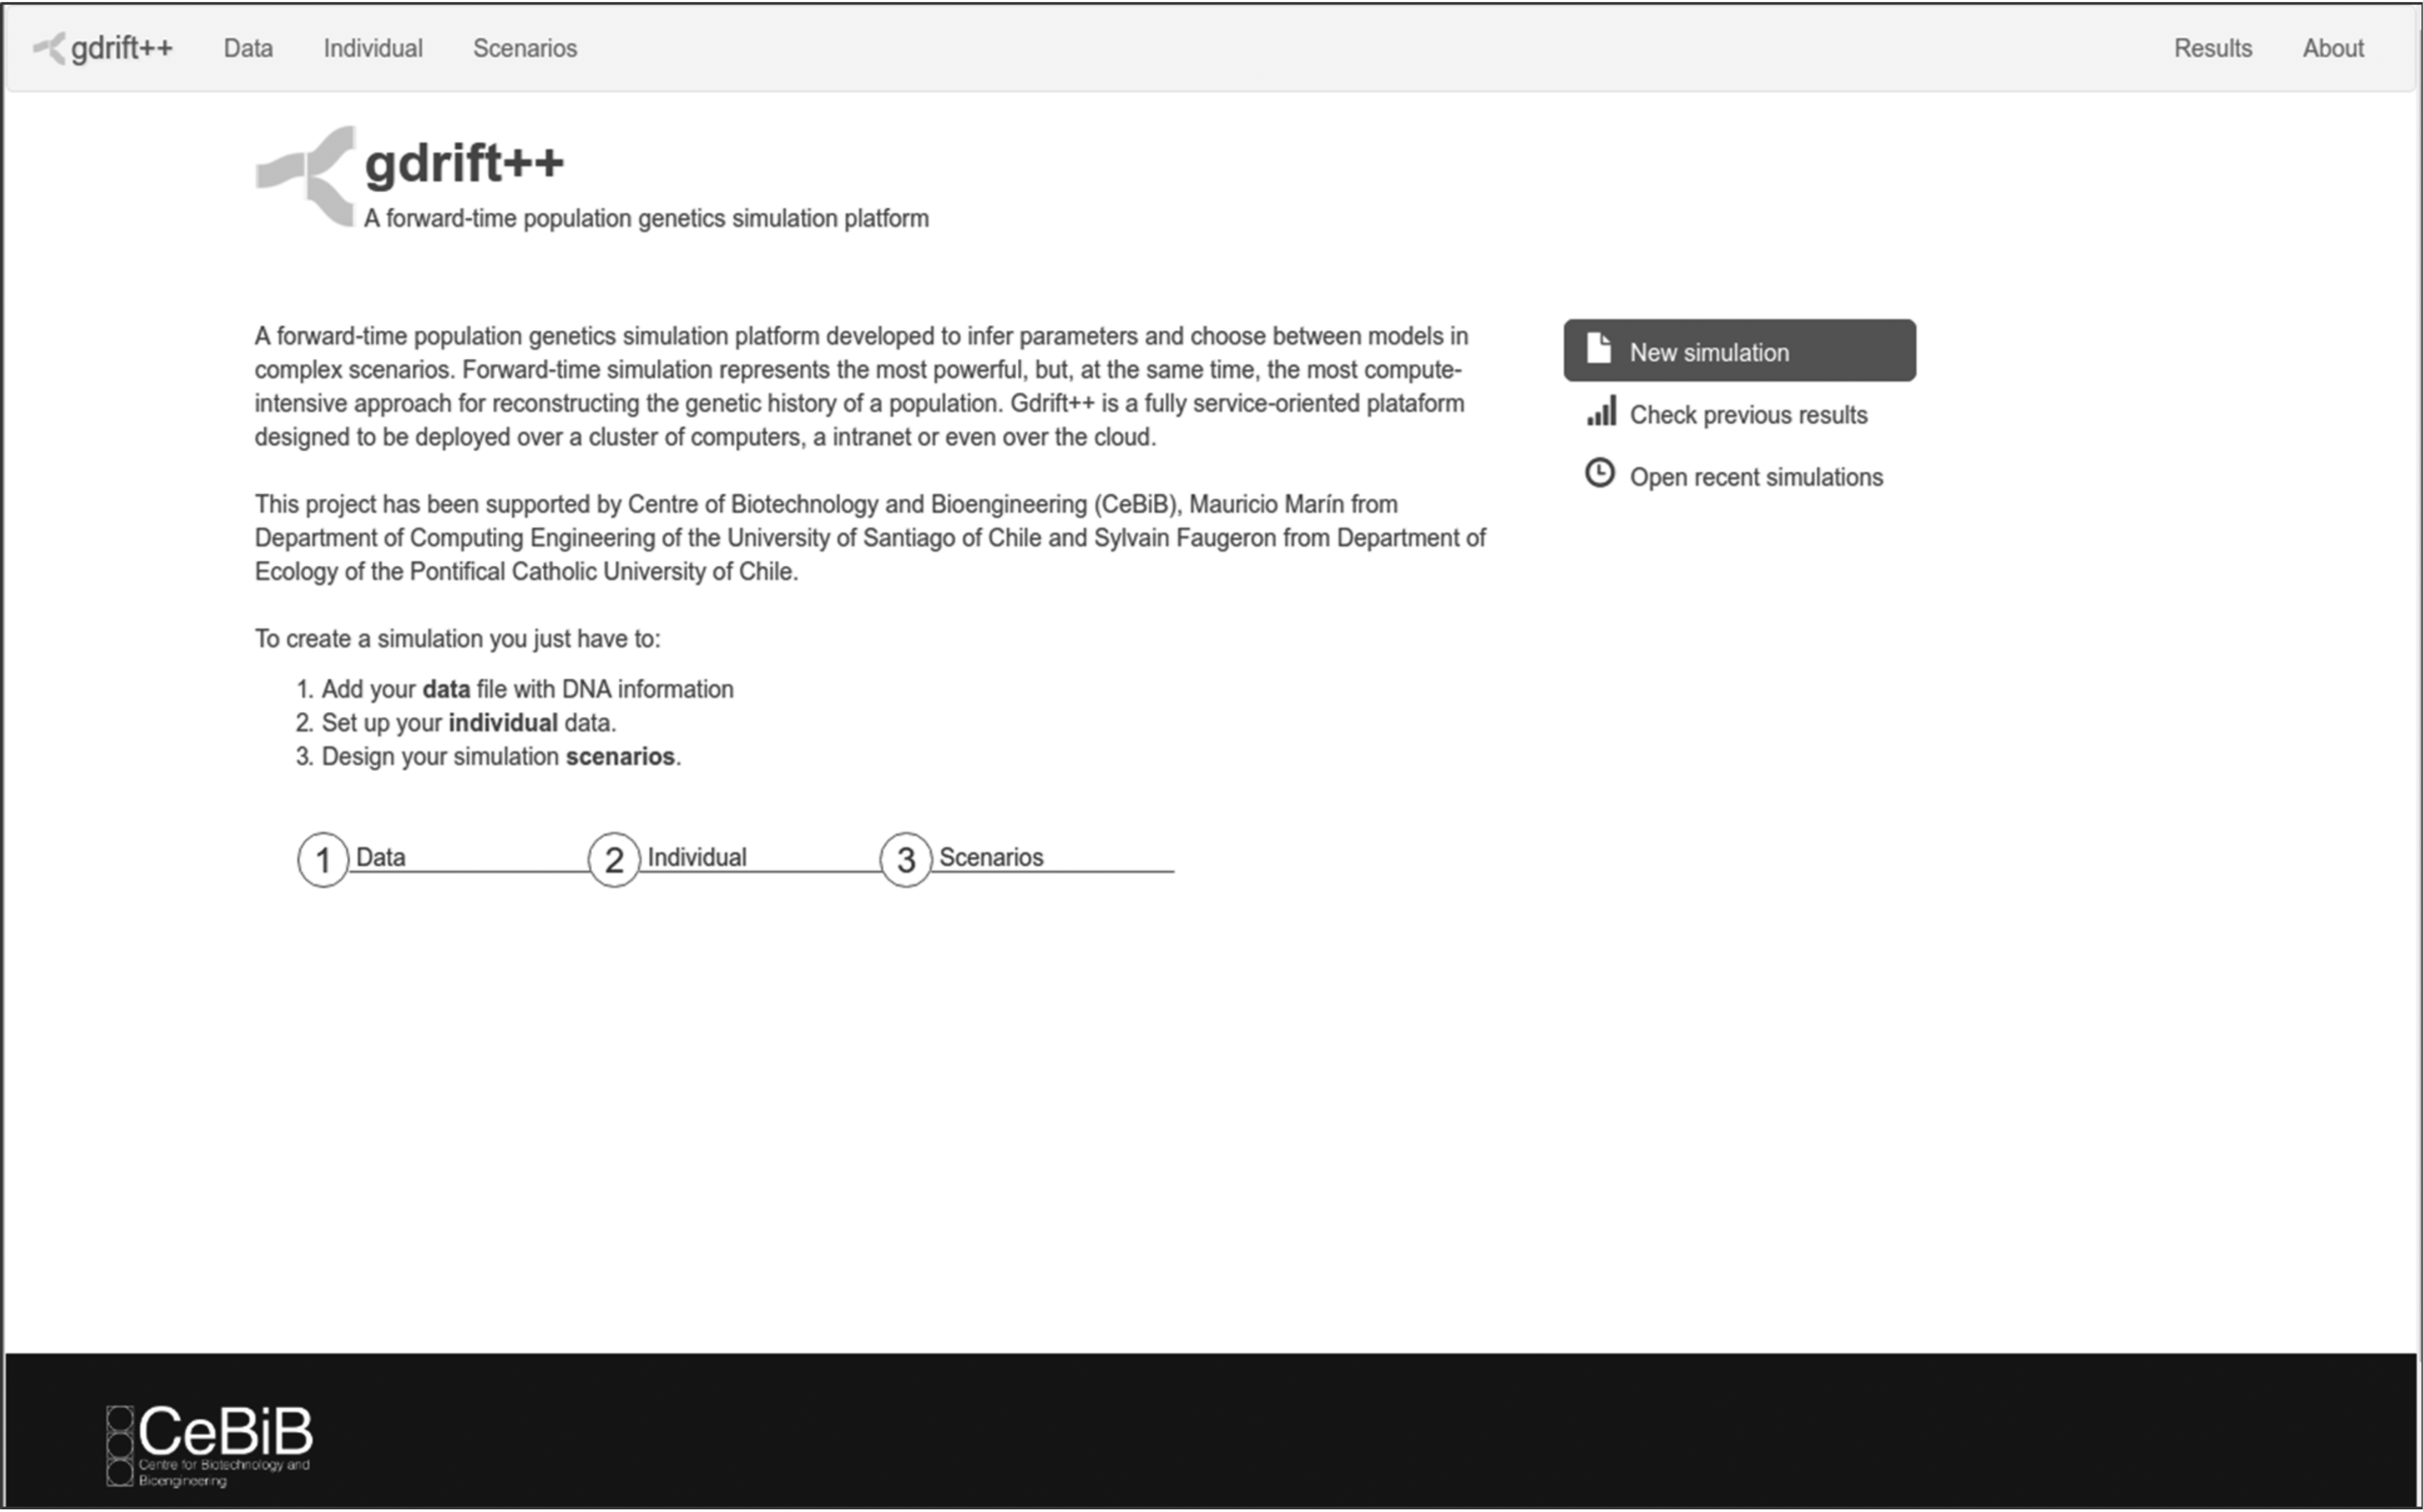
Screenshot of the web page deployed on the client side of the gdrift++ platform. The menu at the right of the screen allows to run a new simulation, checks previous results, and opens recent simulations. At the bottom, it shows the steps required to create a new simulation.
One of the main features of the client service is the way it allows to define simulation scenarios (third step in Fig. 2). To achieve this goal, the user has to set parameters for the individuals of the population as well as the events that occur during the simulation. The scenarios are defined using Sankey diagrams, where nodes (rectangles) represent events and links (gray areas) represent populations. At the bottom of the figure, the values t0 … t4 represent the time the event should have occurred. The Sankey diagram is a specific type of flow diagram in which the width of the links is shown proportionally to the flow quantity. An example can be observed in Figure 3. At the left, we show the list of events such as increase/decrease of the number of individuals, migration of a subset of the population, a merge of different populations, or even the extinction of the population.
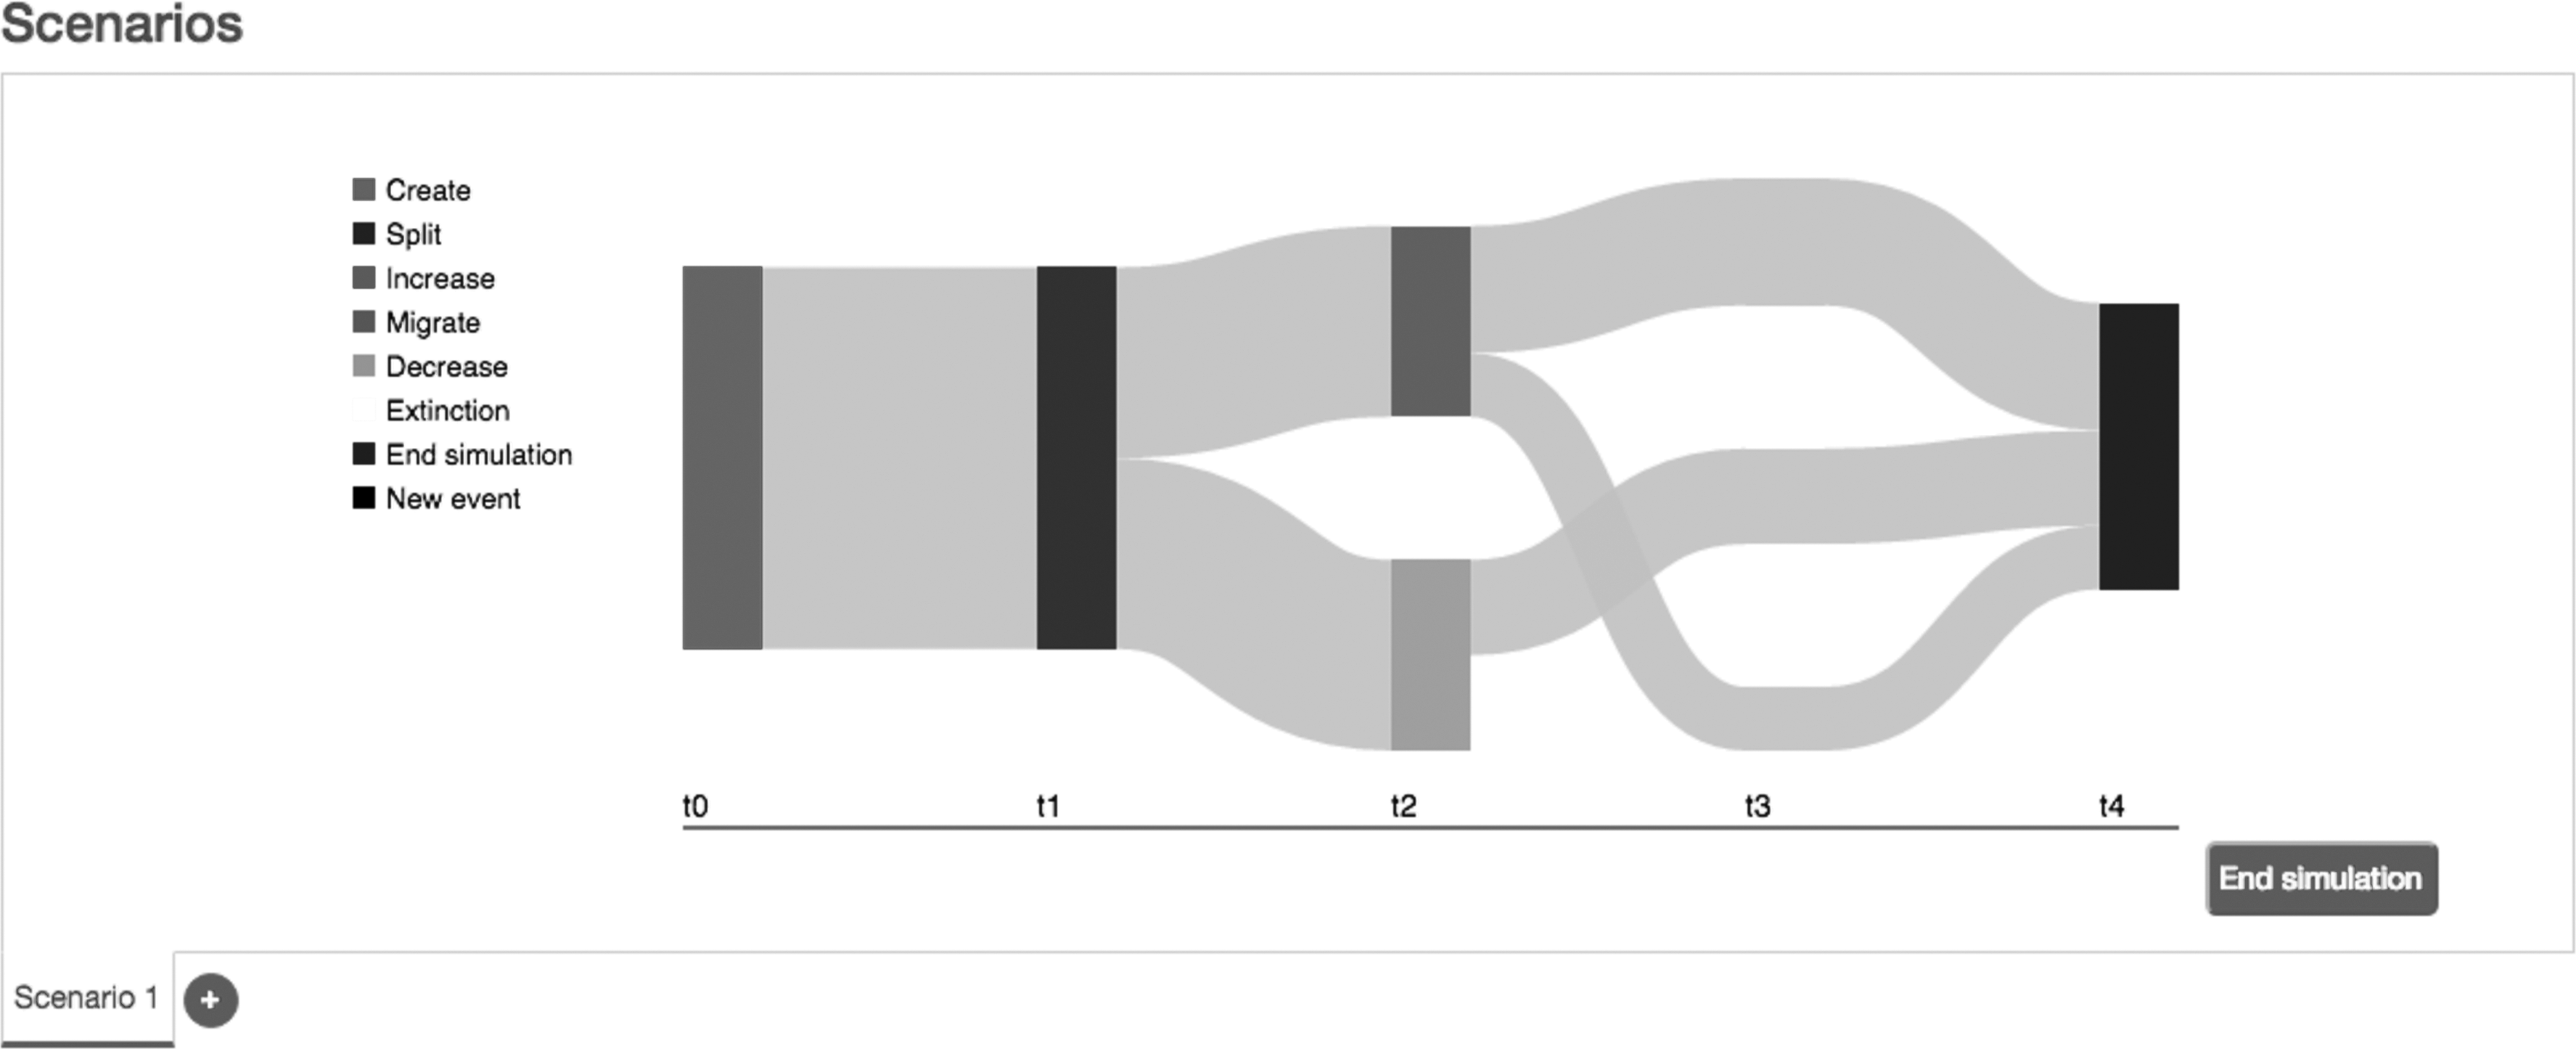
Sankey diagram used in the client side to define the scenarios of simulation.
3.2. Server side
The server (backend) is composed of four services running on a distributed platform. Each service can be deployed on different clusters of multi-core computers or even in a cloud system. In the following, we describe each service.
3.2.1. WG service
The WG service creates batches of simulation specification documents based on the user setting documents. A simulation specification document is an instance of the user settings document. The batches of simulations specification documents are distributed among the SC services. To this end, the user setting document is recursively traversed to find JSON nested objects with the element “type.” The element “type” has two possible values: “random” or “fixed.” If “type” = “random,” another element identified with the keyword “distribution” is used to define the probability distribution and its parameters. Otherwise, it uses the “fixed” value specified by the user in the setting document.
3.2.2. SC service
The SC service is in charge of executing simulation threads based on the genetic drift simulation library called libgdrift 1.0 (https://github.com/robertosolargallardo/libgdrift). When a simulation specification document arrives from the WG service, the SC service checks whether there are computing resources (i.e., CPUs) available for executing the simulation. If so, the SC creates a thread instance of the libgdrift 1.0 and launches the simulation in background. Otherwise, the simulation specification document is queued until a computing resource is released. At the end of the simulation, statistics over the populations are computed and sent to the SRA service together with the simulation specification document. Furthermore, the SC service deployment is aimed for being elastic, that is, we can dynamically increase the number of SC services if we require as-fast-as-possible simulation results or we can dynamically decrease the number of SC services if there is no constraint about the response time.
3.2.3. SRA service
The SRA service compares the statistics of the sampled data obtained from the target population (datasampled) and the data obtained from the simulations (datasimulated) to determine the fitness level between both of them. The sampled data are received from the client side in a text-based format, which represents nucleotide sequences of populations. The statistics of the sampled data are computed and stored in main memory until the end of the experiment. Typically, statistics computed over samples correspond to different metrics, such as number of distinct haplotypes, number of segregating sites, mean and variance of pairwise differences, Tajima's D statistics, mean and variance of the numbers of the rarest nucleotide at segregating sites, and number of private segregating sites.
When a message with the results of a simulation arrives from a SC service, the fitness level d of the data obtained from the simulations is computed as follows:
Furthermore, the SRA service keeps two control counters: (1) a counterbatch, which represents the number of runs within each batch. It is increased when a message containing the results of the simulations (datasimulated) arrives to the SRA service. (2) A counteraccepted, which represents the number of accepted results. It is increased when the simulation results are within the tolerance threshold ɛ. If the counterbatch is equal to size of the batch of simulations and the counteraccepted is less than the maximum number of runs, the SRA service sends a message to the WG service to notify that the experiment has to continue. Then, the WG service has to send another batch of simulation specification documents to the SC service. Otherwise, a message is sent to the WG to notify that the experiment has to finish. Both the batch size and the maximum number of runs are parameters of our platform.
3.2.4. Results builder
The result builder service is in charge of plotting the simulation results stored in secondary memory. It creates the figures and displays them into the client side. Figure 4 shows a screenshot of the results deployed on the client service.
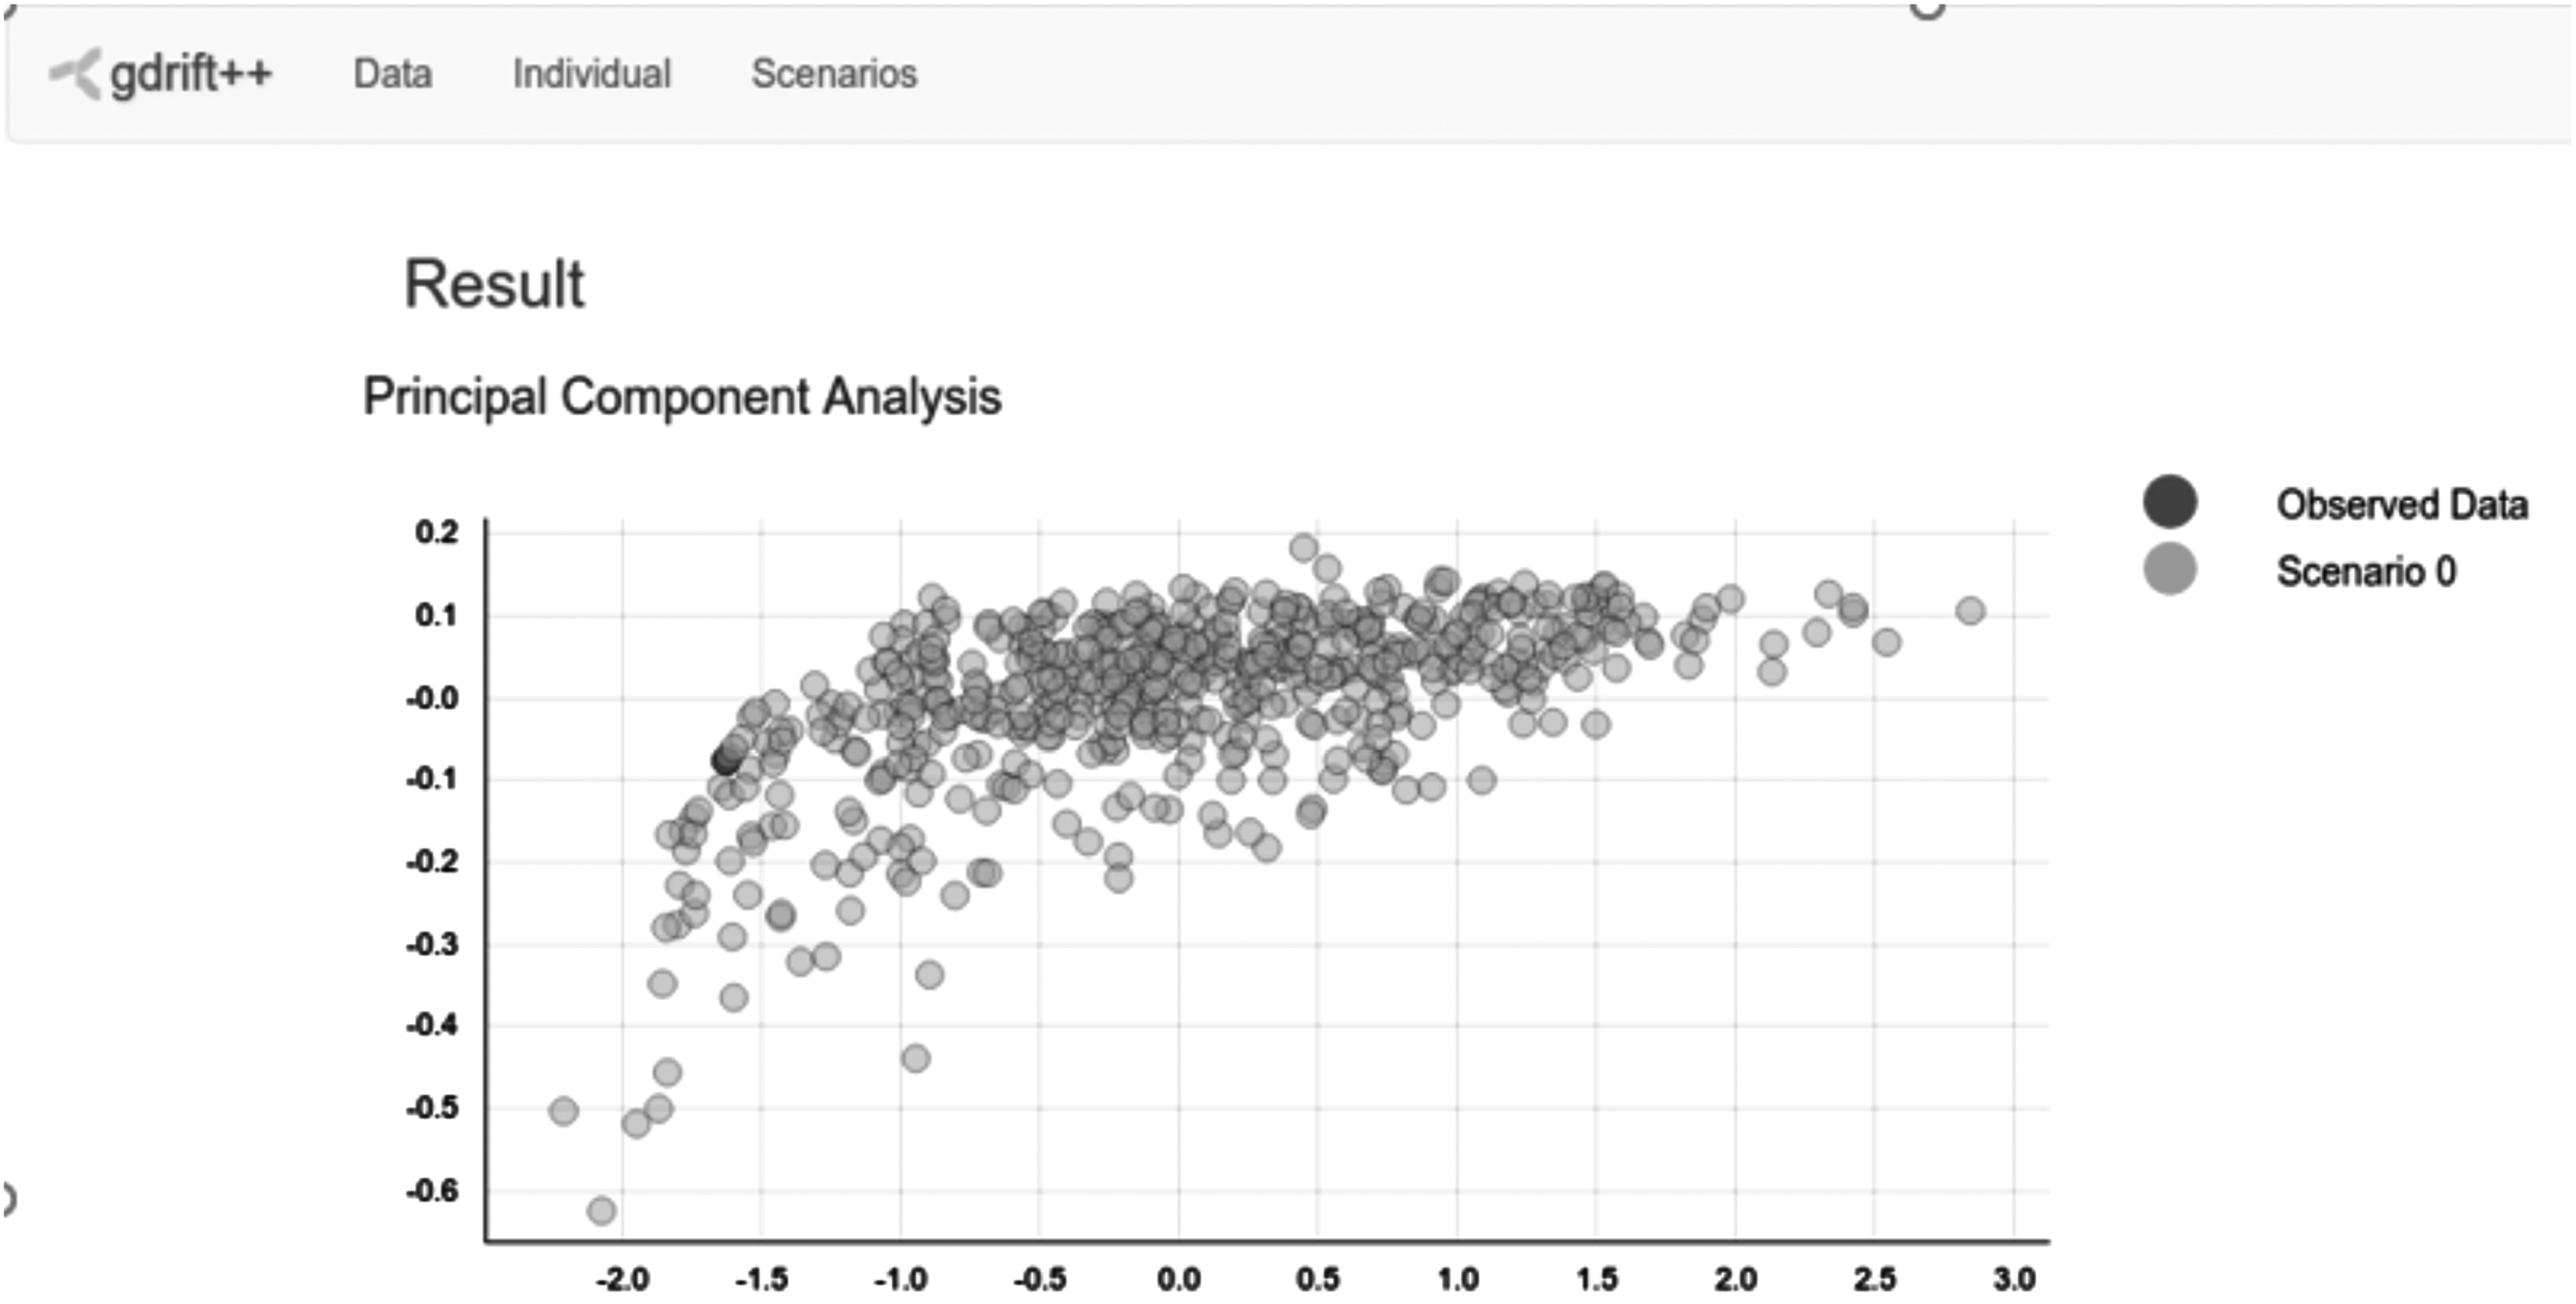
Screenshot of the results presented in the client side of our proposed platform.
4. Libgdrift Simulation Library
The libgdrift simulation library aims to simulate forward-in-time genetic drift models. Libgdrift supports the following events:
The individuals of a population are characterized by their ploidy (number of sets of chromosomes), and a set of chromosomes that are composed of a set of genes. Genes may be either STR (also known as microsatellite); tandem repeats of short DNA motifs (between 2 and 5 base pairs that are repeated several times) or SNP; variation in a single nucleotide that occurs at a specific position in the gene. We choose these types of genetic markers since they are the most frequently used for generating genetic data sets in population genetics simulations.
As we explained before, a disadvantage of forward-in-time simulations is the way populations are handled during generation-to-generation transitions. Classical approaches create copies of each population to perform each transition. This is highly expensive in terms of memory utilization as the population size increases. In this section, we present three different approaches of the libgdrift simulation library devised to improve the running time of the simulations as well as the amount of memory (number of copies of each population) required to execute those simulations.
4.1. Libgdrift 1.0
Our first approach of the libgdrift simulation library (Sepulveda et al., 2017) processes the simulation specification documents. To this end, the library creates a data structure named GenePool using the description of the individuals. A second data structure named EventList keeps events with information about the description of the scenario. Events are composed of a type (i.e., create, merge, split), a timestamp, and a parameters list. Events are stored in the EventList sorted by their timestamp in chronological order.
The code of the library is optimized so that all internal objects are stored into array-like data structures (std::vector or native C++ arrays) and are contiguously allocated into memory during the execution of the simulation. Furthermore, we adapt the simulator code to avoid unpredictable branches and, as a consequence, the algorithmic complexity is significantly reduced. Additionally, to reduce the amount of memory, we keep two copies of each simulated population during the simulation: a source population popsrc and a destination population popdst. While random sampling is performed over popsrc, offspring individuals are stored into popdst. At the end of the generation and right before the next generation, populations popsrc and popdst are swapped.
We also reduce the number of point mutations computations. Point mutations occur during DNA replication and may involve a single base pair substitution, insertion, or deletion. Our point mutation approach consists of performing point mutations at the end of each generation instead of evaluating each gene per individual. To this end, we draw a random number from a binomial distribution
Finally, our first approach uses a two-phase compression technique. In the first phase, a quaternary base conversion translates the four abbreviated DNA nucleotides in alphabetical order (A, C, G, T) into quaternary digits in numerical order (0, 1, 2, 3) by using a simple mapping function. Since there are only four digits, they can be represented by two binary digits. In this way, we can store four nucleotides per byte.
In the second phase, at the beginning of the simulation, the libgdrift 1.0 creates a GenePool, which stores all genes and their variants. Each variant points to a random generated gene of reference. Since individuals share most of their genetic material, they do not explicitly store their genes as attributes (no copies of existing instances), instead individuals point to GenePool entries. When a mutation is triggered for a variant
4.2. Mutation-tree
The mutation-tree approach is a tree-based implementation of a gene where each node represents an allele. That is, the nodes represent variations for which at least one individual contains that version or a mutation derived from it. An individual is composed of a set of pointer alleles, where each one refers to a tree node indicating a relationship. When a mutation is triggered, a new leaf node is created, and the mutation counter is increased by one. This leaf node inherits all mutations from its parent node and so on recursively until the root node. New nodes are always leaf nodes.
Mutations are not actually applied until the end of the simulation since the nodes of the tree may be removed during the simulation process. When a leaf node is not referenced anymore, this node is removed and its mutations are discarded. When an internal node is not referenced by any individual and it has only one child, the node is removed and the tree is contracted, that is, both nodes (parent and child) are merged and their mutation counters are accumulated. When the simulation ends, the mutations are applied by traversing the tree.
Figure 5 shows an example of the mutation tree data structure obtained with the mutation-tree library. The numbers next inside each node represent the number of references. The number in the links represents the number of mutations. That is the number of individuals that have the allele represented by the node. The data structure used to implement the mutation-tree is kept in main memory. The arrays of colored “insects” represent the individuals pointing to the leaf nodes of the tree.
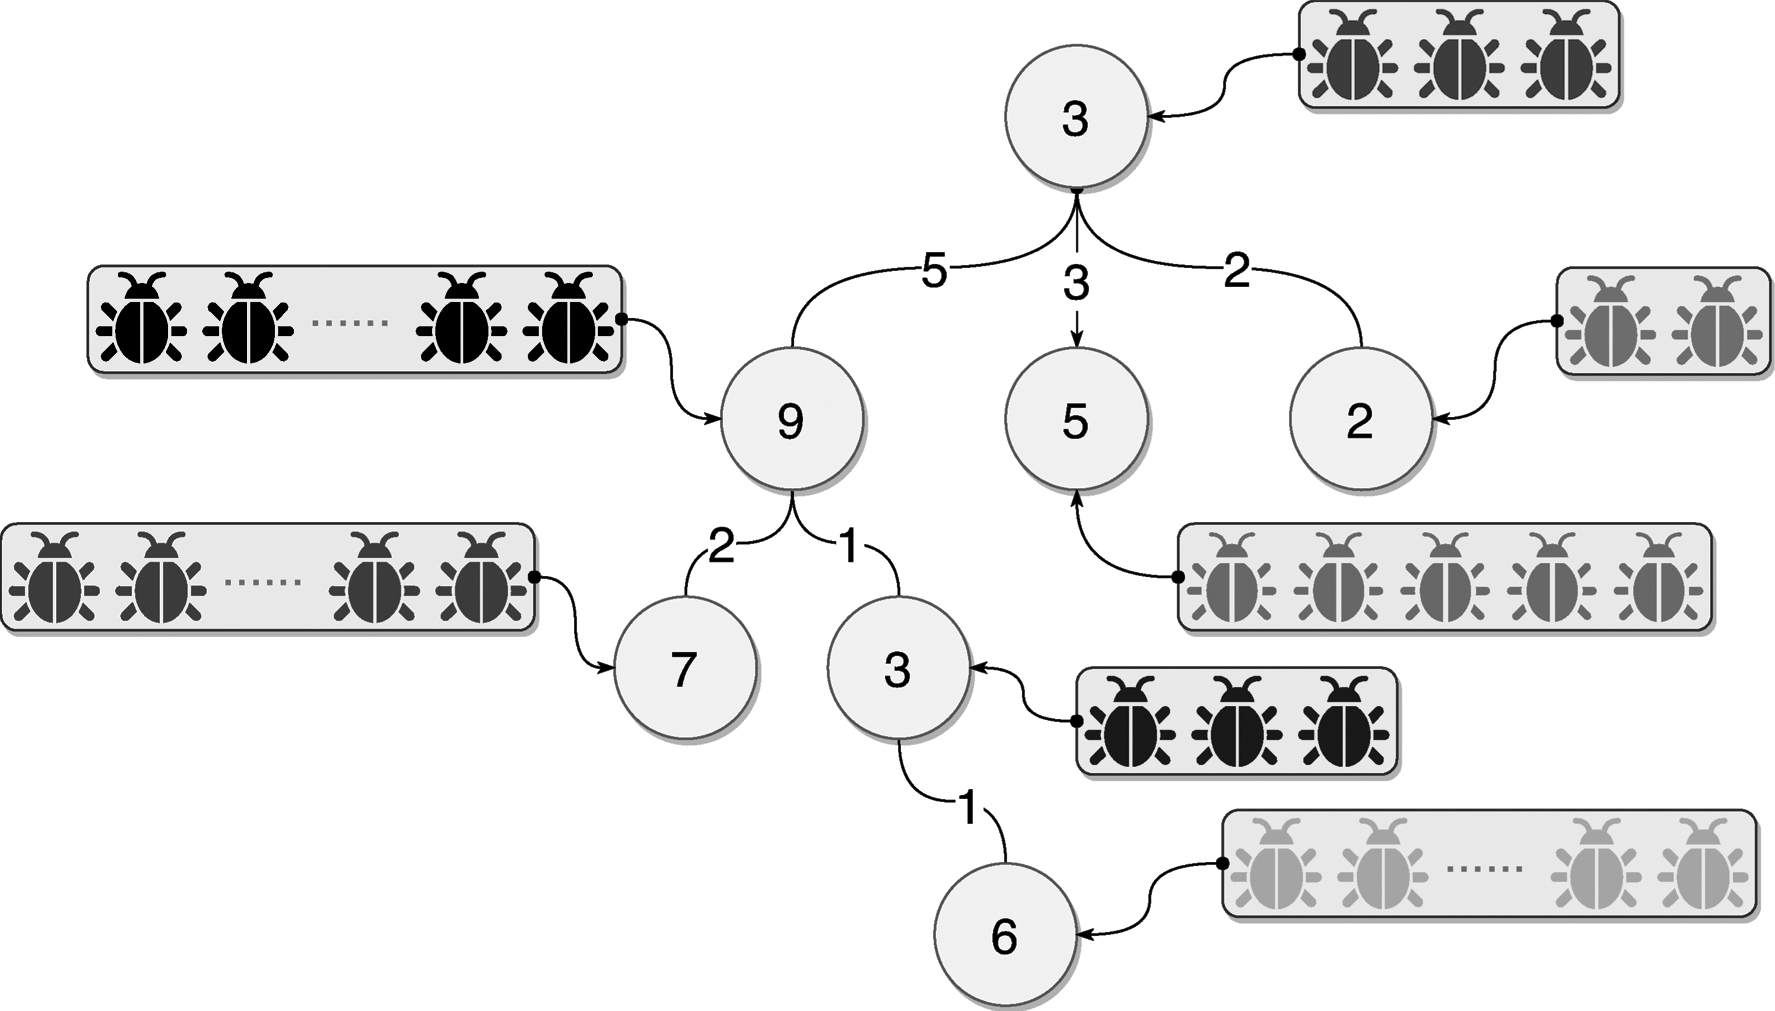
Example of the mutation-tree data structure. The numbers inside each node indicate the number of individuals that have an allele represented by the node. The number in the links represents the number of mutations.
4.3. Mutation-vector
The main difference between mutation-vector library and previous library versions is the new mutations storage system. In the original model of libgdrift 1.0, each individual in the simulation stores all the information regarding their alleles for each marker, including all applied mutations. Although this feature simplifies the conceptual model of the simulator, it implies a great amount of replicated information in all individuals that share the same allele. Moreover, the alleles of many individuals are only valid for a certain period of time during the simulation, but they could be discarded before reaching the final generation, so there is also a certain amount of wasted computation.
In the mutation-vector library, each individual only stores the identifier for their current allele for each genetic market. Additionally, the simulator keeps a mutations vector data structure storing the identifier of the direct ancestor for each allele. During the simulation process, no mutation is applied. We only account the mutations that should be applied for each allele, by means of the references to their ancestors in the mutation vector when the sequences for the last generation are needed after the simulation finishes. We assume that there is an allele with identifier 0, without a parent (represented with the value −1 in the mutations vector). That allele represents the original sequence at the beginning of the simulation. When an individual receives a mutation, we create a new identifier
At the end of the simulation, when it is time to compute the genetic statistics of the resulting population, we apply the mutations to the individuals. For this purpose, we use a temporal data structure named
The algorithm receives the identifier of a single allele whose sequence is needed, the mutation vector data structure that stores the identifier of the parent for each allele, the temporal structure named applied_mutations to store the generated sequences, and the mutation model for the particular genetic marker. It return the generated sequence to be used to compute genetic statistics.
5. Experimental Results
In this section, we present the evaluation of the gdrift++ platform running the three proposed libgdrift libraries. We simulate the Wright–Fisher model (Wright, 1931; Fisher, 1999). All the C++ codes were compiled using gcc version 5.3.1. Peak memory usage was measured by using “massif,” a memory profiler that is part of the Valgrind tools. Experiments were executed on two AMD Opteron processors with 32-core, 128 GB of RAM memory, and an L1 cache of 2048 KB. The WG service, the results builder service, and the SRA service are executed on one processor. The SC service is executed on the other processor, so the simulations can be executed with up to 32 cores.
5.1. Performance evaluation
The simulation parameters used in the following experiments correspond to (1) population size, (2) mutation rate, and (3) locus length. The values for the parameters used in the experiments correspond to a population size of 1000 individuals, 1000 generations, mutation rates with values
Figures 6a, b and 7 show the running time obtained with 32 cores with a locus length of 10 KB, 100 KB, and 1 MB, respectively. The x-axis shows the mutation rate ranging from 10−9 to 10−6. In general, both the mutation-vector and the mutation-tree present lower running time than its predecessor the libgdrift 1.0 library. For low mutation rates, the mutation-tree library tends to present the best performance. However, when the mutation rates are higher the vector-tree tends to drastically outperform the other simulation libraries. This behavior is mainly because of the storage optimization implemented by the mutation-vector library. As we increase the amount of data simulated, the mutation-vector library optimizes the CPU-cache memories access (Fig. 9).

Running time obtained with 32 cores in nanoseconds, a mutation rate from 10−9 to 10−6, and for a locus length of
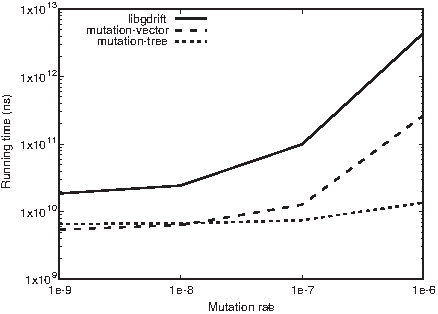
Running time obtained with 32 cores in nanoseconds, a mutation rate from 10−9 to 10−6, and for a locus length of 1 MB.
In Figure 8, we show how our proposed gdrift++ platform scales when executing all the simulation libraries. The y-axis shows the execution time in nanoseconds and the x-axis shows the number of cores. In Figure 8a, we use a mutation rate of 10−9, and in Figure 8b, we use a mutation rate of 10−6. In both cases, the mutation-tree and the mutation-vector present almost constant execution times as we increase the number of cores. However, the original library, libgdrift 1.0, presents good results for a low number of cores (1–8), but it cannot scale as the execution time tends to increase with a larger number of cores (16–32). This behavior is also explained in Figure 9.
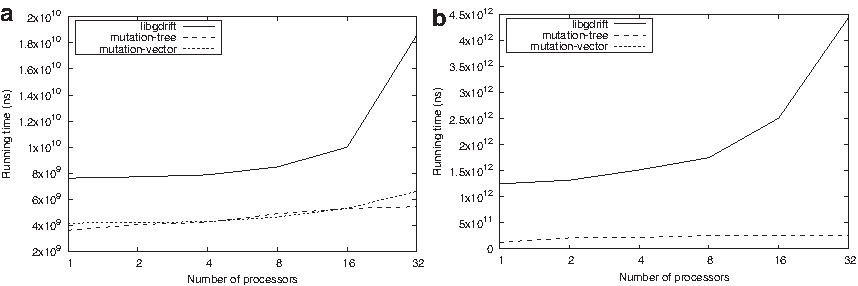
Scalability: Execution time in nanoseconds obtained with different number of cores, a locus length of 1 MB for
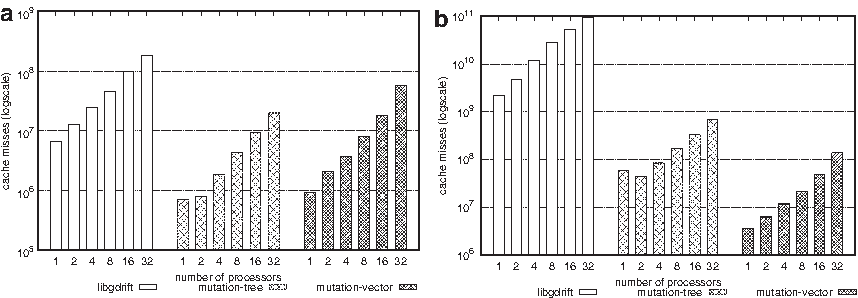
Number of cache hits obtained with different number of cores, a locus length of 1 MB for
Figure 9 shows the number of CPU-cache misses reported by all three simulation libraries. The x-axis shows the number of cores. In Figure 9a, we use a mutation rate of 10−9, and in Figure 9b, we use a higher mutation rate of 10−6. With more cores, the number of cache misses tends to increase as the cores compete to use the same memory resources, and more data are transferred from the RAM memory to the cache memory of the cores. Also notice that both mutation-vector and mutation-tree libraries drastically reduce the number of cache misses. That is mainly because both libraries are optimized to reduce the amount of data required to simulate the population evolution in different scenarios. With a larger mutation rate (Fig. 9b), the mutation-vector reduces by almost 30% the number of cache misses reported by the mutation-tree.
5.2. Effectiveness evaluation
In this section, we compare the parameters distribution inferred by our proposed gdrift++ and the DIYABC simulator. We evaluate two scenarios with different sequences of events like create, increase, split, decrease, and end simulation. For this set of events, we infer the following parameters: mutation rate, create size, increase rate, increase time, split time, decrease rate, decrease time, and simulation time. To this end, we first show that all the proposed simulation libraries present similar distribution of values for all parameters. In Figure 10, we show the probability density function of the values for the parameters mutation rate and create size (number of individuals created). We show the results for these two parameters because the results achieved by the other parameters are similar.
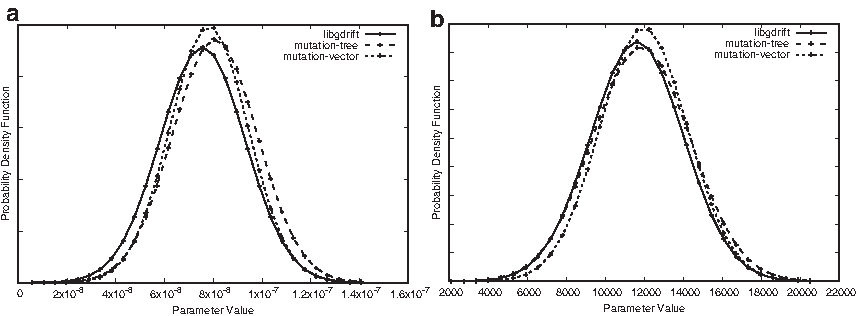
Density of the distribution of values for the inferred parameters:
The DIYABC uses a backward-in-time approach to run the simulations, meanwhile the gdrift++ uses a forward-in-time approach. Thus, to compare the distribution of the parameters, we invert the sequence of events executed in each simulator. In the first scenario, the sequence of events executed by the gdrift++ are create, increase, split, decrease, and end simulation. Therefore, the DIYABC executes the same events but in reverse. In the second scenario, the sequence of events executed by the gdrift++ are create, split, decrease, and end simulation (again the DIYABC executes the same events in reverse order).
We compute the relative error, which is the measure of the differences between values obtained by the parameters distributions inferred by the DIYABC and by the gdrift++. It is defined as
Relative Error for the Mean and Standard Deviation Reported by the Parameter Distributions Achieved by DIYABC and Gdrift++ for Two Scenarios with Different Sequences of Events
STD, standard deviation.
Results show that the error reported by both metrics—the mean and standard deviation—for the different parameters is very low. Only the standard deviation for the mutation rate and the create size parameters report an error close to 2% and 5%, respectively. These results show that our proposal can obtain parameters distributions similar to the ones reported by the DIYABC.
6. Conclusions
We have proposed a web-service based platform for ABC for genetic drift simulations named gdrift++. The platform is based on a client-server approach. The client executes a web service, which shows the user interface used to define the scenario to be simulated and displays the figures with summary of statistic information obtained from the simulations. The server is composed of four services in charge of creating batches of simulations, analyzing the results, and building the results.
For the server side, we have also proposed two new population genetics simulation libraries named mutation-tree and mutation-vector. Both aim to reduce the running time and the amount of memory required to execute the simulations. Instead of maintaining information about the status of each individual, we store and process the mutations that occur in the entire population. This has a direct impact on the cache access and therefore on the performance of the platform. The experiment results show that the mutation-vector library drastically reduces the cache misses and therefore presents lower running times than alternative libraries reported in the literature. Finally, we have shown that the proposed client-server platform achieves similar parameter distributions than alternative software packages proposed so far such as DIYABC (Cornuet et al., 2014). This makes our proposal a suitable alternative in both quality of results and computational performance.
Footnotes
Acknowledgment
This research was supported by the supercomputing infrastructure of the NLHPC Chile, partially funded by CONICYT Basal funds FB0001, Fondef ID15I10560.
Author Disclosure Statement
The authors declare there are no relationships with any people or organizations that could inappropriately influence (bias) this work.