
Abstract
Abstract
Given the continuous advancement in genome sequencing technology, large volumes of gene expression data can be easily obtained. However, the corresponding increase in genetic information necessitates adoption of a new approach for network estimation. Data dimensions increase with the progress in genome sequencing technology, thereby making it difficult to estimate gene networks by causing multicollinearity. Furthermore, such a problem also occurs when hub nodes exist, where gene networks are known to have regulator genes that can be interpreted as hub nodes. This study aims at developing methods that demonstrate good performance when handling high-dimensional data with hub nodes. We propose regression-based approaches as feasible solutions in this article. Elastic-net and adaptive elastic-net penalty regressions were applied to compensate for the disadvantages of existing regression-based approaches employing LASSO or adaptive LASSO. Experiments were performed to compare the proposed regression-based approaches with other conventional methods. We confirmed the superior performance of the regression-based approaches and applied it to actual genetic data to verify the suitability to estimate gene networks. As results, robustness of the proposed methods was demonstrated with respect to high-dimensional gene expression data.
1. Introduction
Health care technology has improved dramatically with taking advantage of recent developments in emerging technologies, including big data, Internet-of-things, and genetic testing technologies. Precision medicine plays a vital role in health care by providing patient-tailored care with due consideration of environmental factors, lifestyles, and genes. Gene network estimation has emerged as a leading tool in precision medicine for preventing and diagnosing fatal diseases such as cancer (Weston and Hood, 2004; Alansari et al., 2018).
In general, >10,000 different messenger RNA species are detected in a single cancer sample. Such numbers cause high dimensionality, which becomes a serious problem in gene network analysis. In high-dimensional data, optimal model fitting using statistical methods is often impossible, because the solution obtained can be suboptimal and requires high computational times. This situation is called the “curse of dimensionality.” In particular, high dimensionality establishes spurious relationships in network estimation with genetic data, thereby rendering the estimation of gene networks difficult (Clarke et al., 2008). This has exposed the limitations of existing gene network estimation methods from the viewpoint of gene network analysis.
In this article, we aimed to improve the existing methods to solve the problem of gene network estimation under high-dimensional data. We found clues in the regression-based approaches of LASSO and adaptive LASSO (ADLASSO), which have been shown to have low complexity and high estimation accuracy (Zou and Hastie, 2005; Meinshausen and Bühlmann, 2006; Zou, 2006; Zhou, 2011; Han et al., 2016; Lee et al., 2017). To overcome the shortcomings of traditional regression-based network estimation approaches in high-dimensional genetic data, we applied elastic-net (Enet) and adaptive elastic-net (ADEnet) to resolve the multicollinearity and high-dimensional problems (Zou and Hastie, 2005; Zou and Zhang, 2009).
Network-estimation methods extensively used in bioinformatics were compared against the proposed regression-based approach. Typical bioinformatics methods include MINET, which uses mutual information, and the tree-based GENIE3 (Meyer et al., 2008; Irrthum et al., 2010). By performing experiments using various types of simulation data, the proposed method was validated for successfully handling high-dimensional genetic data.
The composition of this article is as follows. Section 2 describes simulation results, whereas Section 3 demonstrates feasibility of the proposed method by applying the same to colorectal cancerous gene data. Lastly, Section 4 gives the conclusions of this study.
2. Simulation Study
A brief review of previously reported network-estimation methods has been included in Section 1 of Supplementary Materials, and comprehensive descriptions of the proposed regression-based approach and existing methods are provided in Section 2 of Supplementary Materials. Four simulation data types were used in this study, and the relevant settings are given in Section 3 of the Supplementary Materials. The four types of simulation data used in the experiments were as follows: (1) genetic simulation data, (2) Peng's simulation data, (3) scale-free simulation data, and (4) band-type simulation data (Albert and Barabási, 2002; Peng et al., 2009; Han et al., 2016; Lee et al., 2017).
Genetic simulation data and Peng's simulation data are commonly divided into two cases depending on whether corresponding network edges are sparse or dense. The parameter D is expressed as the average number of edges per node; thus, the total number of edges in the network is
A comparison between these results was performed in two phases. During phase 1, regression-based approaches and methods used in bioinformatics were compared separately. During phase 2, final comparisons were performed using methods demonstrating satisfactory performance during phase 1. Results under nonhigh-dimensional simulation data (P = 50, 200; N = 100) are provided in Section 4 of the Supplementary Materials. The receiver operating characteristic (ROC) curves and computation times obtained under high-dimensional simulation data (P = 400; N = 100) are described in Section 2 of the text.
In this study, we compared the performance of the regression-based approaches using LASSO, ADLASSO, Enet, and ADEnet (Tibshirani, 1996; Zou and Hastie, 2005; Meinshausen and Bühlmann, 2006; Zou and Zhang, 2009; Han et al., 2016). Moreover, the proposed network estimation methods were validated by performing experiments employing the tree-based GENIE3 and other methods based on mutual information, including the algorithm for reconstruction of accurate cellular networks (ARACNE), context likelihood of relatedness (CLR), and multicast reduction network (MRNET) using the maximum relevance/minimum redundancy algorithm (Ding and Peng, 2005; Margolin et al., 2006; Faith et al., 2007; Meyer et al., 2008; Irrthum et al., 2010).
2.1. Comparison of results for genetic simulation data
2.1.1. Results for each approach
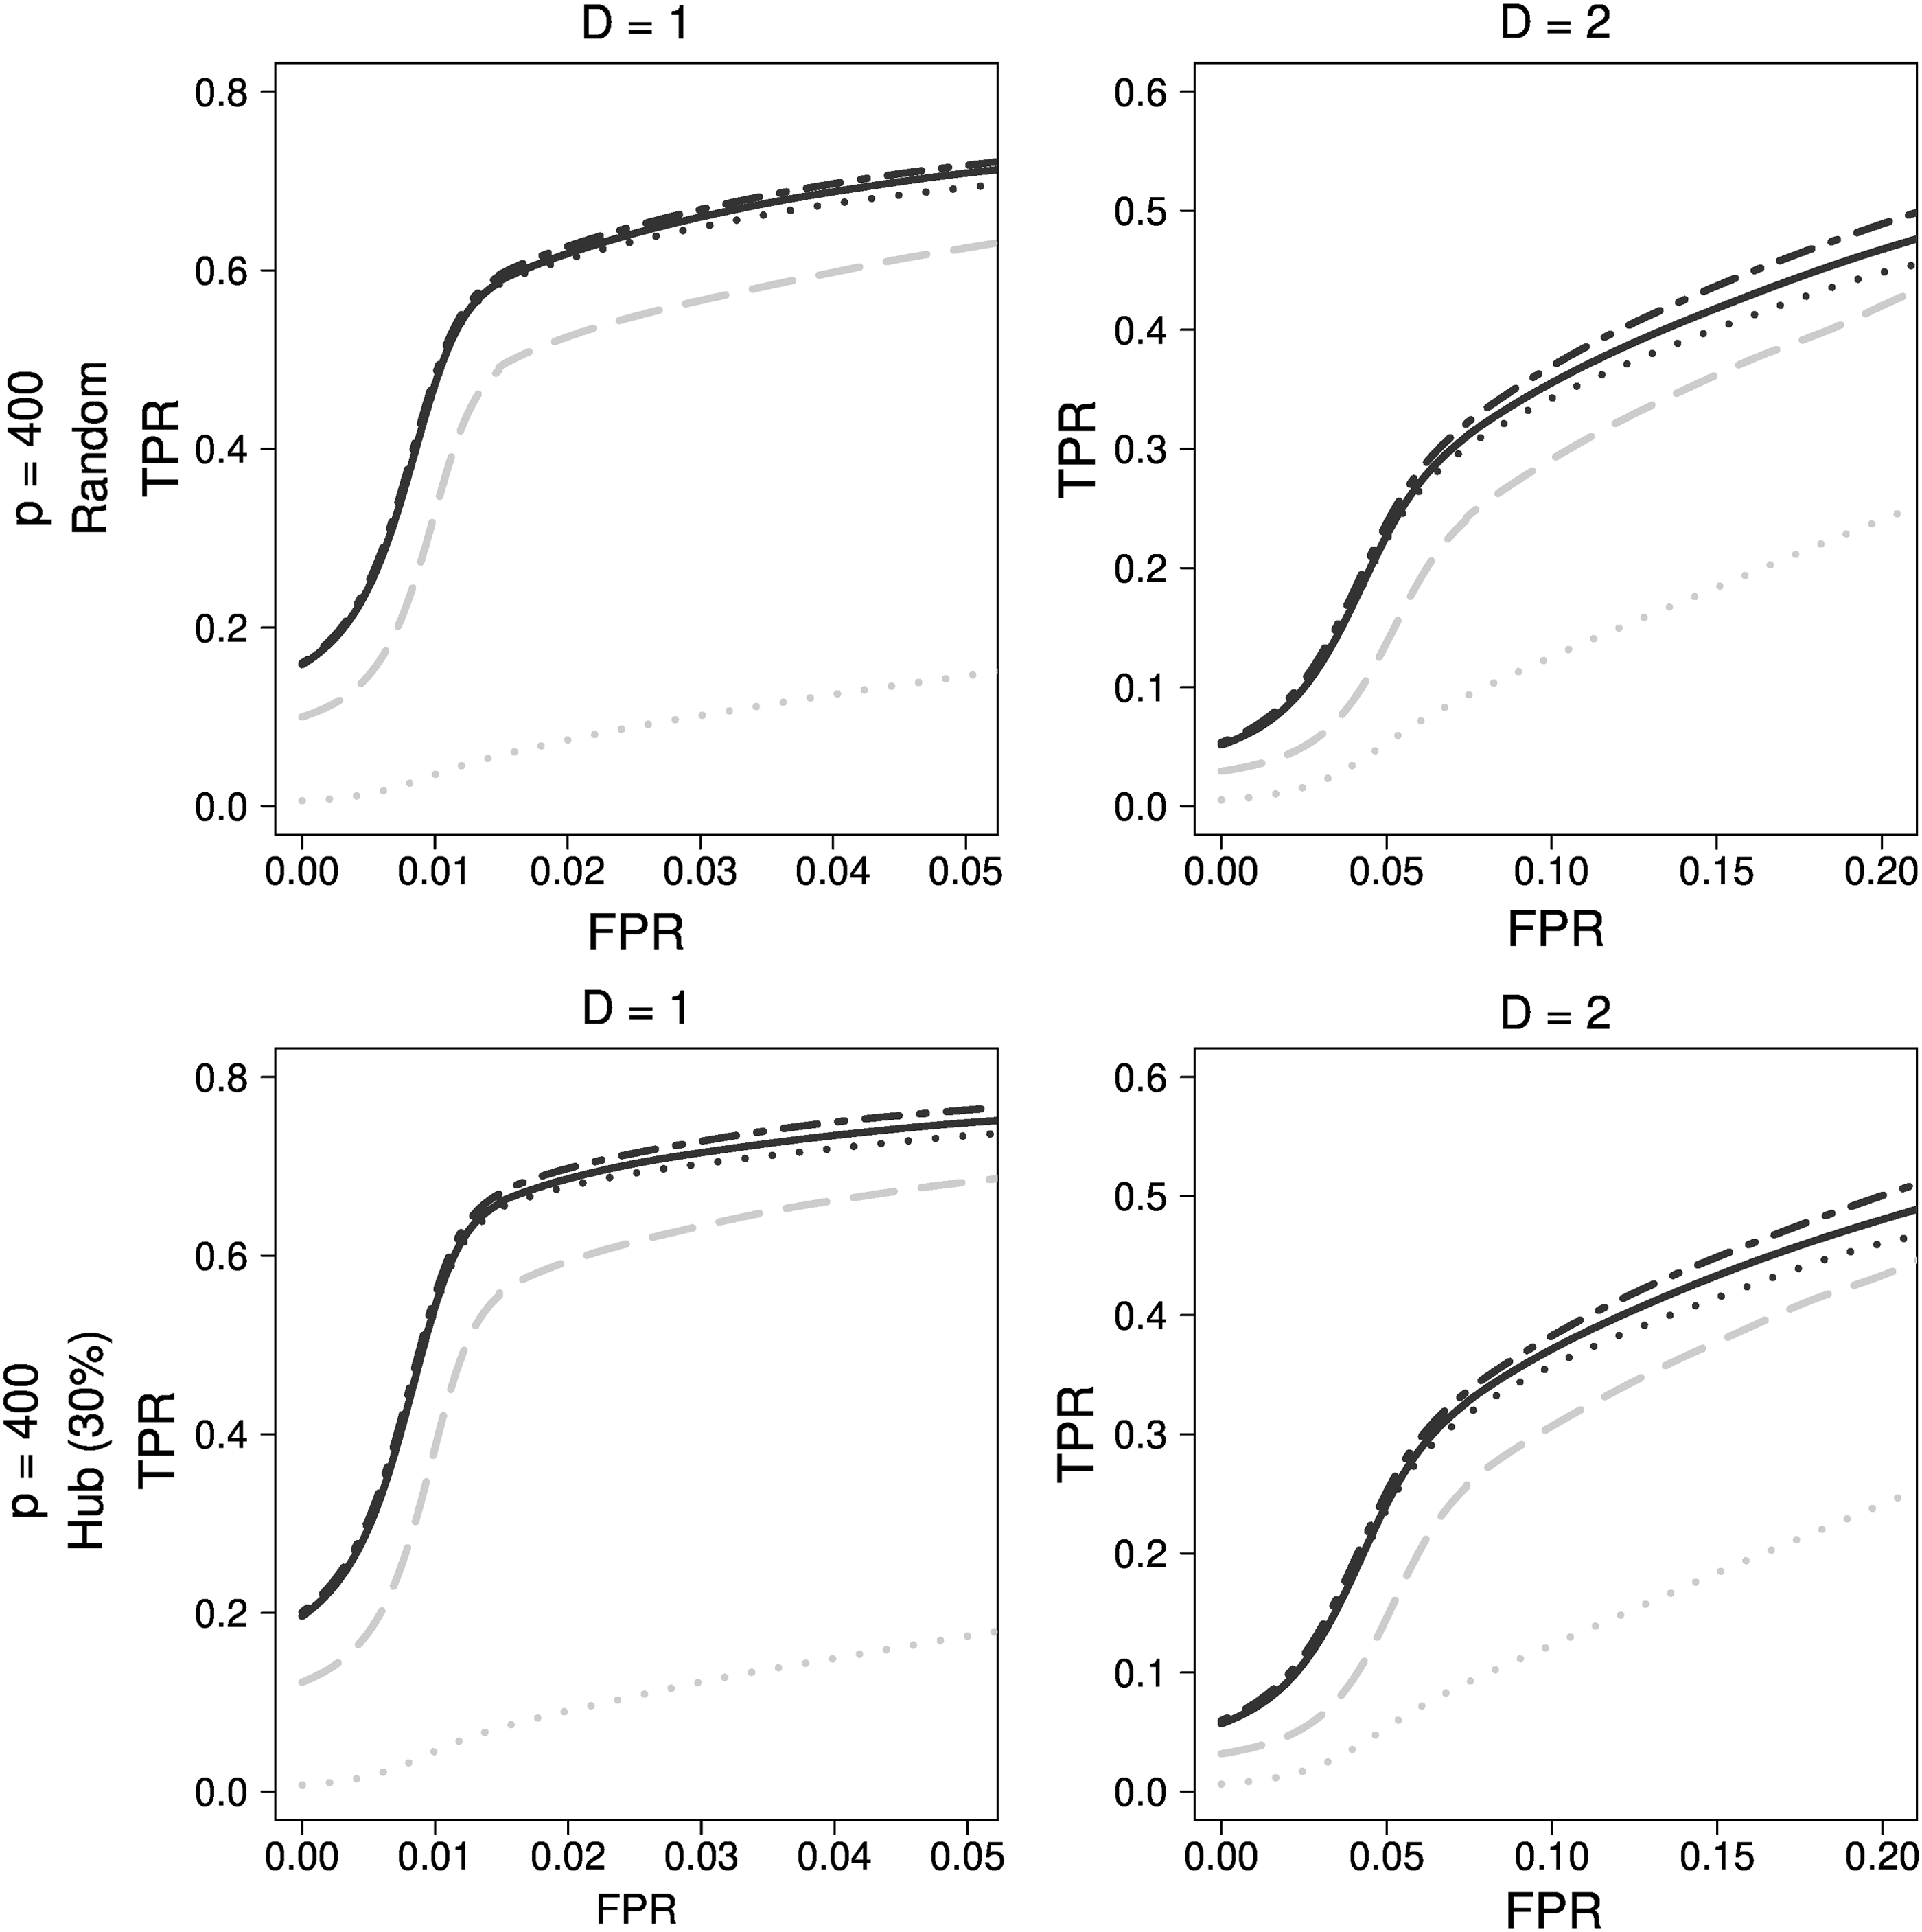
When using ADEnet,
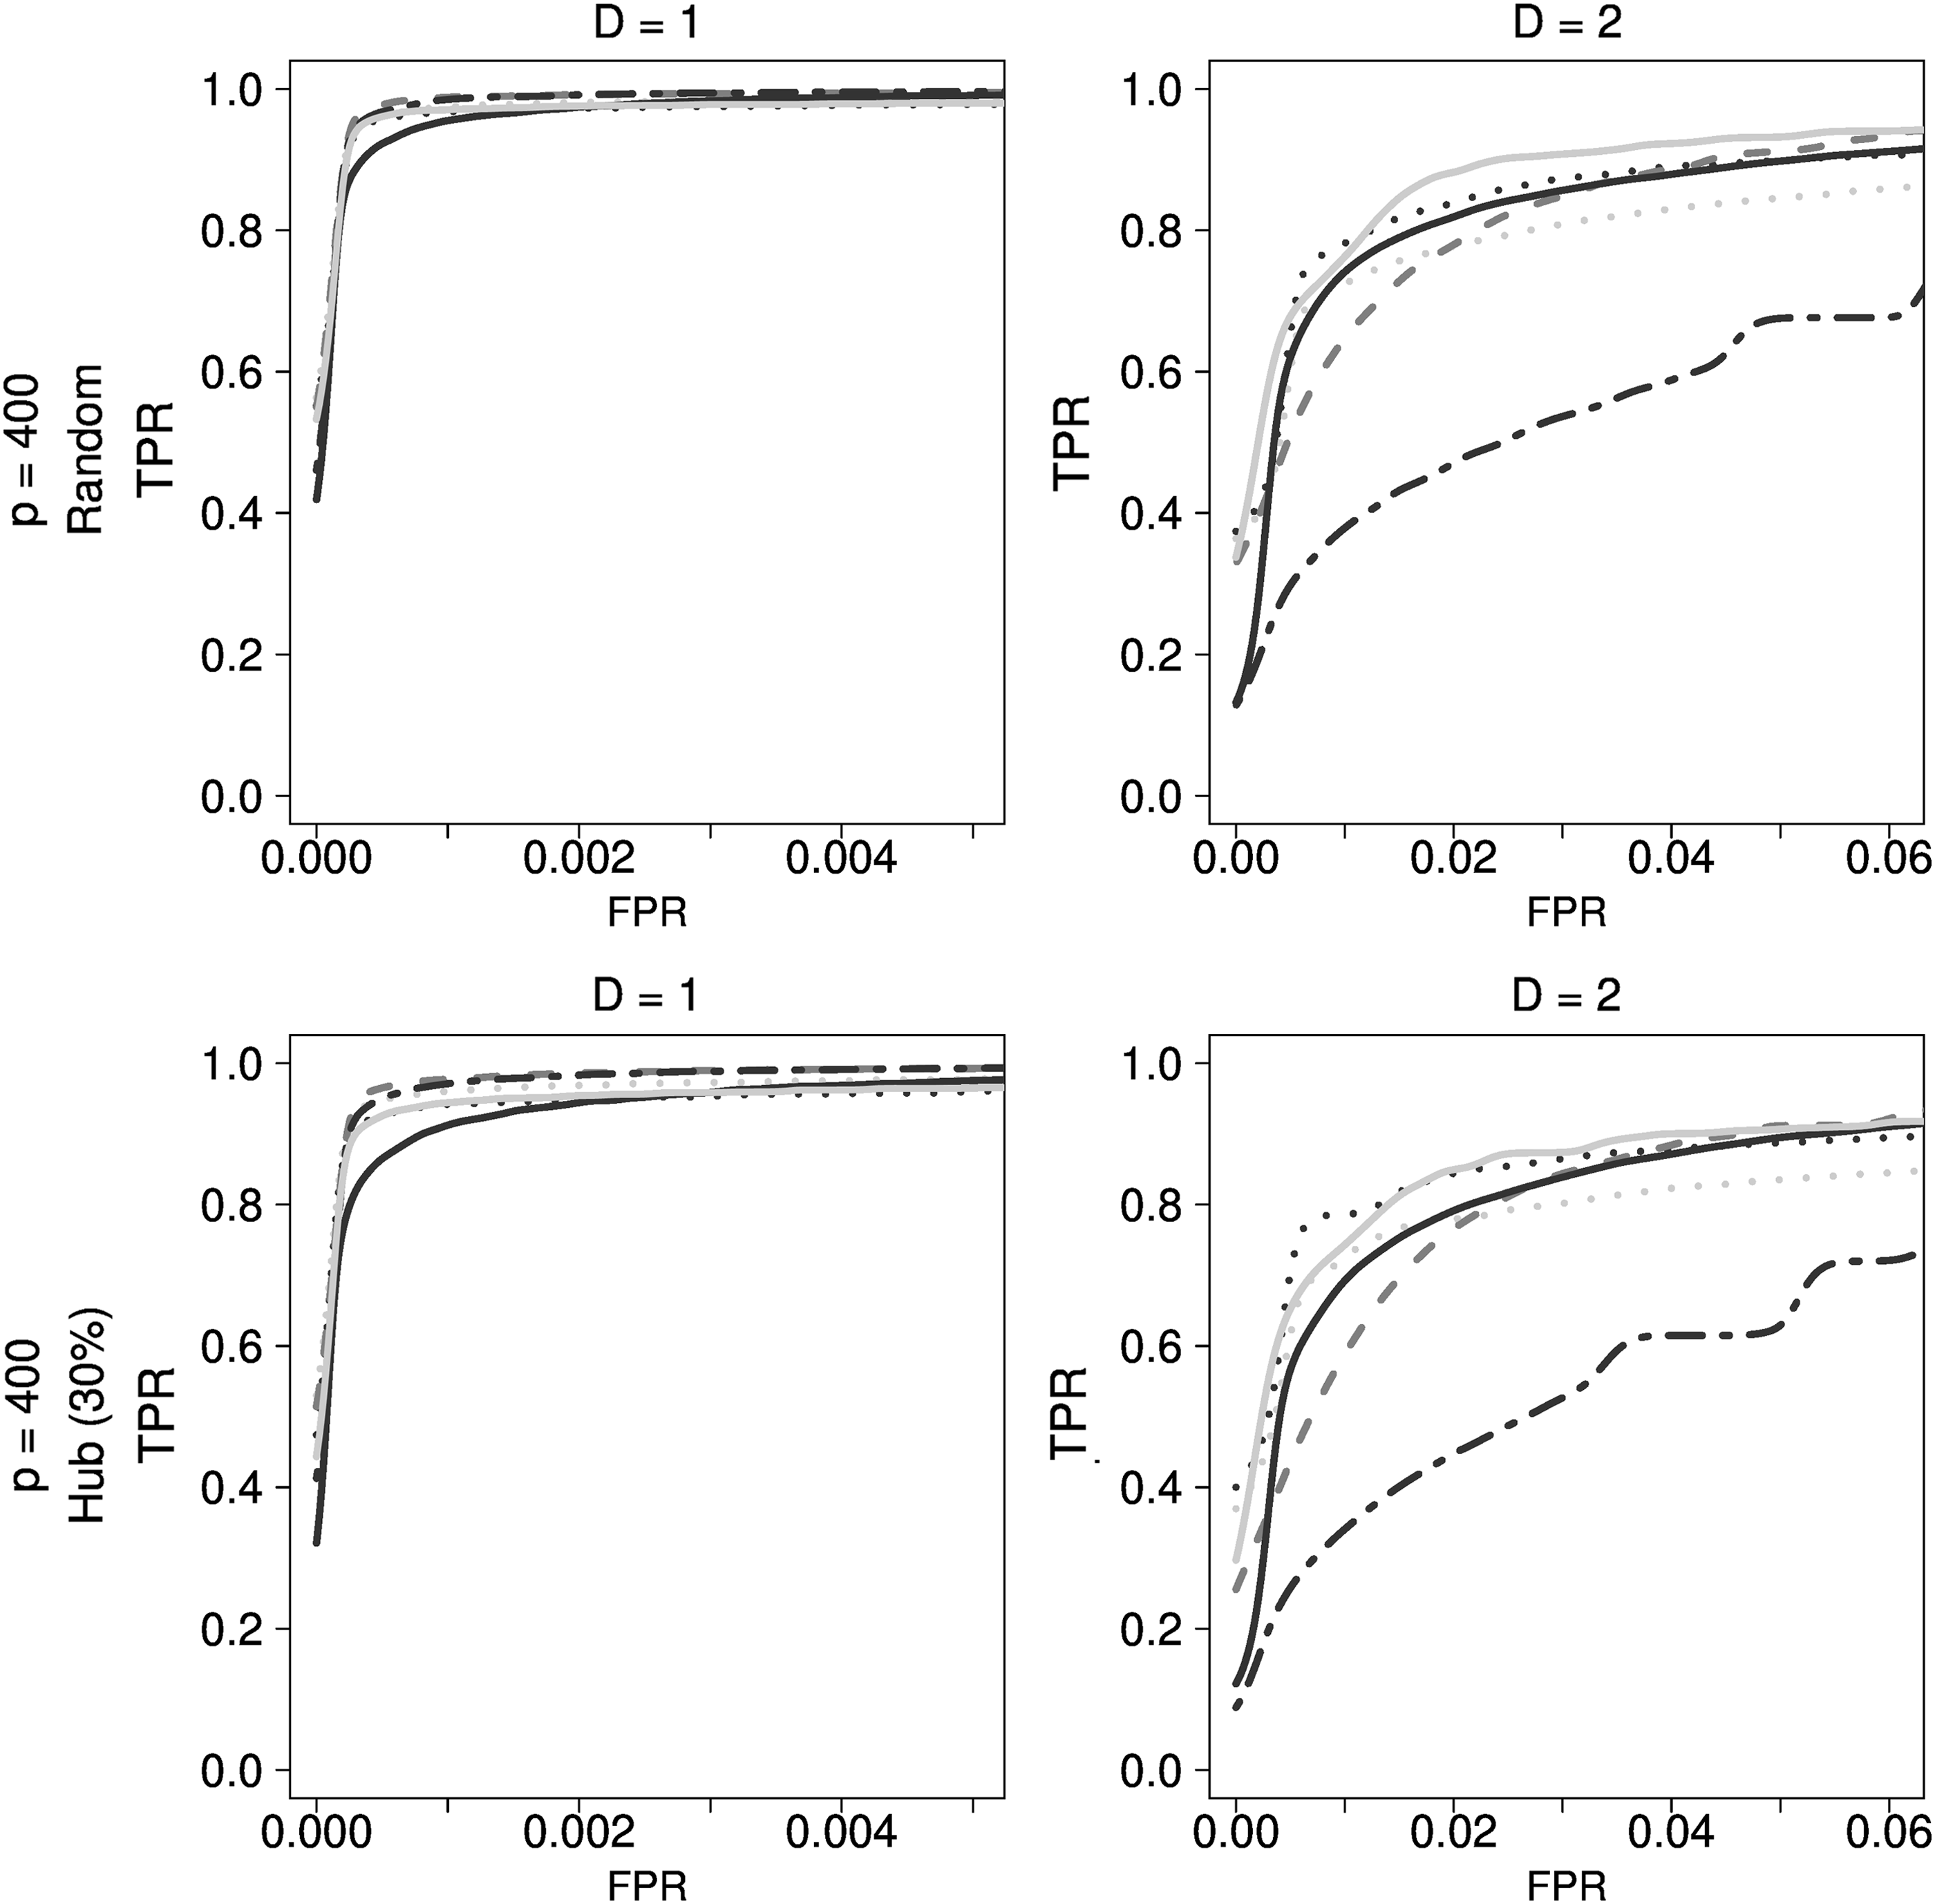
Comparison of regression-based approaches for genetic simulation data. Dark gray dashed lines indicate LASSO, black dotted lines indicate ADLASSO (λ_ini = 0.1), gray dotted lines indicate ADLASSO (λ_ini = 0.3), gray dotted dashed lines indicate Enet (α = 0.8), black solid lines indicate ADEnet λ_ini = 0.1; α = 0.2), and gray solid lines indicate ADEnet (λ_ini = 0.1; α = 0.8). ADEnet, adaptive elastic-net; ADLASSO, adaptive LASSO; FPR, false positive rate; Enet, elastic-net; TPR, true positive rate.
With the number of samples
As described in Figure 2, GENIE3 performed better than ARACNE, CLR, and MRNET, which use mutual information. When using GENIE3, the performance difference between the random forests (GENIE3_RF) and the extremely randomized trees (GENIE3_ET) was not significant (Breiman, 2001; Geurts et al., 2006; Irrthum et al., 2010). Among methods using mutual information, CLR demonstrated better performance than ARACNE and MRNET.
Comparison of methods used in bioinformatics for genetic simulation data. Dark gray dashed lines indicate ARACNE, black dotted lines indicate CLR, gray dotted dashed lines indicate MRNET, black long dashed lines indicate GENIE3_RF, and gray long dashed lines indicate GENIE3_ET. ARACNE, accurate cellular networks; CLR, context likelihood of relatedness; MRNET, multicast reduction network.
2.1.2. Comparison of final results for genetic simulation data
Among the bioinformatics techniques, GENIE3 with random forests (GENIE3_RF) and CLR using mutual information were chosen. Among regression-based approaches, LASSO, ADLASSO (
Comparison of final results for genetic simulation data. Dark gray dashed lines indicate LASSO, black dotted lines indicate ADLASSO (λ_ini = 0.1), black solid lines indicate ADEnet (λ_ini = 0.1; α = 0.8), gray dotted lines indicate CLR, and gray long dashed lines indicate GENIE3_RF.
Although LASSO showed the best performance at low density, it also suffered from a drawback in that the higher the density, the greater was its performance degradation. Bioinformatics methods showed relatively poor performance, whereas ADEnet was observed to be the best method of estimation to be used with genetic simulation data regardless of the density.
2.2. Comparison of results for Peng's simulation data
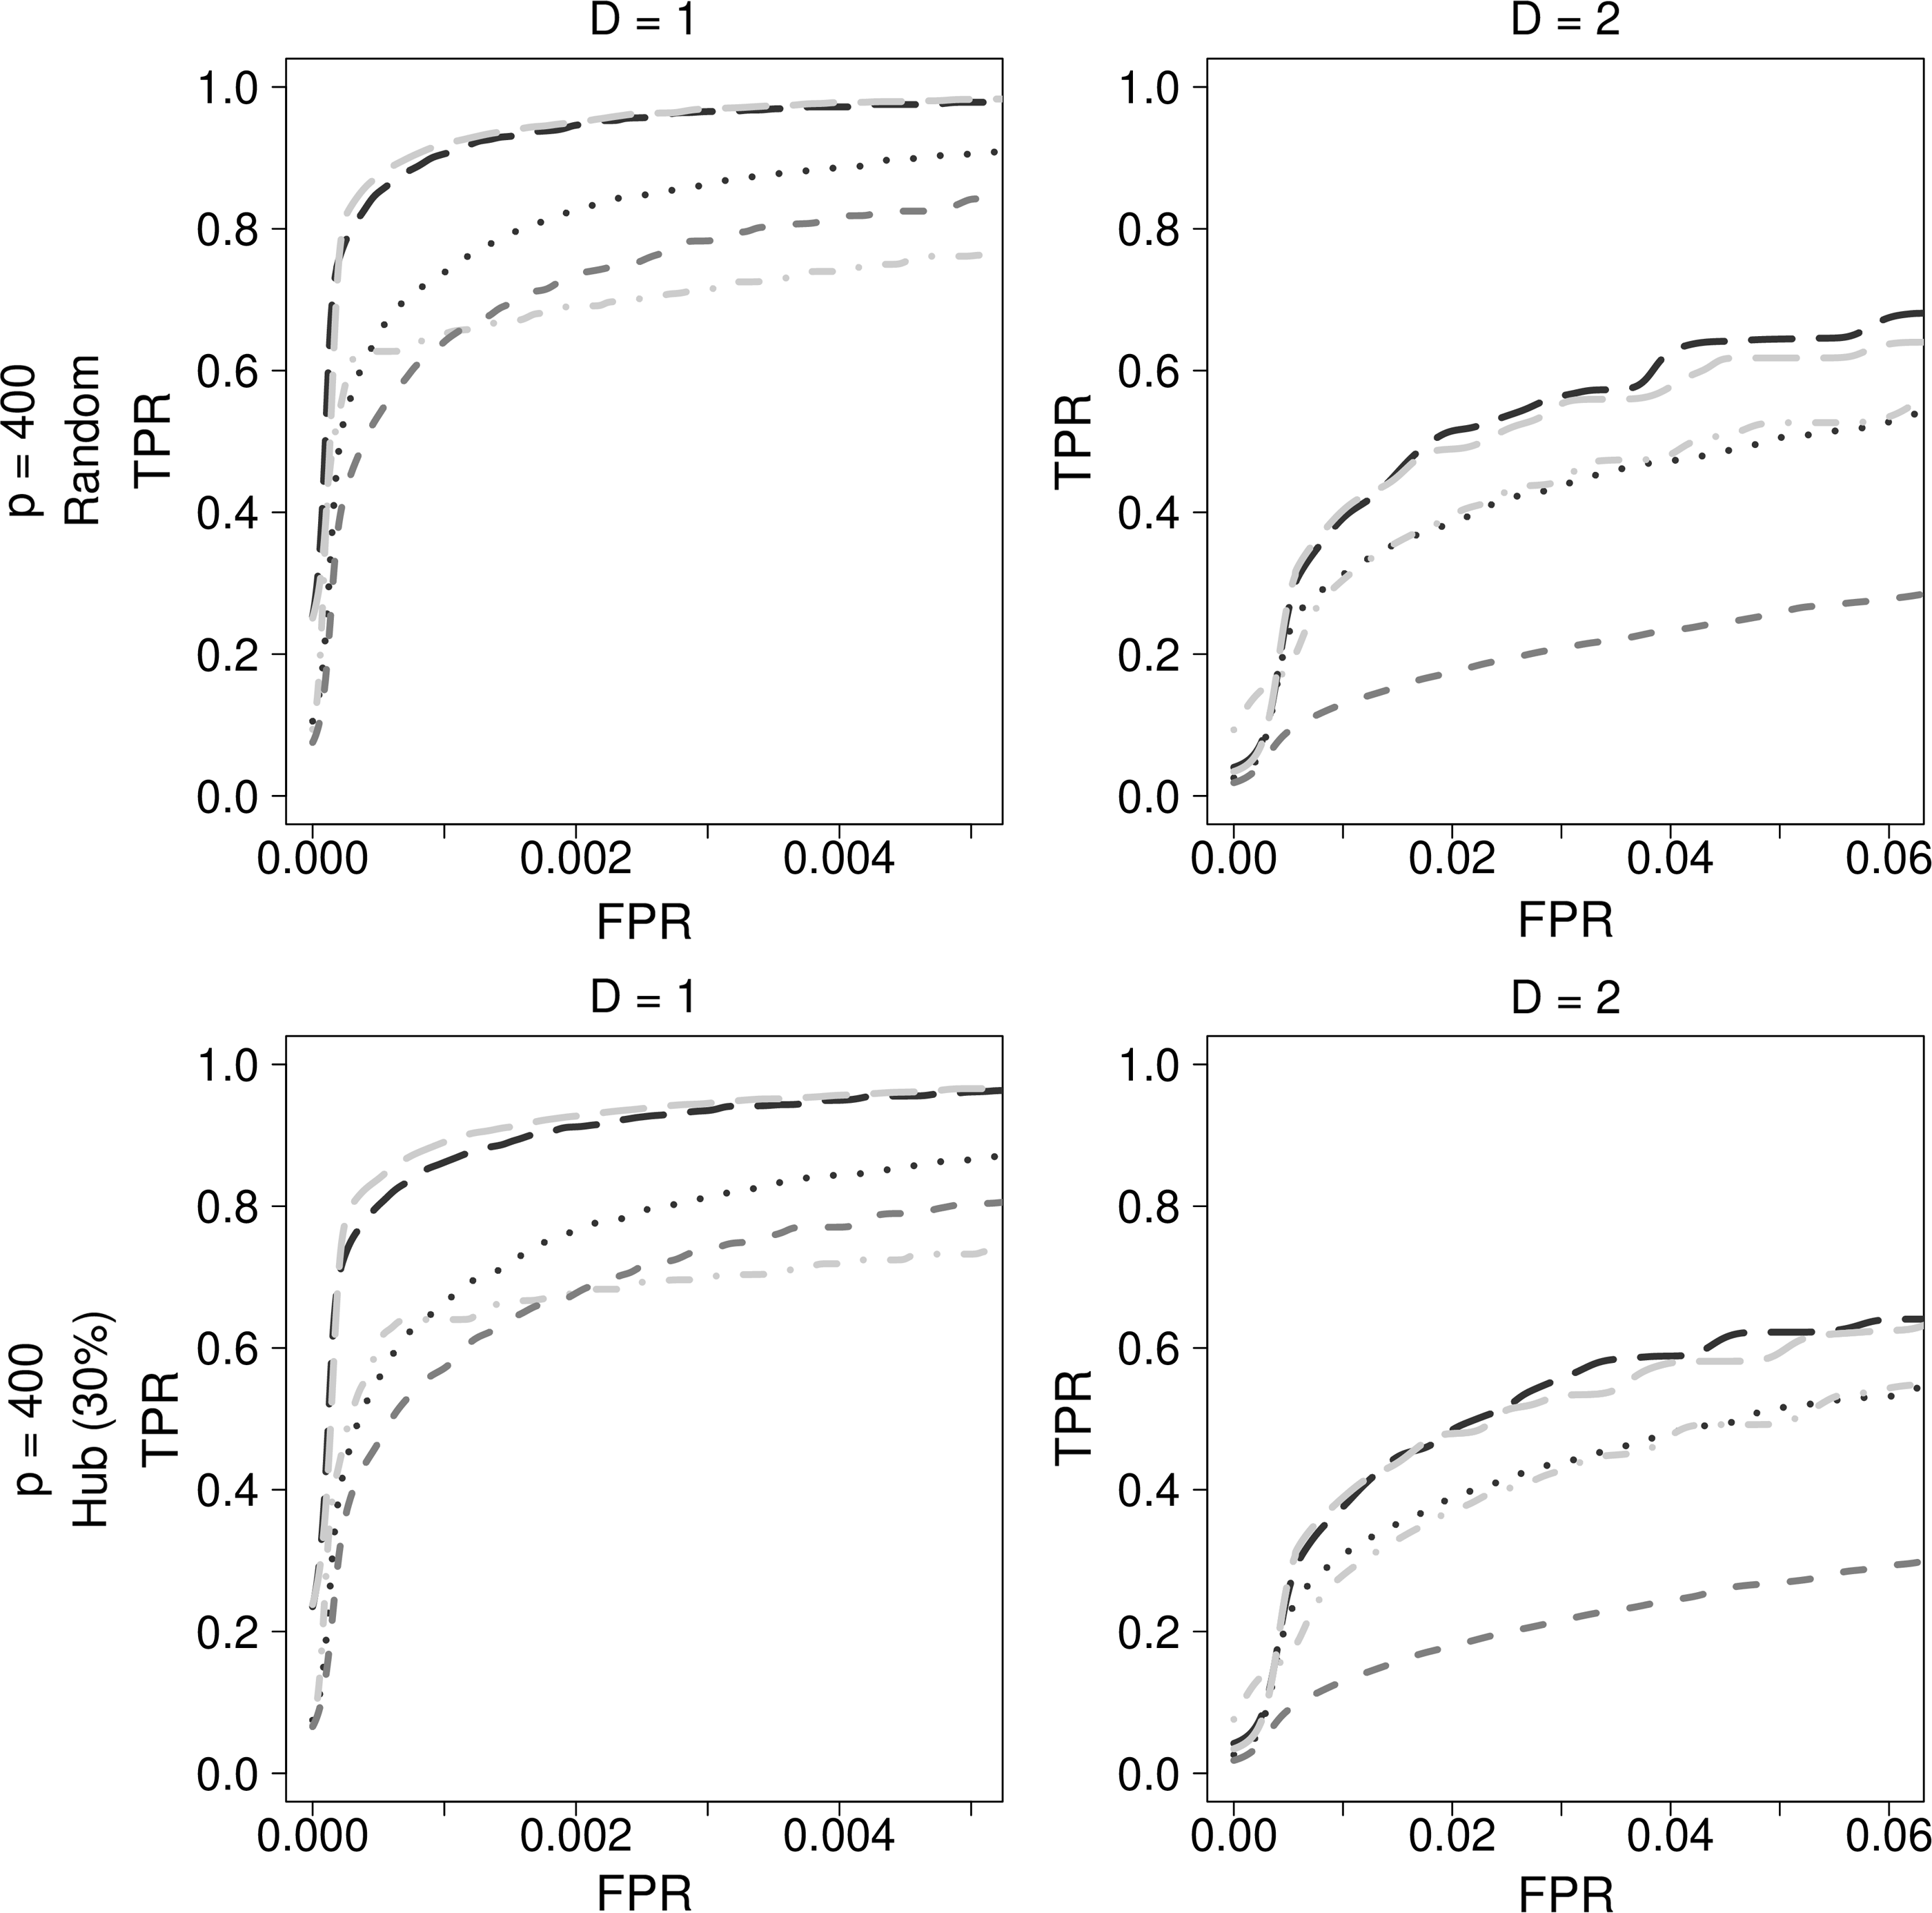
2.2.1. Results for each approach
Enet becomes similar to LASSO when
Comparison of regression-based approaches for Peng's simulation data. Dark gray dashed lines indicate LASSO, black dotted lines indicate ADLASSO (λ_ini = 0.1), gray dotted lines indicate ADLASSO (λ_ini = 0.3), gray dotted dashed lines indicate Enet (α = 0.2), black solid lines indicate ADEnet (λ_ini = 0.1; α = 0.2), and gray solid lines indicate ADEnet (λ_ini = 0.1; α = 0.8).
Enet was the best of the regression-based method at both low density (D = 1) and high density (D = 2). ADLASSO performed the worst among the regression-based methods, although the difference in performance was very small.
As shown in Figure 5, methods using mutual information failed to perform appropriate network estimation using Peng's simulation data. GENIE3 was observed to be the only bioinformatics methods that proved suitable showing slightly better performance.

Comparison of methods used in bioinformatics for Peng's simulation data. Dark gray dashed lines indicate ARACNE, black dotted lines indicate CLR, gray dotted dashed lines indicate MRNET, black long dashed lines indicate GENIE3_RF, and gray long dashed lines indicate GENIE3_ET.
2.2.2. Comparison of final results for Peng's simulation data
As depicted in Figure 6, GENIE3 with extra trees and CLR using mutual information was chosen. Among regression-based approaches, Enet (
Comparison of final results for Peng's simulation data. Black dotted dashed lines indicate Enet (α = 0.2), black dotted lines indicate ADLASSO (λ_ini = 0.1), black solid lines indicate ADEnet (λ_ini = 0.1; α = 0.2), gray dotted lines indicate CLR, and gray long dashed lines indicate GENIE3_ET.
Network estimation from Peng's simulation data was found to be more difficult than genetic simulation data. In particular, the methods using mutual information were rather inadequate. The regression-based approach was superior to GENIE3—the best bioinformatics method, and Enet was the best.
2.3. Comparison of results for other simulation data
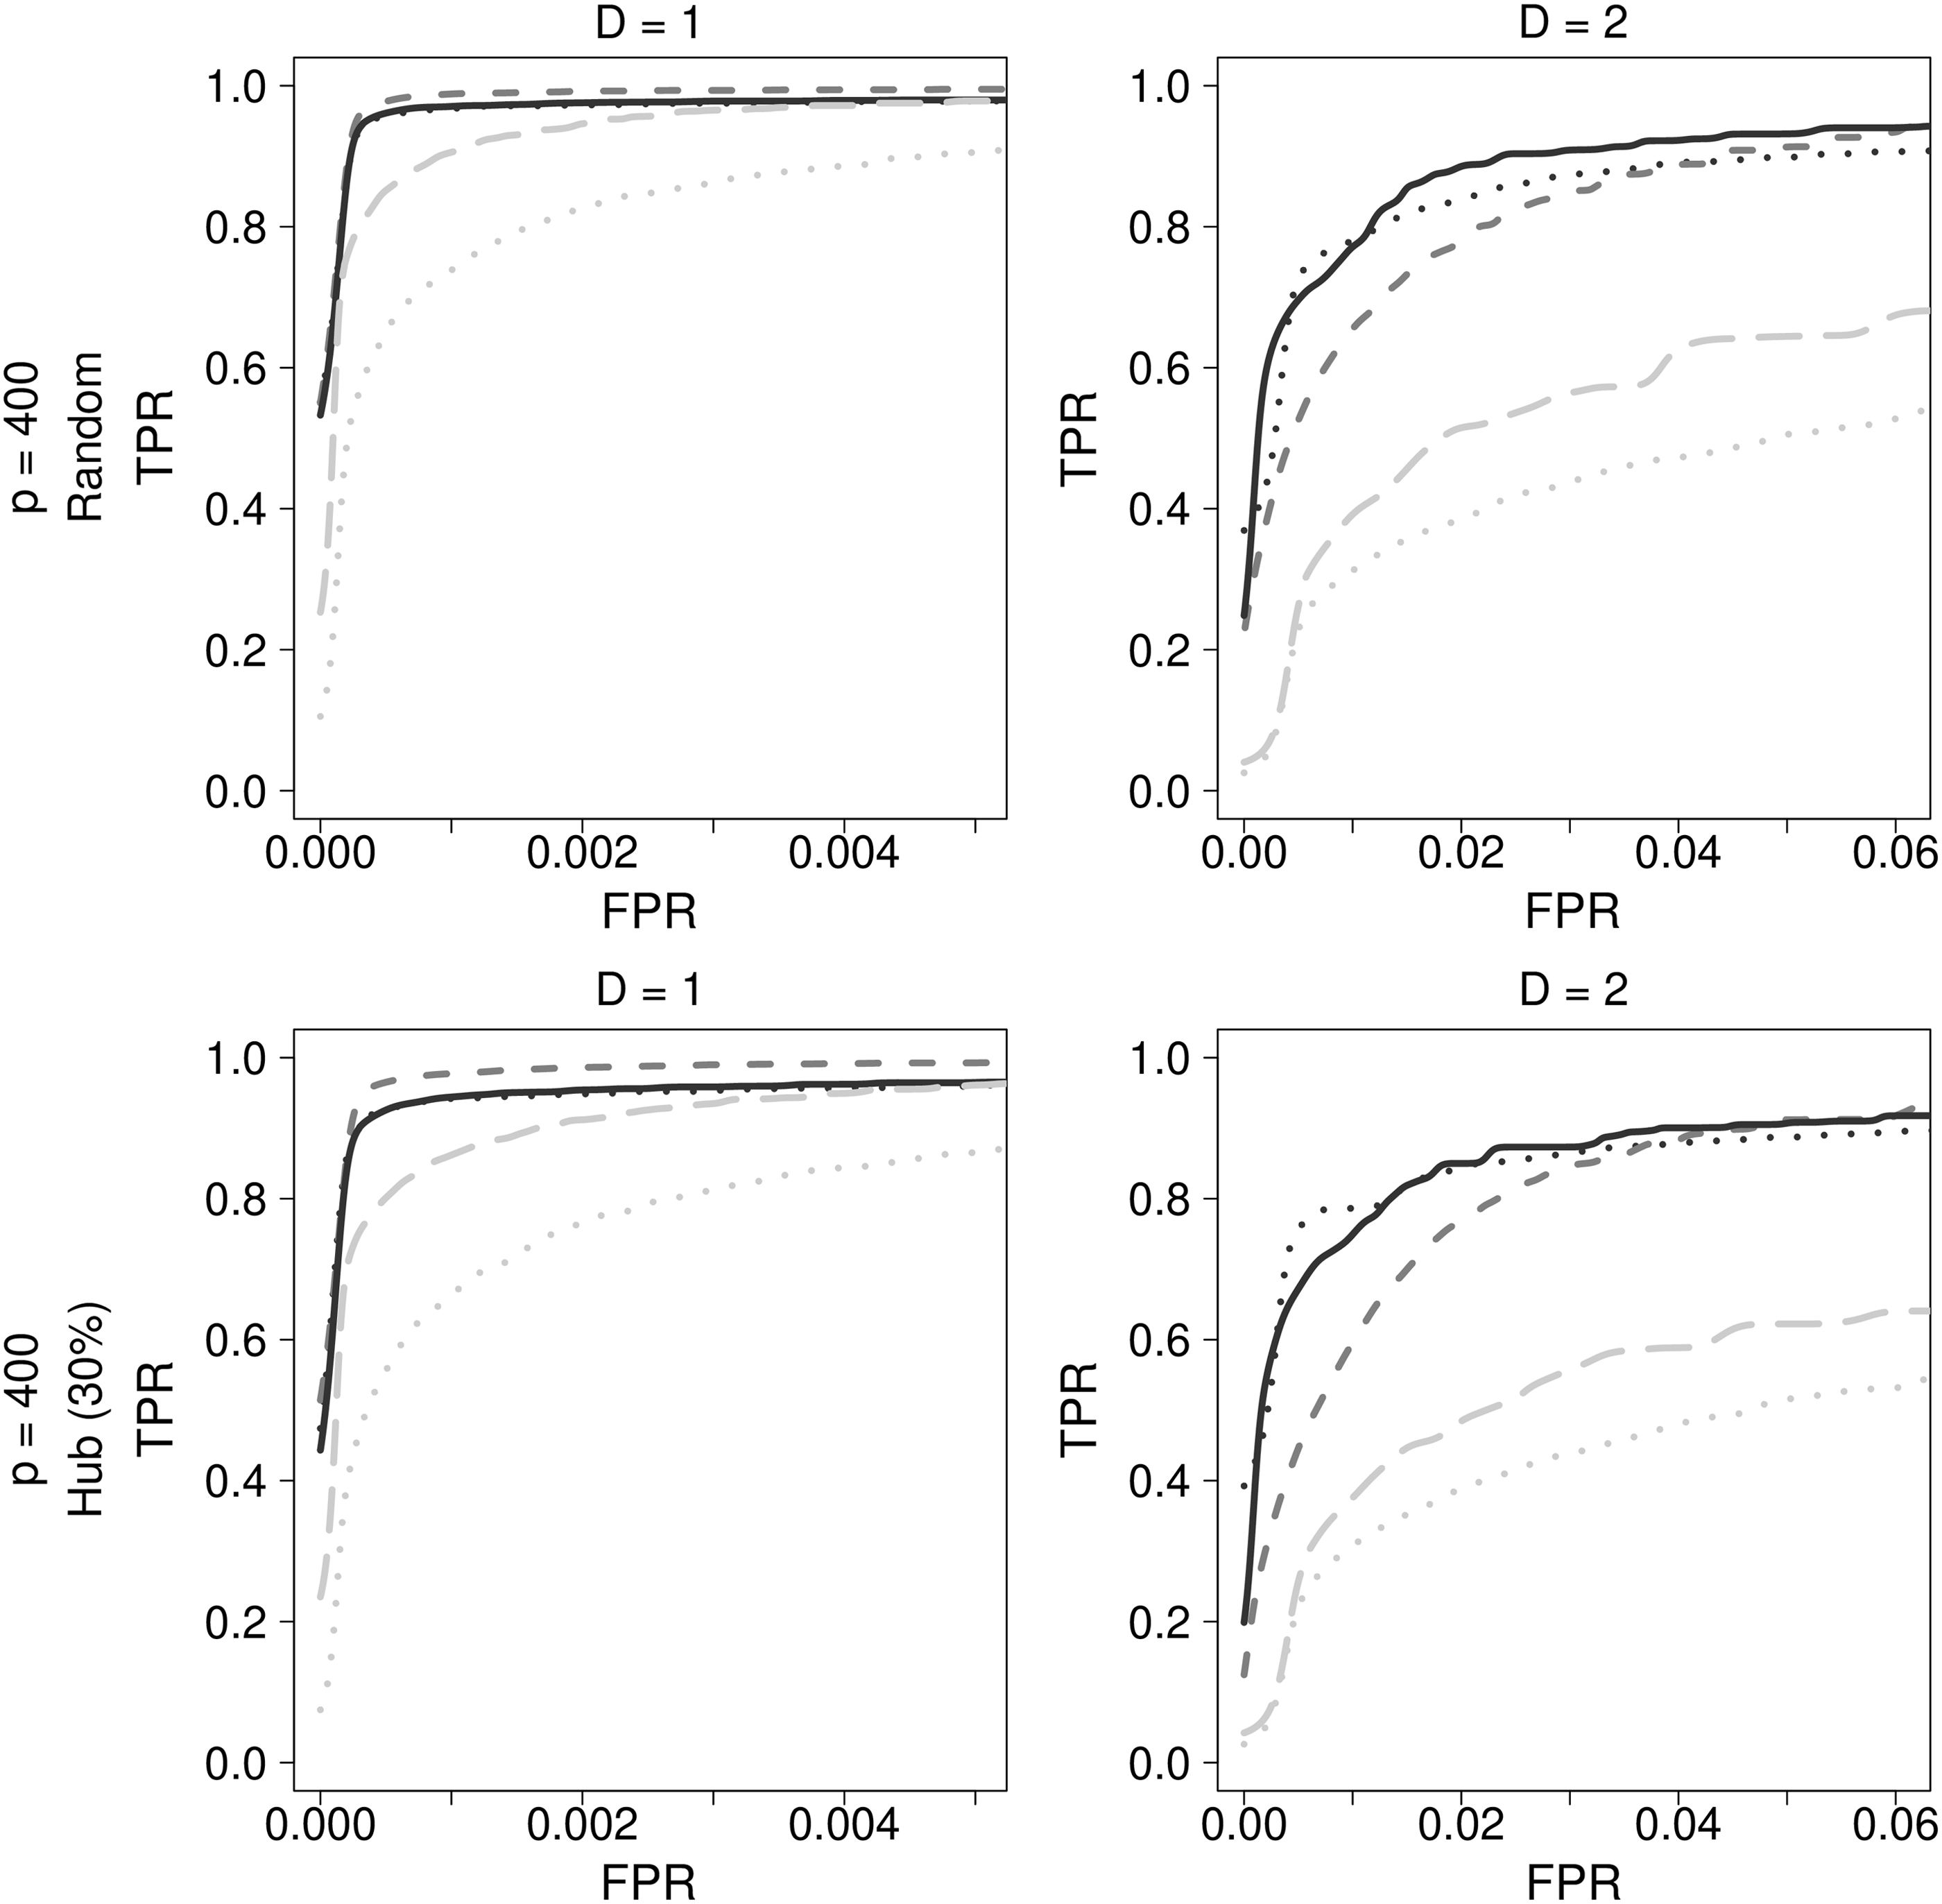
2.3.1. Results for each approach
When changing the initial lambda value of ADEnet to
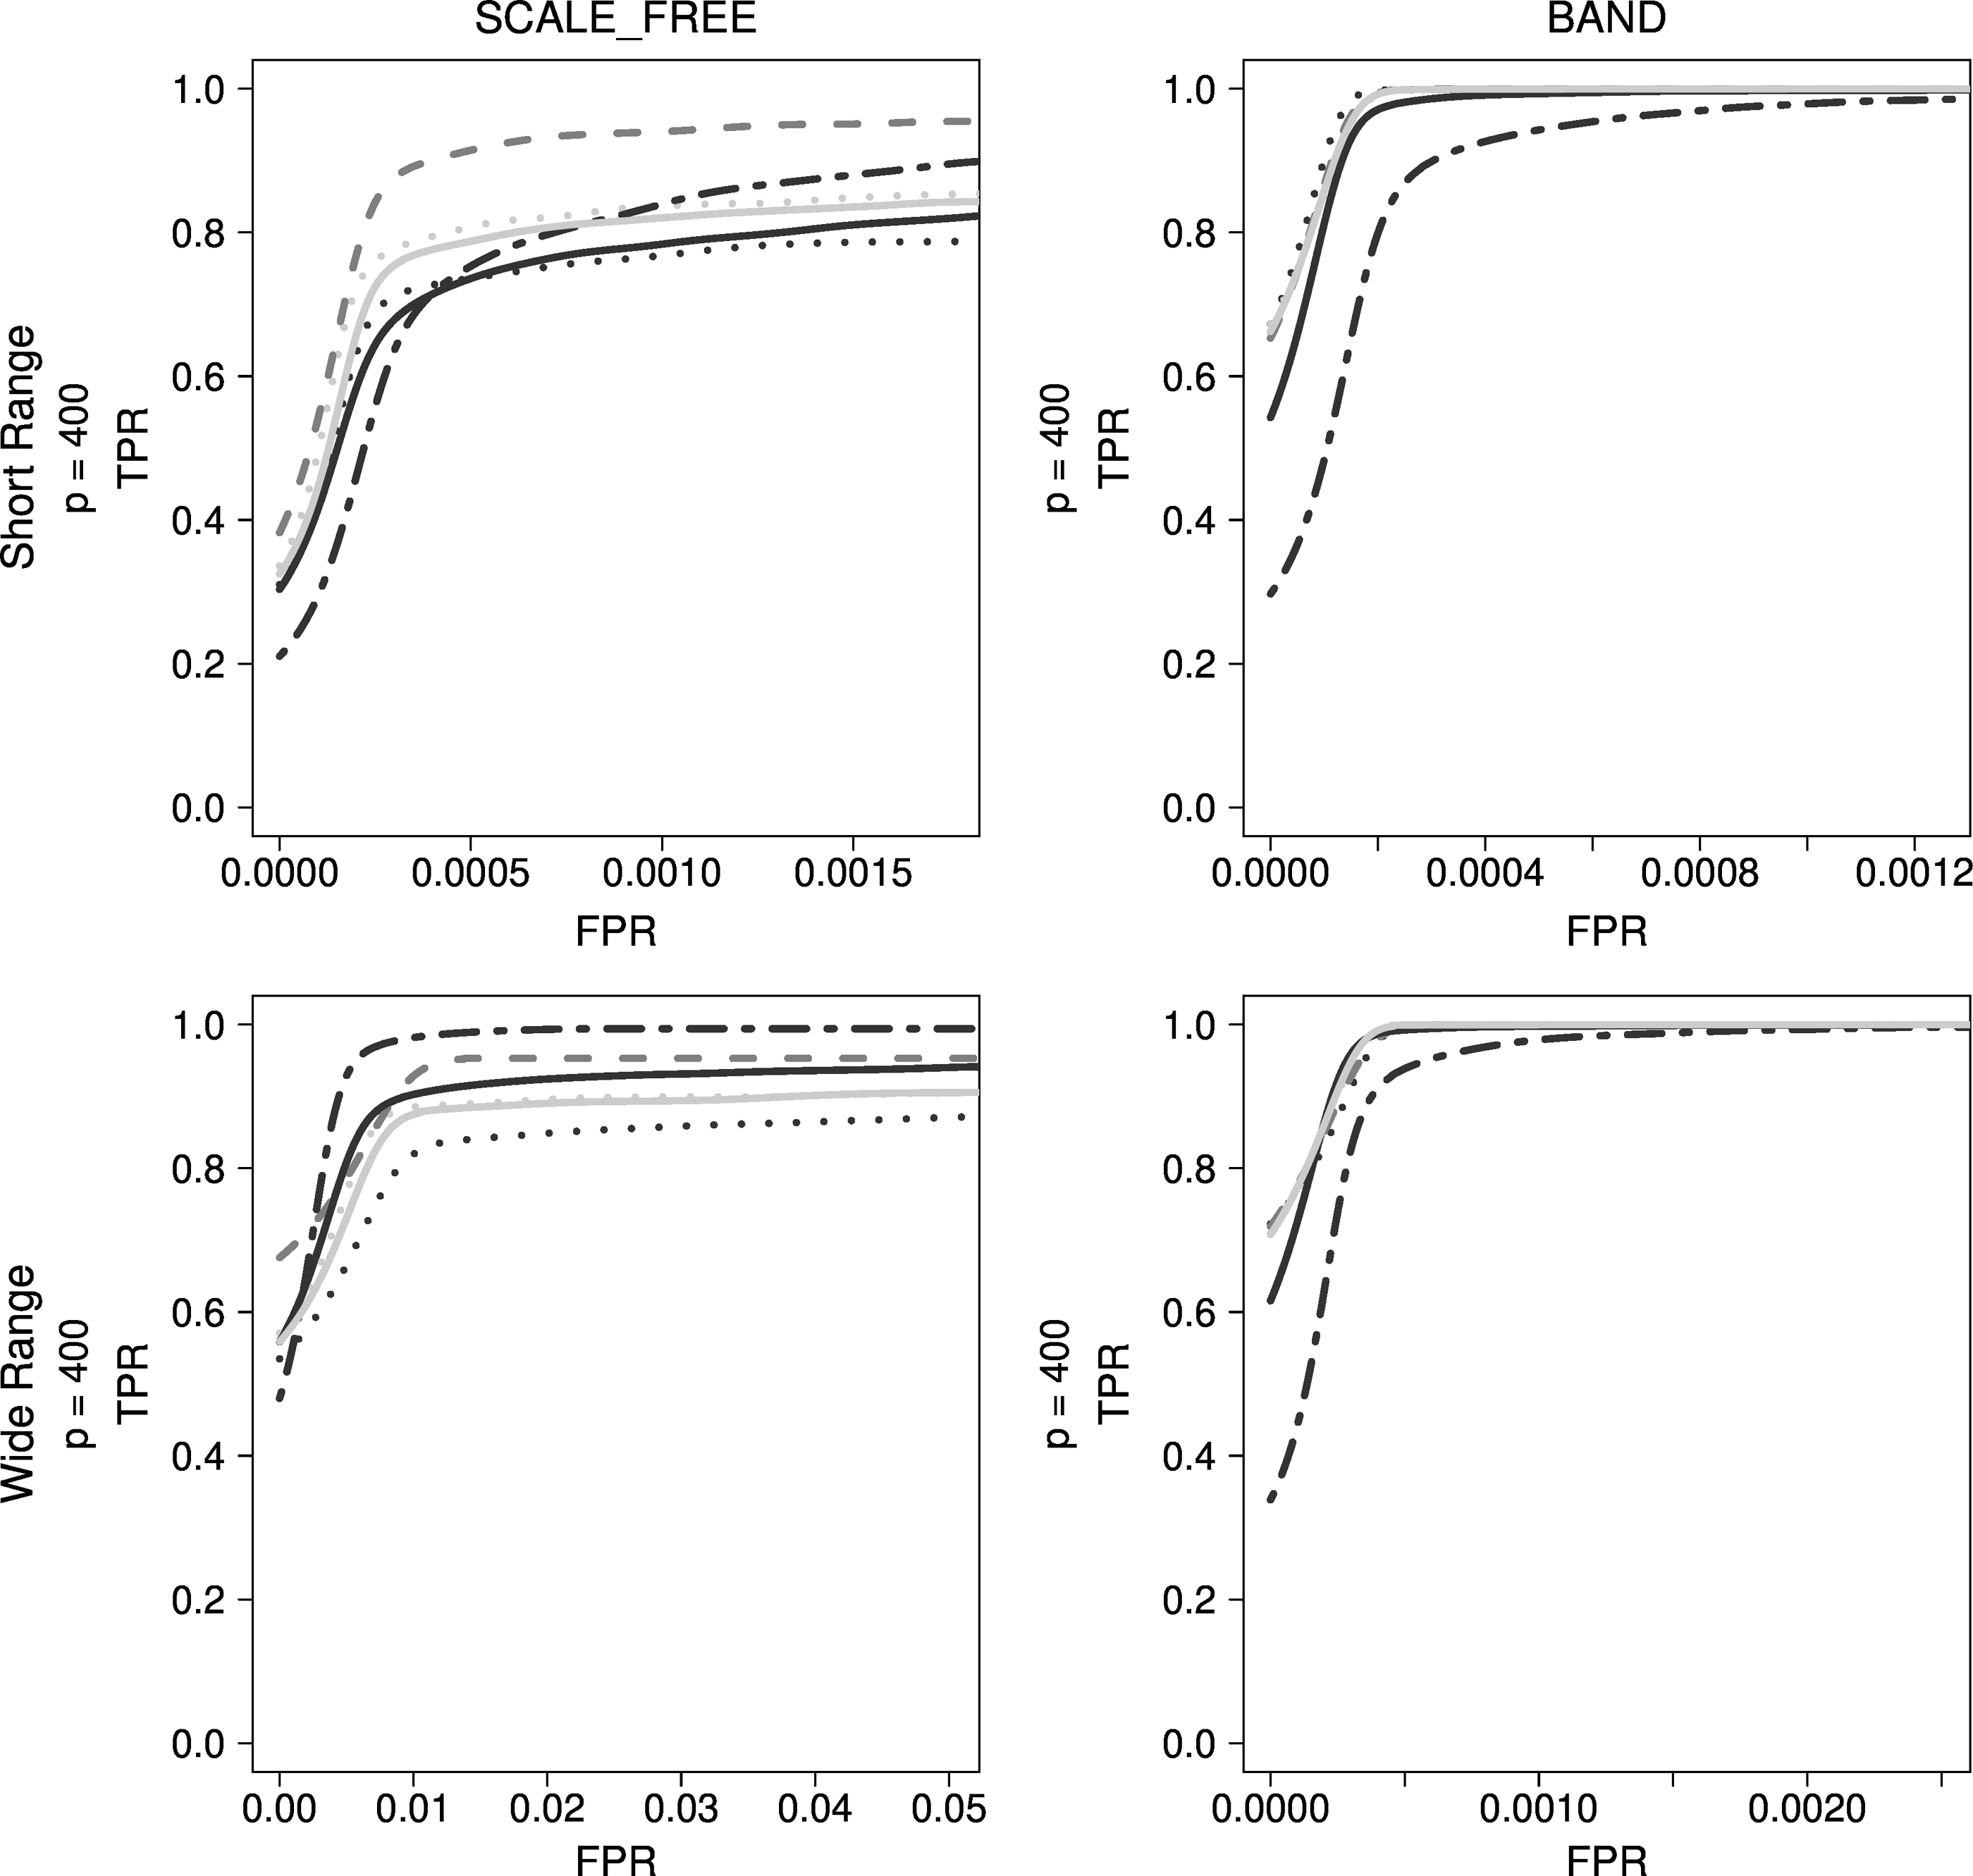
Comparison of regression-based approaches for other typical simulation data. Dark gray dashed lines indicate LASSO, black dotted lines indicate ADLASSO (λ_ini = 0.1), gray dotted lines indicate ADLASSO (λ_ini = 0.3), gray dotted dashed lines indicate Enet (α = 0.2), black solid lines indicate ADEnet (λ_ini = 0.3; α = 0.2), and gray solid lines indicate ADEnet (λ_ini = 0.3; α = 0.8).
With scale-free simulation data, Enet converged to a higher TPR than other regression-based methods, but ADLASSO and ADEnet showed poor performance. Although Enet obtained lower accuracy than LASSO over a short FPR range, it demonstrated superior performance when FPR was >0.2%. Besides, Enet had a 100% TPR, which was not achieved by other regression-based methods. However, the performance of Enet dropped significantly when using band-type simulation data, whereas ADLASSO, ADEnet, and LASSO demonstrated network estimation performances corresponding to 100% TPR.
Although CLR performed the best among methods using mutual information, GENIE3 performed much better. With both band-type and scale-free simulation data, GENIE3 with extra trees was observed to be superior, as can be seen in Figure 8.
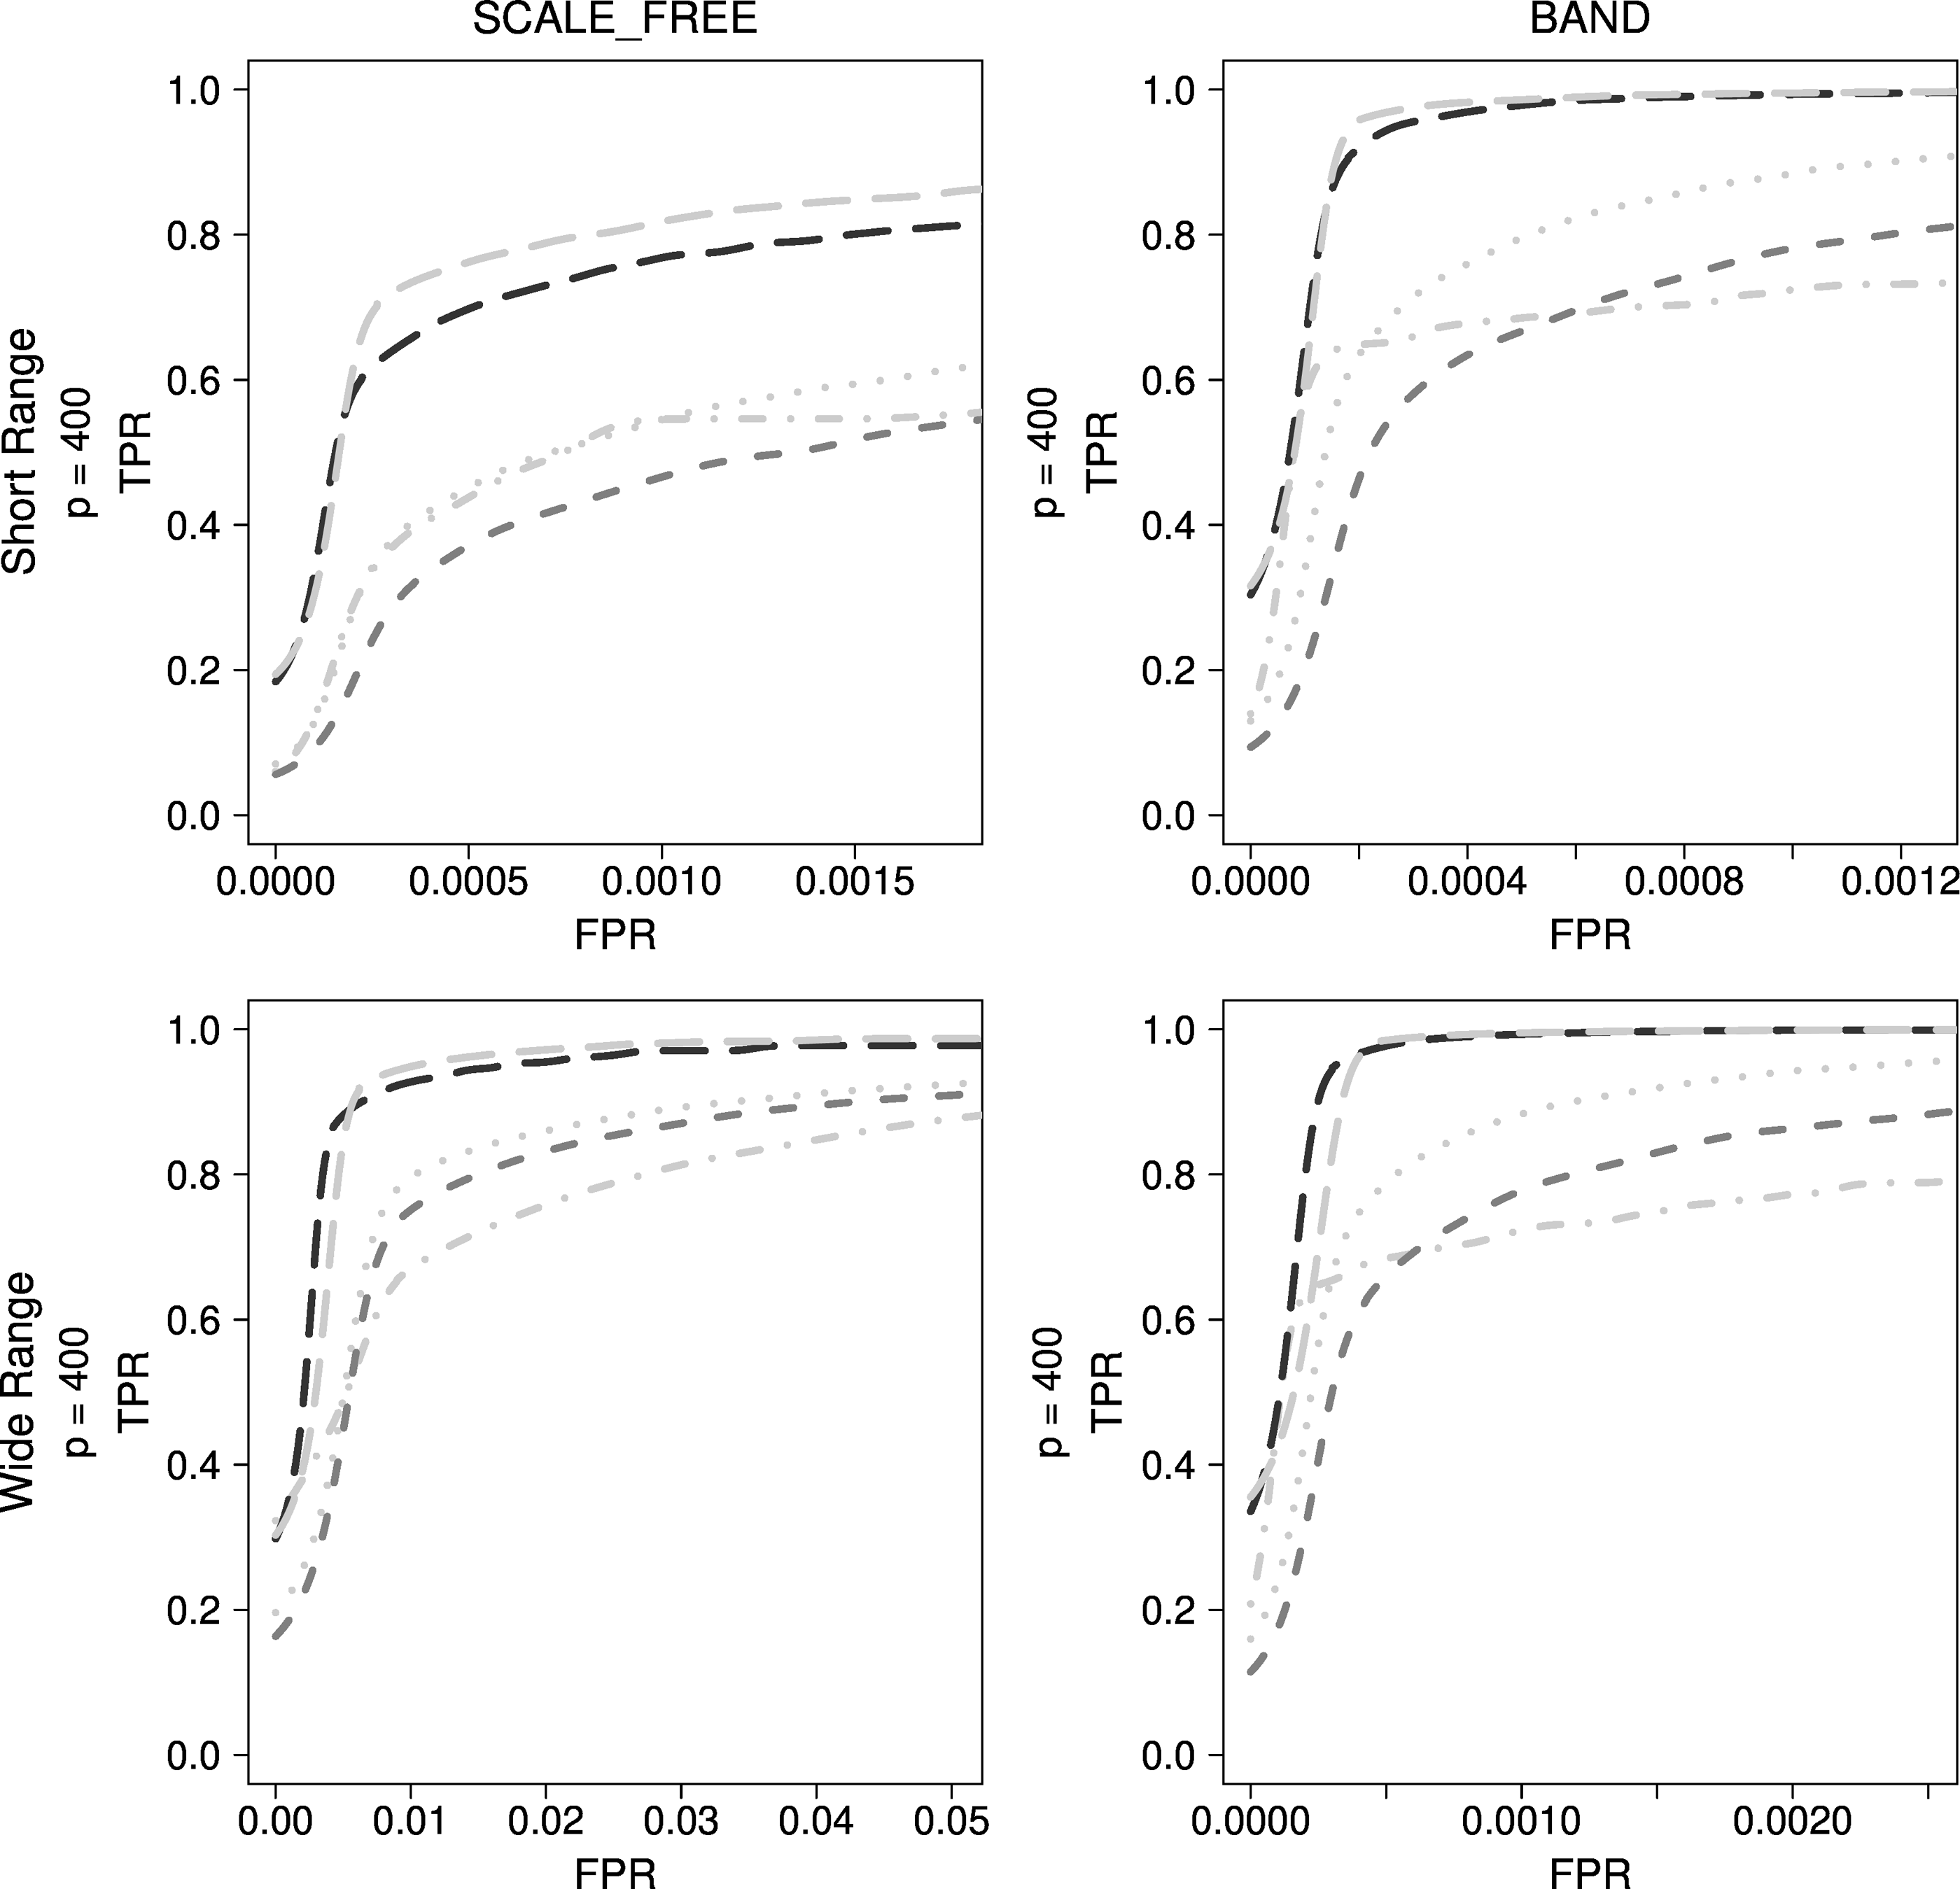
Comparison of methods used in bioinformatics for other typical simulation data. Dark gray dashed lines indicate ARACNE, gray dotted lines indicate CLR, gray dotted dashed lines indicate MRNET, black long dashed lines indicate GENIE3_RF, and gray long dashed lines indicate GENIE3_ET.
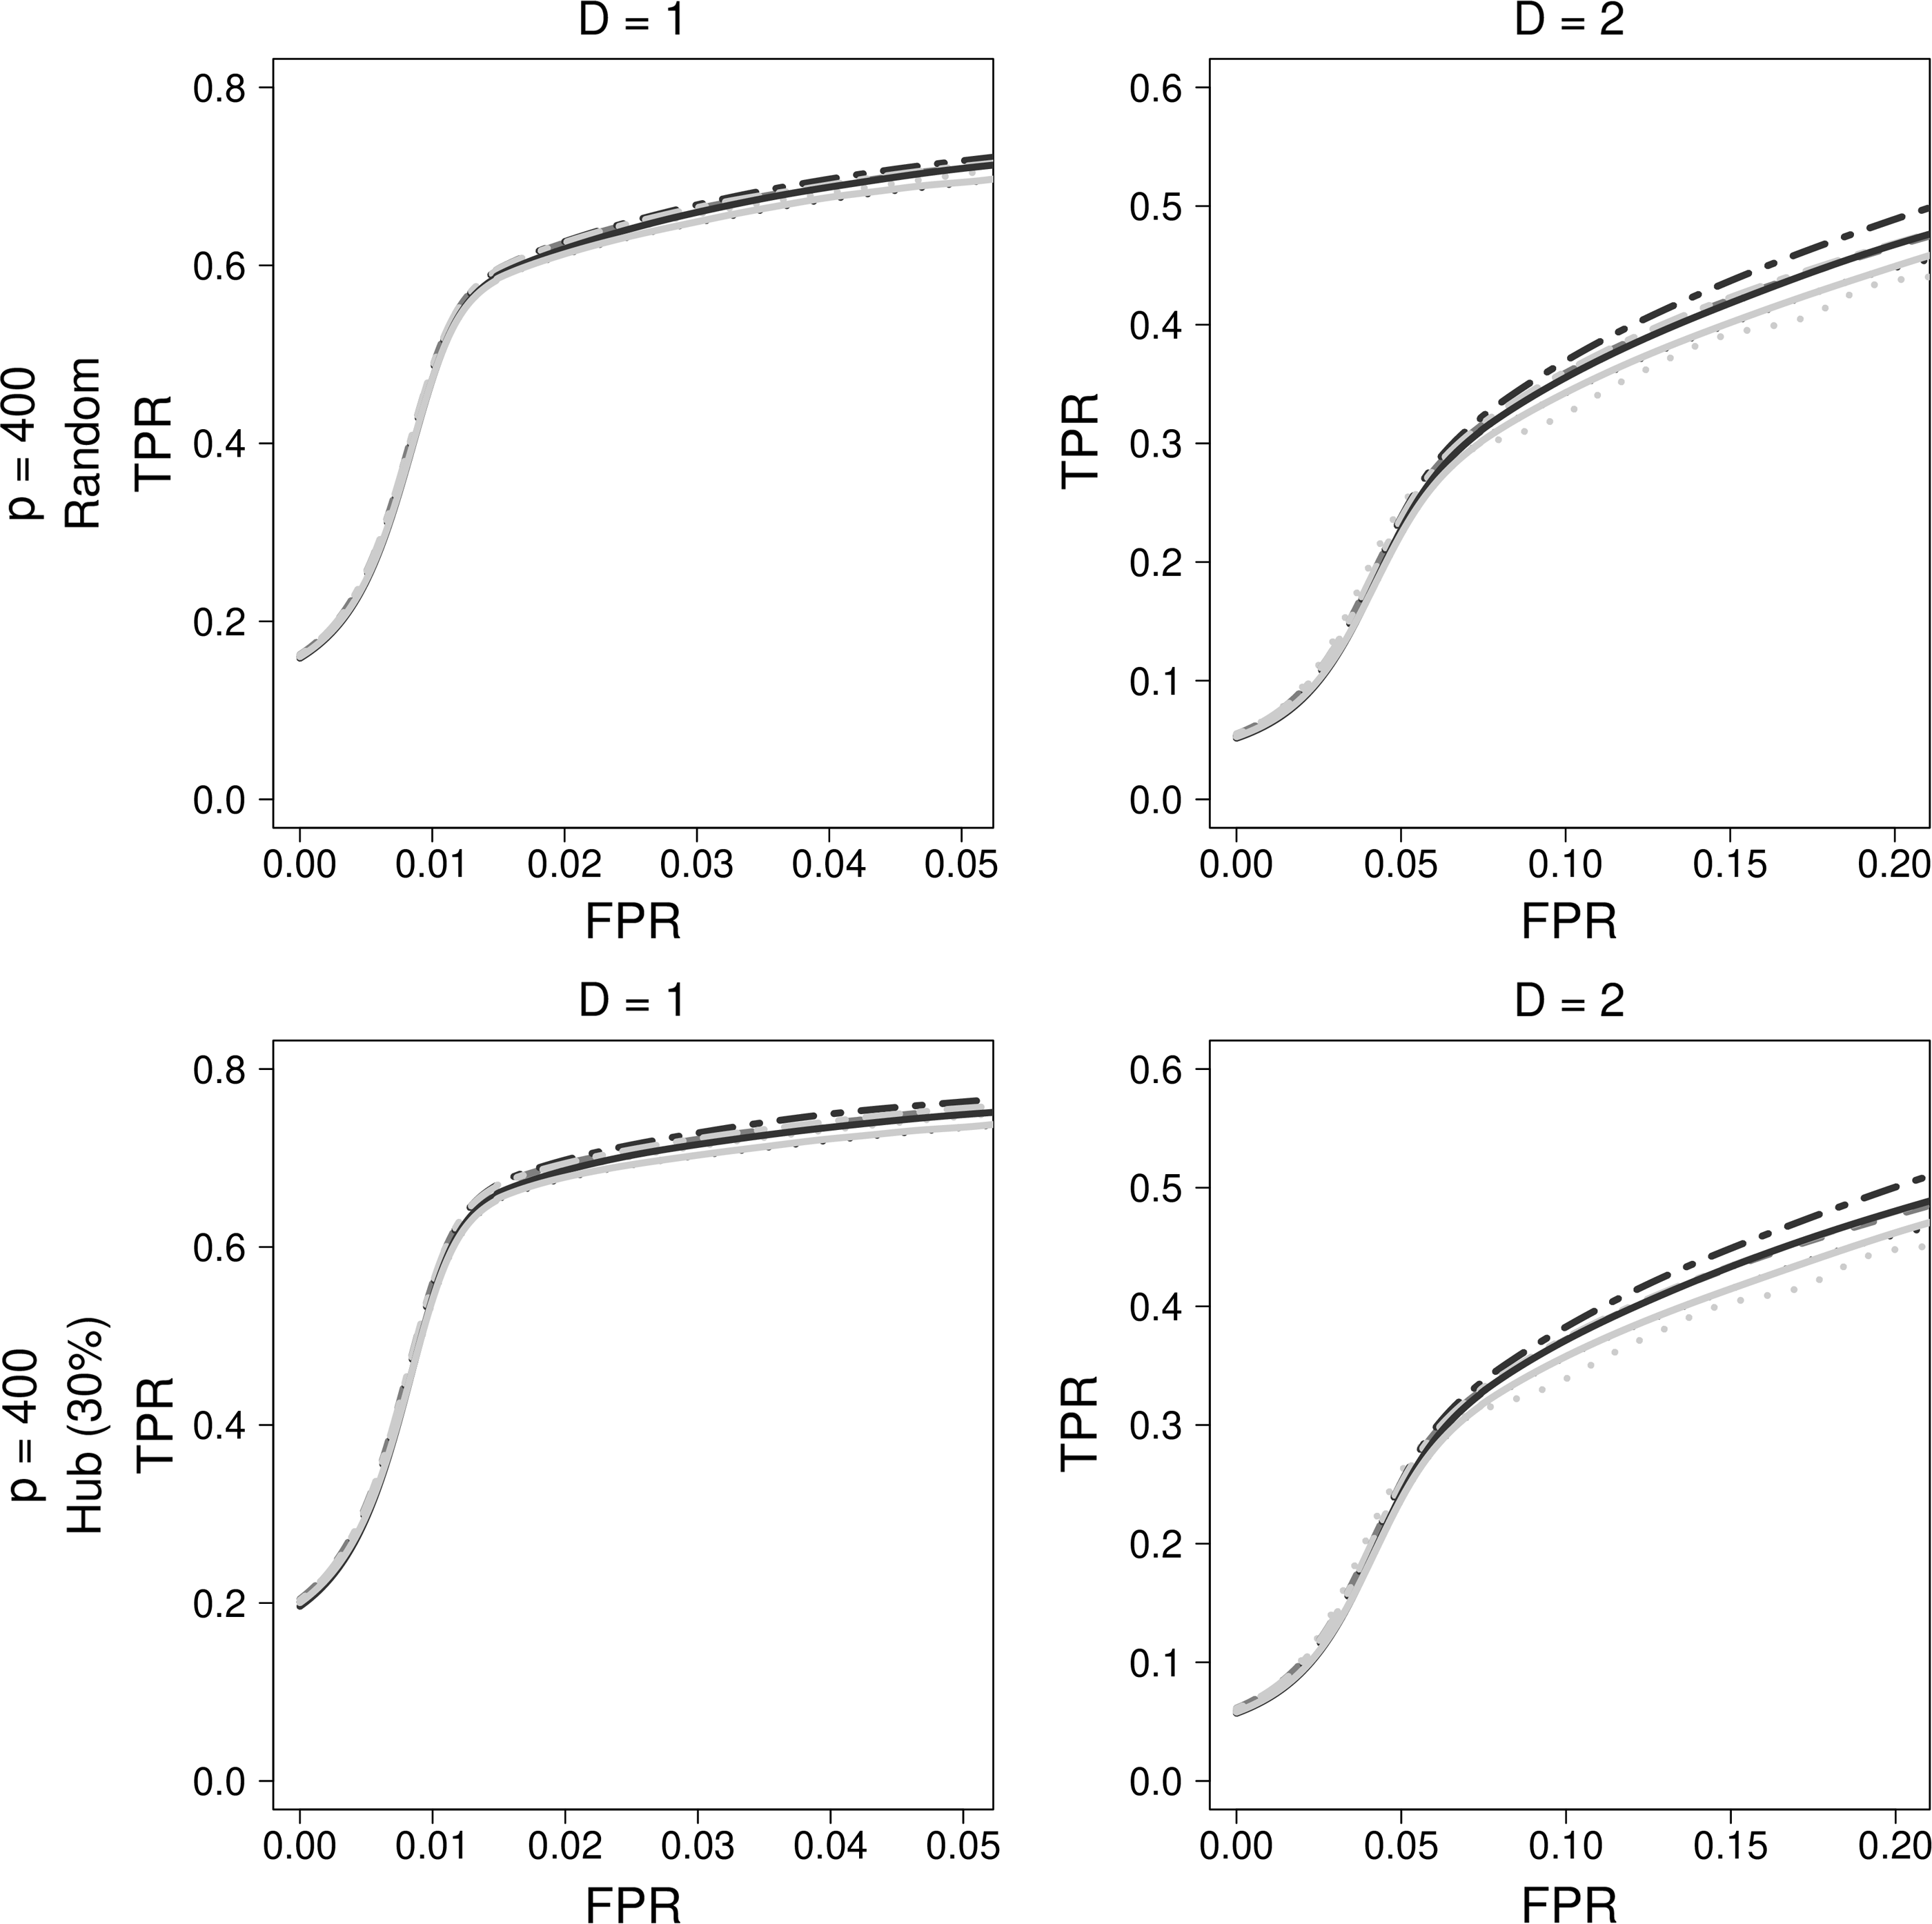
2.3.2. Comparison of final results for other typical simulation data
GENIE3 with extra trees, which is the best method used in bioinformatics, was selected. Based on their performance, LASSO and ADLASSO (
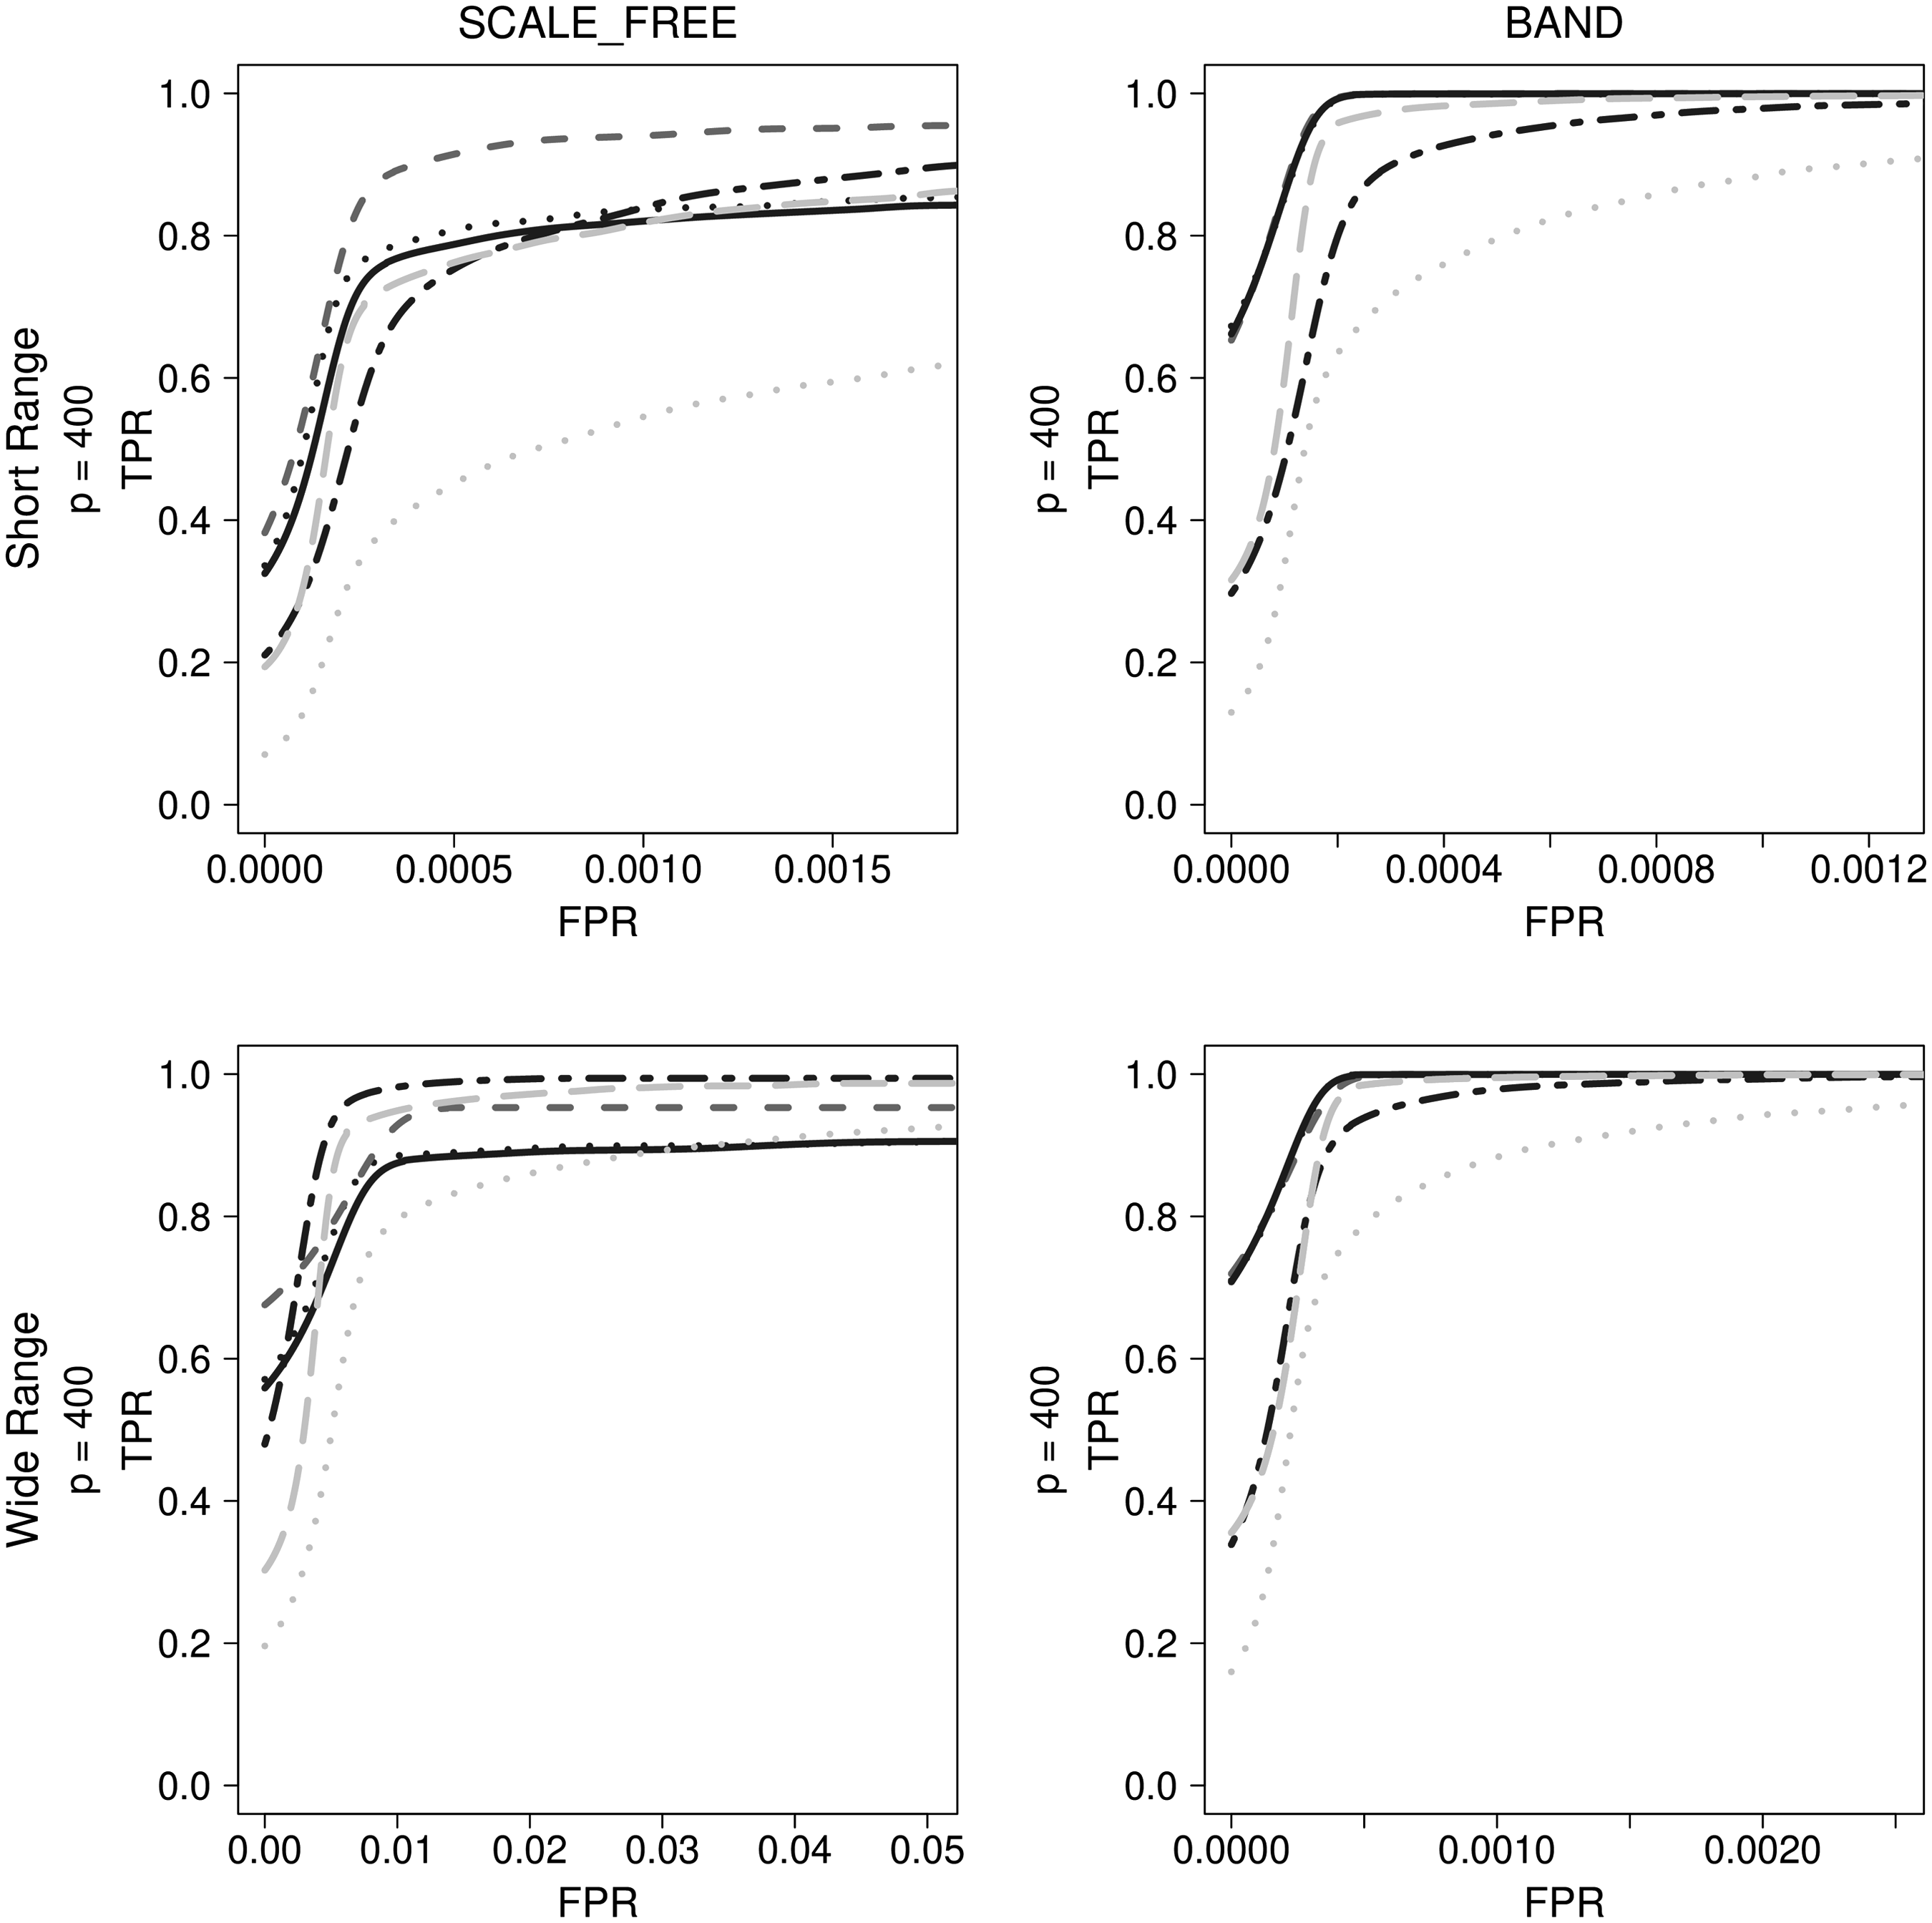
Comparison of final results for other simulation data types. Dark gray dashed lines indicate LASSO, black dotted lines indicate ADLASSO (λ_ini = 0.3), black dotted dashed lines indicate Enet (α = 0.2), black solid lines indicate ADEnet (λ_ini = 0.3; α = 0.8), gray dotted lines indicate CLR, and gray long dashed lines indicate GENIE3_ET.
With scale-free simulation data, GENIE3 and Enet performed better than other methods when FPR exceeded 0.5%. The regression-based approach employing Enet was observed to be superior to GENIE3 across the entire FPR range. Consequently, it was necessary to properly merge LASSO and Enet within the scale-free network. With the band-type simulation data, regression-based methods, excluding Enet, outperformed GENIE3 and CLR. Enet, in contrast, had lower accuracy than GENIE3, unlike the case of the scale-free simulation data.
2.4. Comparison of computational time of the methods
Computational time is another vital performance indicator in network estimation. In this study, a workstation equipped with an Intel(R) Xeon(R) CPU E5-2660 v4 2.00 GHz and 78 GB memory was used. Complexity was defined as the number of estimated edges relative to the number of nodes during simulation, and network estimation computational times were recorded for the genetic random and hub simulation data with number of nodes
Computation Times for Estimating Random Networks
Time unit and complexity; number of estimated edges divided by P; workstation: Intel(R) Xeon(R) CPU E5-2660 v4 2.00 GHz and 78 GB memory.
ADEnet, adaptive elastic-net; ADLASSO, adaptive LASSO; ARACNE, accurate cellular networks; CLR, context likelihood of relatedness; Enet, elastic-net; MRNET, multicast reduction network.
Computation Times for Estimating Hub Networks
Time unit and complexity; number of estimated edges divided by P; workstation: Intel(R) Xeon(R) CPU E5-2660 v4 2.00 GHz and 78 GB memory.
When the number of edges to be estimated was small, methods using mutual information were observed to be rather fast, but they became slower than the regression-based approaches as the number of edges increased. Methods using mutual information have complexities greater than
Among the regression-based methods, the network estimation method using LASSO was the fastest, and ADEnet was the slowest. However, as the number of nodes increased, ADEnet became faster than CLR and MRNET.
GENIE3—the only bioinformatics method demonstrating good performance—required the highest computational time; roughly 500–1000 times more computational time was required compared with other methods, thereby representing a significant disadvantage. In the case of ultrahigh-dimensional genetic data, GENIE3 may not be able to estimate gene networks owing to its high computational demands. Overall, based on the mentioned results, regression-based methods are more suitable for gene network estimation when considering both accuracy and computational time.
3. Application
The incidence of colorectal cancer has increased two- to fourfold in recent decades in Asian countries such as South Korea and China. Dietary habits and lifestyle changes are major reasons behind the increase; however, genetic characteristics of Asian populations could also be important. Asian countries, therefore, require more genetics research efforts to be directed toward the treatment and prevention of colon cancer (Sung et al., 2005). The Cancer Genome Atlas (TCGA) project provides type-sorted cancer-gene-expression data, including results obtained during many colorectal cancer studies. In this study, colon cancer-gene-expression data (TCGA-COAD) from 282 patients were obtained from the TCGA data portal (https://gdac.Broadinstitute.org). By cross-referencing these data with information provided by the Genomic Data Commons portal, the top 50 genes most frequently mutated in colorectal cancer were selected, including APC, TP53, TTN, and KRAS. In addition, several articles were reviewed to identify and add essential genes that cause colorectal cancer, and a data set comprising 73 genes was created. Among genes that were assumed to be colon cancer inducing, those that have been studied are listed in Section 6 of Supplementary Materials. Regression-based methods were used to estimate the networks to identify interactions between genes causing colon cancer.
3.1. Applying the regression-based methods to TCGA-COAD
In the visualization of the gene network, the node size represents betweenness centrality, whereas its color indicates the number of edges per node. The interquartile range (IQR) was defined as
In the final merged model, edges estimated using several regression-based methods were marked by a thick black line. If an edge was estimated by only one of the four models, it was omitted from the network because its reliability was considered to be low. In other words, visualization was performed when edges were estimated by at least two graphical models. The final gene network merging four regression-based models is depicted in Figure 10.
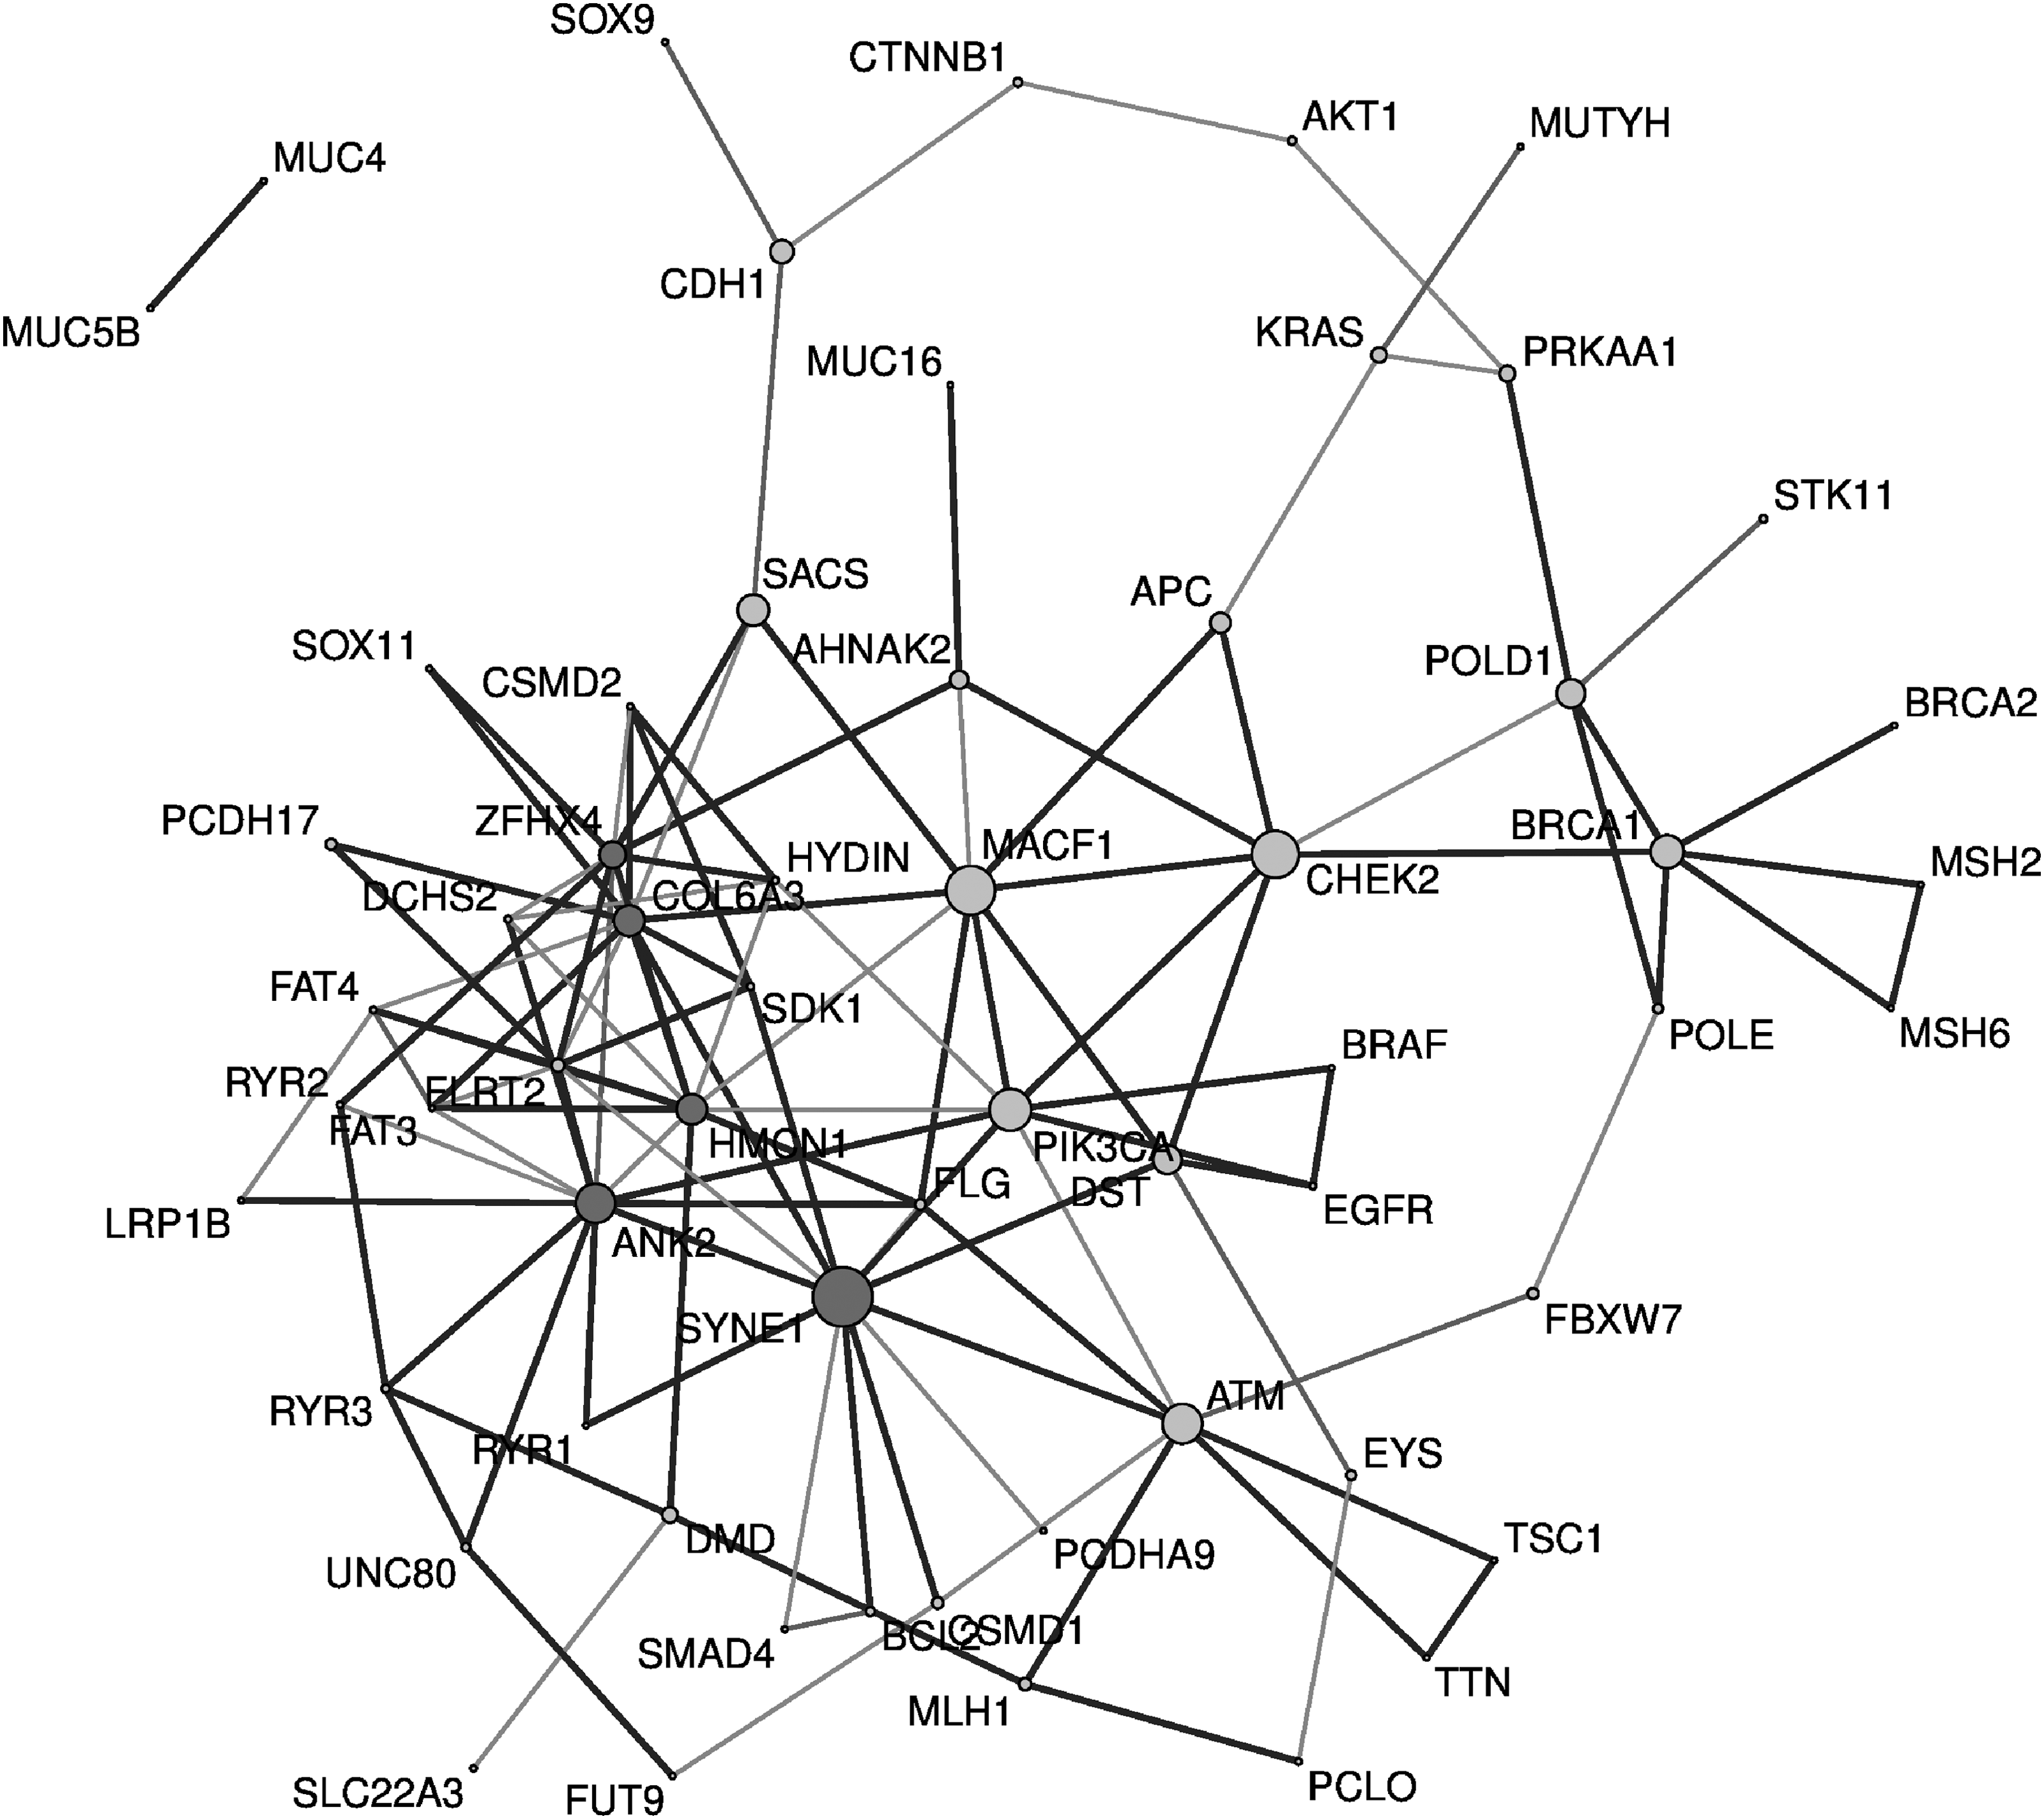
Final colorectal cancer gene network using regression-based approaches. The final gene network is constructed with 60 nodes and 120 edges. Each node has two neighborhoods on average. Node size represents betweenness centrality, and nodes with high degree are marked in dark gray. The overlapped estimated edge is marked by a thick black line.
3.2. Final colorectal cancer gene network
The network shown in Figure 10 was obtained as a result of embedding four regression-based graphical models. The top five genes with high betweenness centrality were SYNE1, MACF1, CHEK2, PIK3CA, and ATM; the genes with the high degrees included ANK2, SYNE1, COL6A3, HMCN1, ZFHX4, and MACF1.
SYNE1 and MACF1, which had remarkably high betweenness and degree, have received much attention in colorectal cancer research. SYNE1 has been proposed as a promising biomarker for colorectal cancer detection (Melotte et al., 2014), and abnormal expression of MACF1 initiates tumor cell proliferation and metastasis in colorectal cancer (Miao et al., 2017).
We could infer why GENIE3 was more suitable for scale-free data than for other data types through the applications. As shown in Section 5 of Supplementary Materials, GENIE3 is a tree-based method in which the structure of the estimated network is such that branches extend from a particular node, similar to a scale-free network.
The final network model with the addition of GENIE3 is shown in Figure 11. Genetic networks based on GENIE3 could be used to find genes related to a specific hub node. In contrast, owing to the limitations concerning estimation of the overall gene structure, appropriate care must be taken to merge GENIE3 with other regression-based methods.
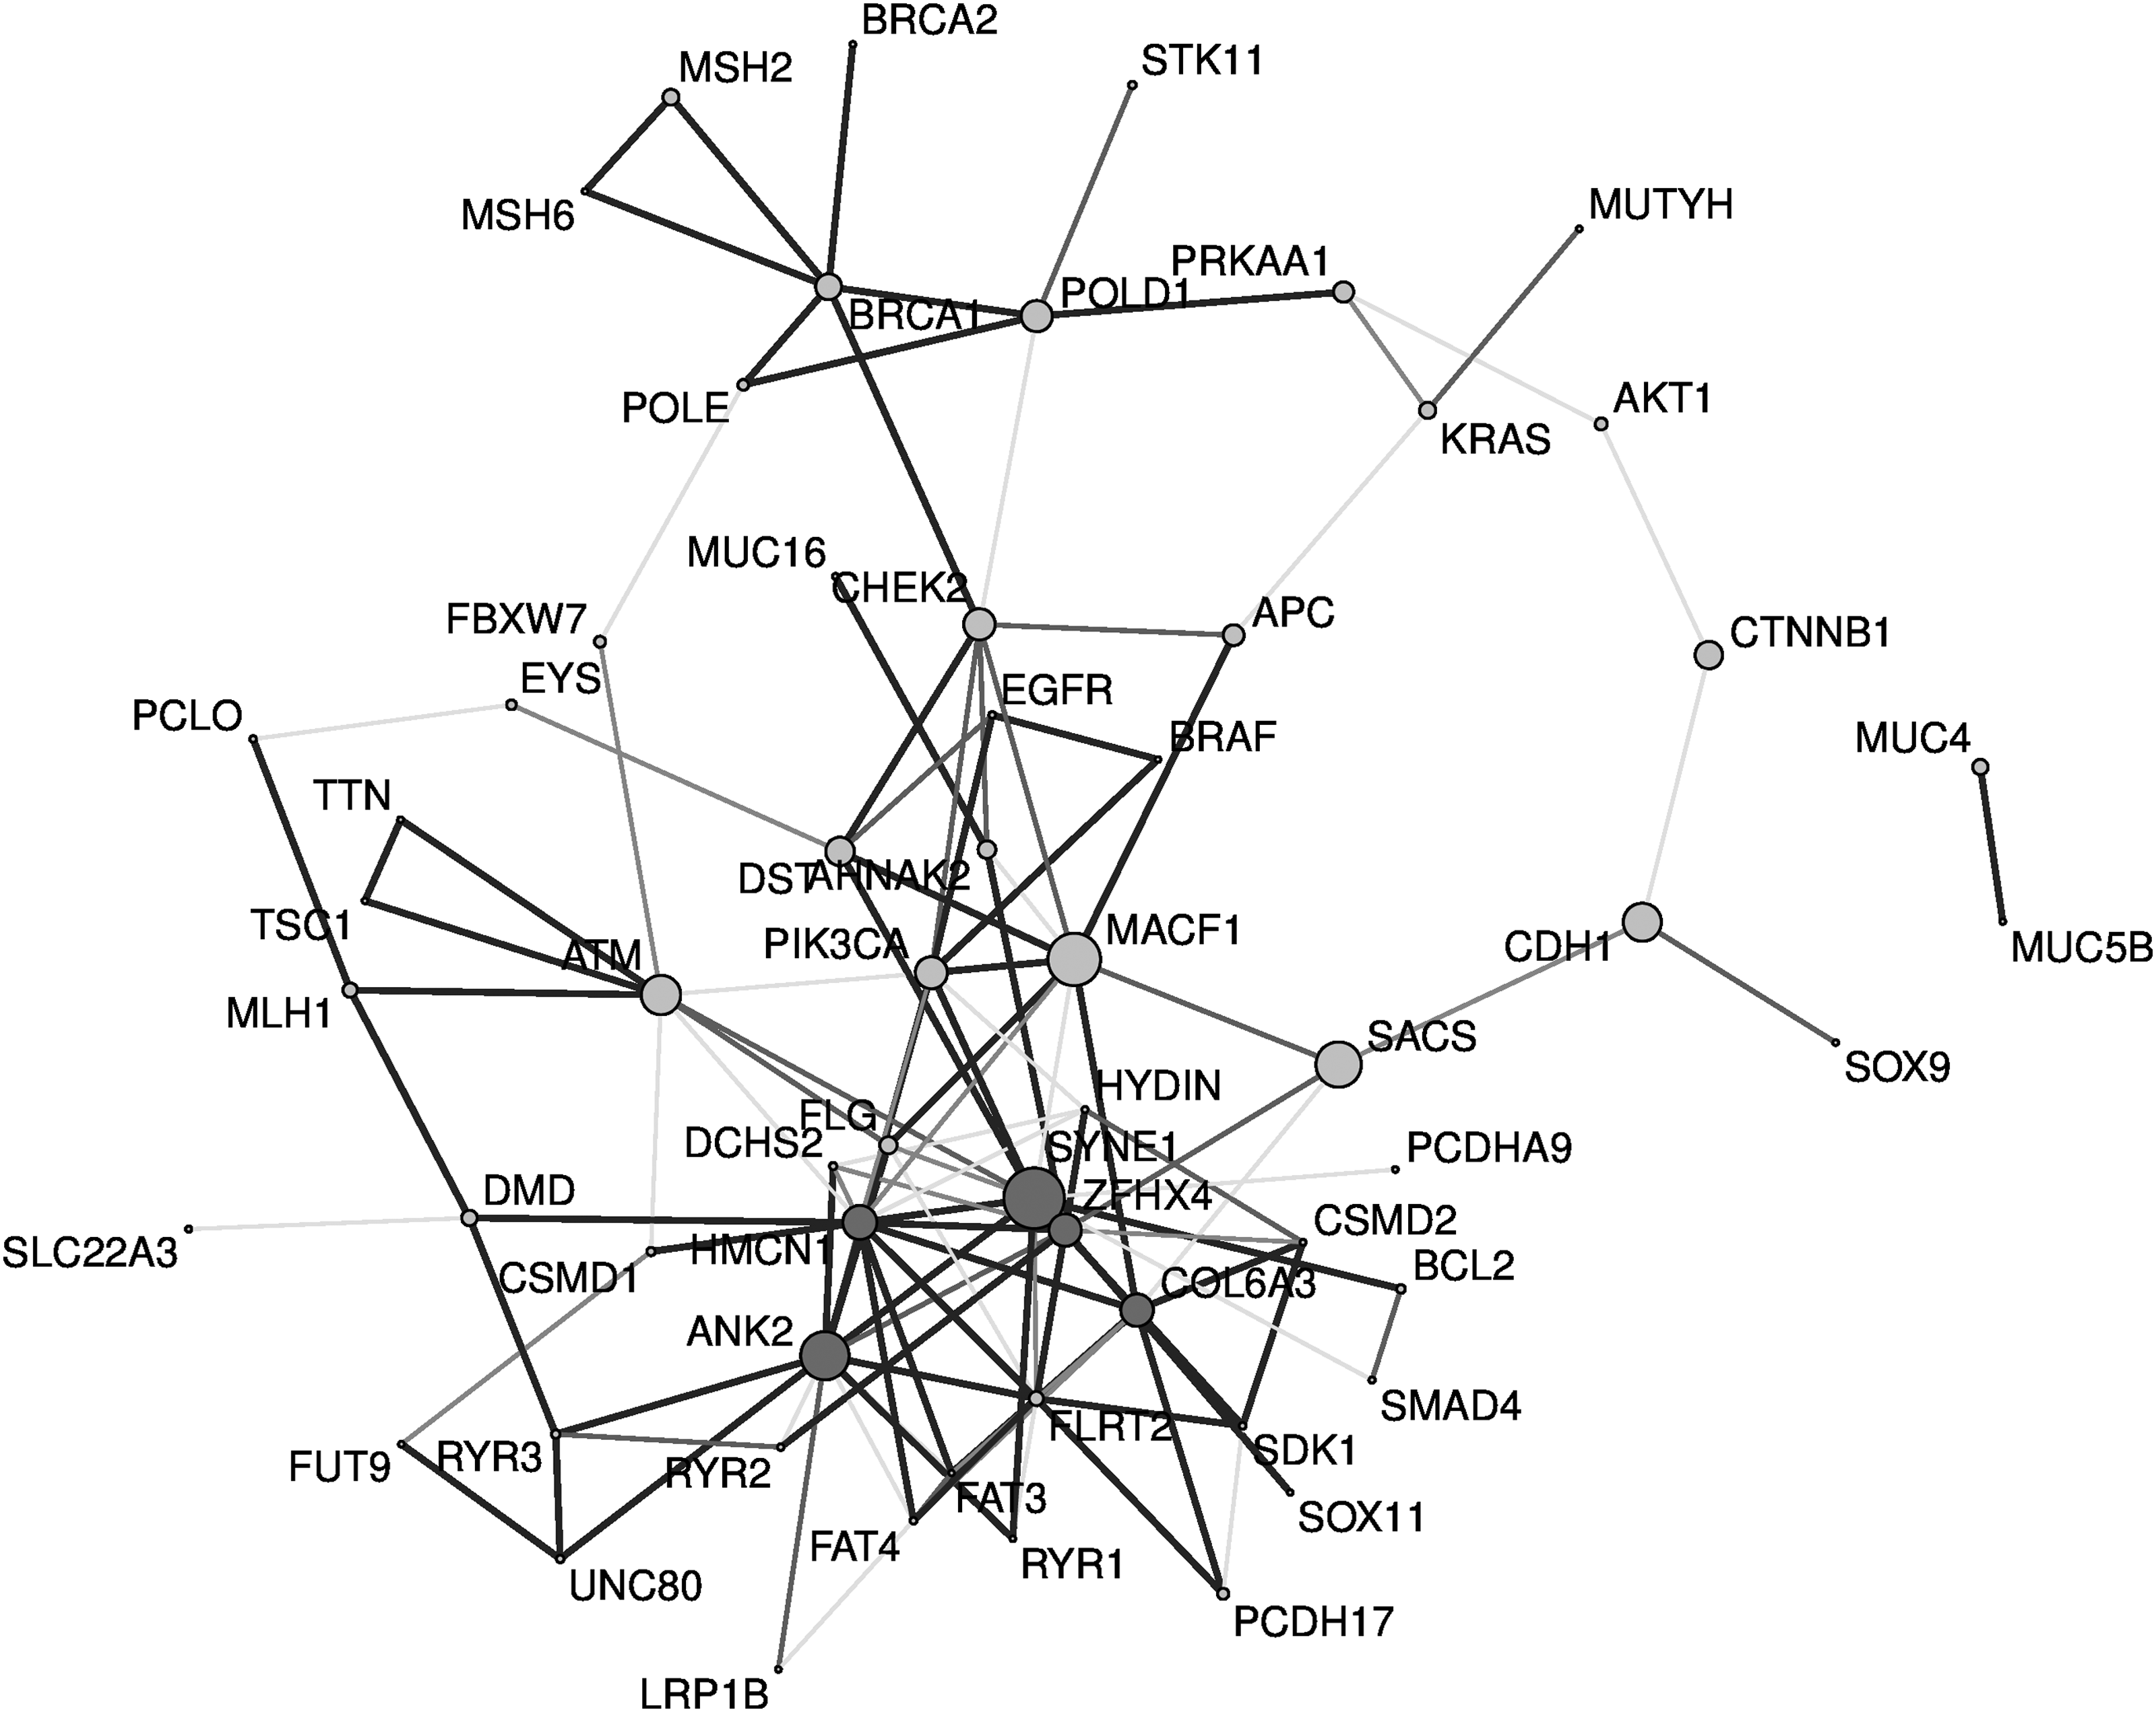
Final colorectal cancer gene network using regression-based approaches and GENIE3. The final gene network is constructed with 60 nodes and 126 edges. Each node has 2.1 neighborhoods on average. Node size represents betweenness centrality, and nodes with high degree are marked in dark gray. The overlapped estimated edge is marked by a thick black line.
4. Conclusion
This study describes development of a network estimation method suitable for handling high-dimensional genetic data. We applied Enet and ADEnet to the network estimation method to resolve problems associated with handling high-dimensional genetic data with hub nodes. Comparisons between existing regression-based approaches, LASSO, ADLASSO, and other bioinformatics methods, have also been performed.
By using simulation data with different properties, the diversity and reliability of the experiments have been secured. This demonstrated the strength of regression-based methods with respect to performance and computation time. Moreover, the proposed method using ADEnet was robust to the properties of the gene data and showed good performance.
Finally, we confirmed the feasibility of the network estimation methods employing Enet and ADEnet by acquiring actual colorectal cancer gene data. Because the best performing method depended on the type of data, embedding graphical models rather than merely using a single model enabled creation of a more reliable genetic network structure. Important genes estimated by the graphical models are now being studied as potential biomarkers for cancer. The proposed study can, therefore, be expected to make meaningful contributions to researches concerning genes related to cancer.
In the future, we aim to develop a network estimation method that provides optimal performance for all types of genetic data. ADEnet and Enet have demonstrated satisfactory performance when handling several simulation data types, so further research concerning these approaches must continue. We expect this work to play a vital part in the development of gene estimation methods.
Footnotes
Acknowledgments
This research was supported by grants from the National Research Foundation of Korea (NRF-2017R1E1A1A03070507 and NRF-2017R1C1B2002850) and Korea University (K1719881 and K1822881). This article contains a portion of the MS thesis compiled by Kyu Min Lee, which followed the policy and guidelines of Korea University. Copyright is held by the Journal of Computational Biology.
Author Disclosure Statement
The authors declare that no competing financial interests exist.
References
Supplementary Material
Please find the following supplemental material available below.
For Open Access articles published under a Creative Commons License, all supplemental material carries the same license as the article it is associated with.
For non-Open Access articles published, all supplemental material carries a non-exclusive license, and permission requests for re-use of supplemental material or any part of supplemental material shall be sent directly to the copyright owner as specified in the copyright notice associated with the article.