
Abstract
The cholesterol-ester transfer protein (CETP) exchanges lipids between high-density lipoproteins (HDLs) and low-density lipoproteins (LDLs). The excessive transport of lipids from HDLs to LDLs mediated by this protein can cause an alteration in the deposition of lipoproteins onto the arterial walls, thus promoting the development of arteriosclerosis. Different CETP inhibitors have been tested in recent years, but none has been confirmed as being effectively palliative for the disease. We employed in silico databases and molecular docking as a computational method to predict how potential CETP inhibitors could interact with the active site of the CETP protein. Upon previously comparing two computer software packages to determine which generated a greater number of accurate CETP-inhibitor–complex structures, we chose the more appropriate program for our studies. We then abstracted a series of databases of known CETP inhibitors and noninhibitors exhibiting different 50% concentrations of CETP-inhibitory (INH) activity, to generate virtual structures for docking with different combinations of the CETP receptor. From this process, we obtained as the most suitable structure 4F2A_1OB_C_PCW—it accordingly having a greater area under the receiver operating characteristic curve. The molecular docking of known compounds in comparison with the respective conformation of this inhibitor enabled us to obtain ΔGs (in kcal/mol) from which data we made a first exploration of unknown compounds for CETP-INH activity. Thus, the 4F2A_1OB_C_PCW structure was docked with DrugBank-Approved commercial compounds in an extensive database, whose status had already been established from pharmacokinetics and toxicology. In this study, we present a group of potential compounds as CETP-inhibitor candidates.
Introduction
Reverse cholesterol transport (RCT) is a mechanism that transports cholesterol from peripheral tissues to the liver for catabolism and excretion and includes the remodeling of lipoproteins such as high-density lipoproteins (HDLs). Very-low-density lipoproteins (VLDLs) transport lipids from the liver to peripheral tissues, changing their lipid load and apolipoprotein content and form low-density lipoproteins (LDLs). Excess LDL constitutes a target for the oxidation of their lipids and deposits onto the arterial wall to induce atherogenic plaque. High levels of LDL cholesterol (LDLc) have been correlated with the risk of coronary heart disease. The cholesterol-ester transfer protein (CETP) is a glycoprotein that mediates the bidirectional—so-called heterotypic—transfer of neutral lipids, including cholesteryl esters (CEs) and triglycerides between different types of HDLs and VLDLs, and/or LDLs (Tall, 1993; Trueque et al., 2003). In such transfers, the CEs are shuttled from the HDLs to the VLDLs and/or the LDLs, whereas the triglycerides are moved from the VLDLs and/or the LDLs to the HDLs. CETP also mediates the homotypic transfer of phospholipid and CE between the HDLs. For example, CETP transfers >80% of the CEs from HDLs to VLDLs and/or LDLs in humans (Ouguerram et al., 2002; Schwartz et al., 2004). An inhibition of the heterotypic transfer by CETP could be a promising means of diminishing LDLc levels and thus represents a therapeutic potential for the treatment of cardiovascular diseases.
Many CETP inhibitors have been developed, with four—torcetrapib, dalcetrapib, anacetrapib, and evacetrapib—having reached a late stage in clinical trials. Torcetrapib and dalcetrapib have failed in the phase-III clinical evaluation, and anacetrapib and evacetrapib are presently under phase-III scrutinization. Torcetrapib increases the affinity between CETP and HDL, thus reducing the CETP availability to mediate the heterotypic transfer between the lipoproteins (Karalis et al., 2013). Torcetrapib has been removed from the market, however, because of its negative physiologic consequences. Dalcetrapib reduces heterotypic but not homotypic transfer upon binding to CETP so as to diminish CETP activity by 50% and increase HDL cholesterol levels by 31% without changing LDLc concentrations (Shinkai, 2012). Dalcetrapib was the first molecule to increase RCT with an antiatherogenic effect, but it was restricted because of the compound's rapid metabolization (Black et al., 2018). Nevertheless, the pharmacologic inhibition of CETP constitutes a promising possibility for reducing atherogenic risk and one that has become a current strategy of great interest in cardiovascular medicine.
Molecular docking is a computational method that can predict how a ligand interacts with the active site of a receptor. This prediction is made through an exploration of possible relative ligand–receptor configurations and a simultaneous evaluation of the intermolecular interactions occurring in each position. As a result, a set of complexes is obtained that are ordered by the program according to an evaluation function to detect the most energetically favorable configuration (Brooijmans, 2009). Since docking requires a prior determination of the high-resolution three-dimensional (3D) structure of the molecular target, the published crystalline structures of CETP have contributed the information for facilitating the search for inhibitors. The crystallography of CETP (Qiu et al., 2007) revealed a long tunnel and four bound lipid molecules, two CEs, and two phosphatidylcholines (PCs). Subsequently, crystalline structures of CETP complexed with different inhibitors were determined (Liu et al., 2012; Zhang et al., 2012). Thus, a virtual screening of potential inhibitors by docking has been used as a strategy to find new active compounds through in silico chemical database exploration.
The main objective of this study was to perform an exhaustive search of probable CETP inhibitors through the use of computational tools. Different selected databases from known inhibitors and noninhibitors at a particular 50% inhibitory concentration (IC50) were used. The reconstruction of known compounds enabled us to obtain a value for the difference in Gibbs-free energy of binding ΔG (kcal/mol), from which parameter we made an initial exploration of the effect of unknown compounds on CETP activity, the results of which are reported here.
Methods
CETP receptor and ligand optimization
The 3D structures of CETP extracted from the protein data bank were designated 4EWS, 4F2A, and 2OBD. The 2OBD represents the native structure CETP with two CEs and two PC ligands (Qiu et al., 2007). The 4EWS and 4F2A were crystallized with two CEs (N- and C-termini) and only one PC (C-terminus) along with the inhibitors torcetrapib (ORP) and (2R)-3-{[4-(4-chloro-3-ethylphenoxy)pyrimidin-2-yl][3-(1,1,2,2-tetrafluoroethoxy)benzyl]amino}-1,1,1-trifluoropropan-2-ol (OSF), respectively. In both instances, the CE at the N-terminus is displaced to give space to the inhibitors (Liu et al., 2012). The receptors were well off oriented using VMD 1.9.2 software to accommodate the grid box of MGL Tools, thus optimizing the molecular docking. We employed the graphical interface of the MGLTools1.5.4 with the purpose of obtaining pdbqt receptor files. The natural ligands and inhibitor structures were obtained from the literature and reconstructed with the 2D MarvinSketch editor. The chiral ligands were transformed into 3D structures with the Avogadro software and reduced to a local energetic minimum. Finally, the ligands were generated in as pdbqt files with the MGLTools1.5.4 software.
Reconstruction of different crystallized ligands and CETP receptor structures and comparison of different software
The molecular docking was performed with the Autodock 4.0 and Autodock Vina software and their specifications were obtained with MGLTools1.5.4. This program specifies the work mode rigid receptor/flexible ligand and so the grid box was built by using an algorithm and the expected outputs. Autodock Vina reproduces better with respect to the energy level by obtaining lower energy values than Autodock 4.0, and also a better reproduction of the crystalline structure of the receptor attached to its inhibitor. The databases were extracted of the ZINC database (http://zinc15.docking.org). We performed molecular docking of the 4EWS- and 4F2A-occupied receptor conformations with the respective crystallized inhibitory ligands already mentioned. The CETP protein was downloaded from (http://www.rcsb.org/pdb); accession code 4F2A, (http://www.rcsb.org/pdb); accession code 4EWS, (http://www.rcsb.org/pdb); and accession code 2OBD (Qiu et al., 2007; Liu et al., 2012).
Construction of the databases
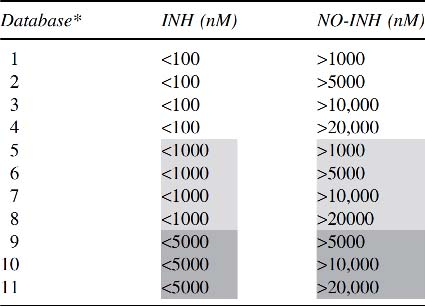
Eleven databases of inhibitory (INH) and noninhibitory (NO-INH) compounds for testing were constructed, differentiated by the cutoff values of their IC50 (nM) for the INH and NO-INH compounds (Table 1). The compounds were extracted from the following publications (Chackalamannil et al., 1995; Pietzonka et al., 1996; Xia et al., 1996; Durley et al., 2000, 2002; Shinkai et al., 2000; Massa et al., 2001; Reinhard et al., 2003; Maeda et al., 2004; Brückner et al., 2005; Harikrishnan et al., 2008, 2012; Cameron et al., 2010; Hunt et al., 2010; Lu et al., 2010, 2012; Schmeck et al., 2010; Sheikha et al., 2010; Wang et al., 2010, 2014; Kallashi et al., 2011; Sweis et al., 2011; Thompson et al., 2011; Vakalopoulos et al., 2011; Escribano et al., 2012; Fernandez et al., 2012; Miller et al., 2012; Smith et al., 2012; Kalgutkar et al., 2014; Trieselmann et al., 2014; Qiao et al., 2015; Jiang et al., 2016; Wilson et al., 2016; Zhao et al., 2016; Chang et al., 2017).
Construction of the Database for Testing
Construction of the Database for Testing
For the INH and NO-INH compounds, the 11 databases constructed for testing were differentiated by the IC50 cutoff values (nM) for the INH and NO-INH compounds.
IC50, 50% inhibitory concentration; INH, inhibitory; NO-INH, noninhibitory.
Shading used to clarify data between different inhibitor groups (<100, <1000, and <5000).
To determine whether the presence or absence of natural CETP ligands modified the docking of the CETP structure with the inhibitor, eight possible combinations were tested with the two crystallized CETP receptors (4F2A or 4EWS). The structures were determined from different combinations with the natural ligands. Once the 16 combinations were obtained for the 2 CETP receptors, the docking with the respective crystallized inhibitors was performed using the Autodock 4 and Autodock Vina software. Thus, the combined structures used were the following for each of the two CETP receptors: (1) the empty CETP receptor; (2) extension_OB_C: 1 CE (C-terminus); (3) _1OB_C_DLP: 1 CE (C-terminus) and 1 PC (C-terminus); (4) _1OB_N: 1 CE (N-terminus); (5) _OB_N_DLP: 1 PC (C-terminus) and 1 CE (N-terminus); (6) _2OB: 1 CE (C-terminus) and a second CE (N-terminus); (7) _2OB_DLP: 2 CEs and 1 PC (C-terminus); (8) _DLP: 1 PC (C-terminus).
Construction of receiver operating characteristic curves with the best predictive value for the eight 4EWS- and 4F2A–CETP receptor complexes
Vina software was selected because that package had correctly reproduced a greater number of structures combined with their published inhibitors for the 4EWS and 4F2A receptors. Molecular docking was carried out with the 11 databases built from known INH and NO-INH compounds. Each of the eight structures of 4EWS and 4F2A was docked with the 11 database-constructed virtual ligands from the different inhibitor and noninhibitor groupings chosen on the basis of the corresponding IC50 as already described. The IC50 values were derived after analysis of relevant receiver operating characteristic (ROC) curves.
4F2A_1OB_C_PCW ROC curves with buffer and serum generated with different inhibitors
We decided to evaluate ROC curves for each of the three experimental conditions under which the IC50 values of the different CETP inhibitors and noninhibitors were measured in the previously established 11 databases—that is, in buffer (B), serum (S), or buffer plus serum (B+S). The group of compounds analyzed in buffer plus serum comprised those measured in buffer or serum alone or in buffer plus serum, with the IC50 measured in buffer alone being used exclusively. The group of compounds analyzed in buffer (B) consisted of those measured in buffer or buffer plus serum, with the IC50 measured in buffer alone being used exclusively. The group of compounds analyzed in serum included those measured in serum or buffer plus serum, with the IC50 measured in serum alone being used exclusively.
Selection of the ΔG cutoff value with 4F2A_1OB_C_PCW for inhibitors measured in buffer and/or serum
Different specificity curves were performed according to the sensitivity for the three test groups (B, S, and B+S) to establish a separate cutoff for each one. The theoretical optimal intersection point between the groups of inhibitors and noninhibitors was taken into account. The cutoff was determined by a particular ΔG (kcal/mol), the value of which was later used as a cutoff parameter when the docking was performed against a higher order base.
4F2A_1OB_C_PCW docking against a higher base (DrugBank-Approved)
Subsequently, the docking was performed with a database of 2392 compounds of unknown pharmacologic activity against the 4F2A_1OB_C_PCW receptor under the previously tested conditions. This database is a subset of Drug-Bank, called DrugBank-Approved (http://zinc15.docking.org/catalogs/dbap).
Results
Influence of CETP natural ligands on the docking between the inhibitors torcetrapib and OSF with the crystallized 4EWS and 4F2A structures
Autodock 4.0 and Autodock Vina were used to evaluate which one was better in reproducing parameters of the crystalline structure of 4EWS and 4F2A. The 4EWS receptor CETP used with Autodock 4.0 showed that only four of the eight combinations employed reproduced the crystalline structure of CETP with the torcetrapib inhibitor. With the 4F2A receptor, however, none of the combinations used reproduced the structure of the CETP–ligand crystal. Upon using Autodock Vina, we observed that for the 4EWS complexes, the program reproduced the eight receptor–ligand combinations containing the structure of the crystallized torcetrapib. In contrast, with the 4F2A receptor, Autodock Vina reproduced only four out of the eight structures tested for the crystallized CETP–OSF complex (Table 2). Because of this superior performance, Autodock-Vina was selected for use in the studies described hereunder.
Influence of Natural Cholesterol-Ester–Transfer Protein (CETP) Ligands on the Docking of CETP Structures with Crystallized Inhibitors

Influence of Natural Cholesterol-Ester–Transfer Protein (CETP) Ligands on the Docking of CETP Structures with Crystallized Inhibitors
Sixteen combinations between CETP and different ligands were obtained for the two CETP receptors (4F2A and 4EWS). The docking was performed with the respective INH crystalline structures simulated by the Autodock 4 and Autodock Vina software. The structures that reproduced the complex with the indicated INH are highlighted in gray.
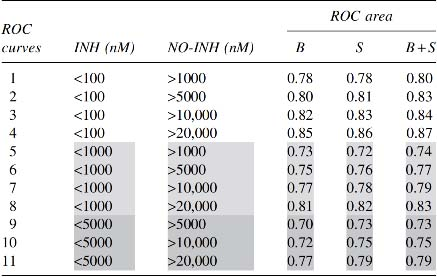
ROC curves were simulated and generated for the 16 structures of 4EWS and 4F2A. We illustrate here only the ROC curves for the docked structure 4F2A_1OB_C_PCW (cf. Section 2.4, structure c) against the 11 databases already described, since these structures were associated with a greater value for the area under the curve (Fig. 1). Out of the 11 databases tested (cf. Table 1), the Database 4 (INH, nM <100 and NO-INH, nM >20,000) was the one registering the greatest area under the curve and, therefore, exhibited the greatest discrimination between inhibitors and noninhibitors (Table 3). With respect to 4EWS_1OB_C_DLP, the area under the curve was 0.84 (data not shown) and that for 4F2A_1OB_C_PCW was 0.87 (Fig. 1). Therefore, of the 416 compounds of Database (4), 47% would act as inhibitors and 53% as noninhibitors of CETP (Table 4).

ROC curves constructed for the 4F2A CETP receptor. The ROC curve value for the 4F2A_1OB_C_PCW structure was docked with the 11 databases described in the Section 2. In the figure, the fractional sensitivity is plotted on the ordinate as a function of 1 minus the fractional specificity on the abscissa. The ROC area (A) for the database corresponding to each of the curves is indicated in the inset beside the key to that curve symbol, with the database 4 exhibiting the highest value (0.87). CETP, cholesterol-ester–transfer protein; ROC, receiver operating characteristic.
Values of the Areas Under the Receiver Operating Characteristic Curves Obtained with Receptor Structure 4F2A_1OB_C_PCW Corresponding to the 11 Databases Created

Database 4—INH) at <100 nM and NO-INH at nM >20,000—was the most highly discriminatory between the INH and the NO-INH compounds.
ROC, receiver operating characteristic.
Shading used to clarify data between different inhibitor groups (<100, <1000, and <5000).
Quantity of Compounds Obtained Within the Indicated IC50 nM Range Within All 11 Databases
The table shows the total compound number of INH and NO-INH obtained from 11 databases.
In this instance, we discriminated between each of the 11 databases of compounds with respect to those where the biologic activity was tested only in buffer (B), only in serum (S), or in both buffer and serum (B+S), as detailed in Section 2. The compounds of the Database 4 docked onto 4F2A_1OB_C_PCW were those registering the greatest area under ROC curves where the biologic activity was evaluated in B, S, or B+S. For the compounds docked onto this structure, the values obtained for the area under curves were 0.85 for B, 0.86 for S, and 0.87 for B + S (Table 5). Table 6 lists the number of INH and NO-INH compounds contained within the nM-IC50 limits used to define the 11 databases. Figure 2 illustrates how the superimposition of the ROC curves for the compounds tested in B, S, or B + S is not significantly different.

Comparison of ROC curves for 4F2A_1OB_C_PCW from database 4 for measurements made in buffer alone (B), in serum alone (S), or in buffer plus serum (B+S). In the figure, the fractional sensitivity is plotted on the ordinate as a function of 1 minus the fractional specificity on the abscissa. The inset indicates the key to the symbols denoting the different curves. The 0.5 line signifies the baseline from which the ROC curves are generated. The ROC curves between compounds tested under the three conditions are not significantly different.
Comparison of Values of the Receiver Operating Characteristic Curves for 4F2A_1OB_C_PCW Corresponding to the Database Compounds for the Measurements Performed in Buffer and/or Serum
In this table, we used the compounds from 11 databases to compare the ROC curves corresponding to the different virtual recceptor–ligand dockings performed in buffer (B), serum (S), or buffer plus serum (B+S). With database 4, no significant differences between the three docking conditions were obtained: that is, 0.85 for B, 0.86 for S, and 0.87 for B+S.
Shading used to clarify data.
Quantity of INH and NO-INH Compounds Contained Within the IC50 nM Limits Used to Define the 11 Databases for the Measurements Performed in Buffer and/or Serum

This table lists the number of INH and NO-INH compounds within the 11 databases.
Shading used to clarify data.
From the ROC specificity-versus-sensitivity curves for each of the three test conditions (B, S, and B+S) for compounds from Database 4 with 4F2A_1OB_C_PCW as the receptor conformation, we can obtain values of ΔG (kcal/mol). From the analysis of the ROC curves, a cutoff free-energy difference of −10.1 kcal/mol was selected for distinguishing between the CETP inhibitors and noninhibitors. This value corresponds to 0.79 and 0.80 of the sensitivity and specificity, respectively (Fig. 3). This ΔG value of −10.1 kcal/mol was used to establish a cutoff for compounds selection from a higher database with a ΔG equal to or less than that value.

Selection of cutoff values with 4F2A_1OB_C_PCW as the receptor conformation in measurements performed in buffer alone
A database of 2392 commercial compounds of unknown effect on CETP activity (DrugBank-Approved) was docked onto the receptor 4F2A_1OB_C_PCW under previously described conditions. Out of the 2392 compounds, 110 (∼5%) were selected for having energies lower than −10.1 kcal/mol. Moreover, we have favored those compounds having a molecular weight <600 Da since we believe that lower weight class represents a group with greater relevance as therapeutic agents (Table 7).
Potential Inhibitors of Cholesterol-Ester–Transfer Protein Activity

Potential Inhibitors of Cholesterol-Ester–Transfer Protein Activity
The 4F2A_1OB_C_PCW structure was docked with different commercial compounds from the DrugBank-Approved database (cf. Section 3). All the potential INHs of CETP activity obtained have a ΔG value near to −10 kcal/mol and a molecular weight ≤600 kDa (highlighted in gray).
Because CETP inhibition constitutes a potential strategy to increase HDL-cholesterol levels and thus decrease harmful cardiovascular events, a great interest in the characterization of pharmacological CETP inhibitors has arisen (Tall, 1993). Structure-based drug design is an approach that accelerates drug discovery through the use of structural information and computing tools for the prediction of the potential inhibitors, in particular, the virtual screening of candidate compounds. The docking programs use different protocols to monitor the possible ligand–receptor conformations (algorithm of conformation searches) and different potential functions (algorithm of evaluation functions) to quantify the binding energy predicted for each complex. To have a high level of confidence in predicting information that is not experimentally available, the capability of each docking program to reproduce experimental data must at first be evaluated. First, we have analyzed the program's capability of reproducing the conformation of known complexes (Brooijmans, 2009); then, we have studied the compounds docking to classify the active and inactive compounds through the evaluation function. The elucidation of the CETP structure showed a hydrophobic tunnel with two pockets, one in the N-terminus and the other in the C-terminus, in which regions lipids bind in 2 U (Qiu et al., 2007). This information was the basis for the proposal of a mechanism for lipid transfer between HDL and LDL—namely, by means of passage through this tunnel.
Recently, the crystallographic structure of a complex between CETP and torcetrapib showed that the inhibitor occupies the hydrophobic tunnel in the area near the N-terminus in the central part of the tunnel, thus blocking the passage of lipids. Moreover, the structure of a complex formed by CETP and OSF inhibitor has been reported also to occupy the same N-terminal region of CETP as torcetrapib.
Accordingly, the capability of different docking programs to reproduce the structure of these two complexes was first determined. To that end, the inhibitors were separated from the complexes and the software was programmed to reform each of the two complexes. A given software's capability of regenerating both complexes with a conformation very similar to the experimental conformation was, therefore, systematically evaluated. First, different combinations of the CETP structures containing the protein's natural ligands were analyzed and evaluated before the examination of the docking with each one of the two inhibitors (torcetrapib and ORF). The different combinations of the inhibited transporter structures (from EWS and F2A) were docked with known CETP inhibitors and noninhibitors from a series of databases with different ranges in their IC50 (nM) values, to later evaluate which database resulted in a better prediction as indicated by the area under the ROC curve, which parameter distinguished inhibitors from noninhibitors, and the ΔG value was established. That parameter was then used to group those compounds that met this condition for carrying out docking with a higher database. The compounds within the group tested that were as negative, or more so, than that previously determined ΔG cutoff value were considered to be promising CETP inhibitors. A subsequent virtual screening involved the search for promising compounds within large databases of chemical structures in silico.
We have tried to apply an algorithm or computing model as a form of filter for selecting from the database those structures that met molecular requirements that were necessary for INH activity.
The compounds to be docked with the CETP in the virtual screening were derived from Drug Bank approved (http://zinc15.docking.org/catalogs/dbap/). These drugs whose structure has been approved by the United States Federal Drug Association for direct human use or in clinical studies have already been characterized with respect to pharmacokinetic and toxicologic properties. In this work, we have studied binding properties of these compounds to CETP and, therefore, if preliminary studies confirm the inhibitor potentiality of these drugs, then the inhibitor drug development process will be significantly shortened. Further investigation from other databases is neccessary to increase the quantity of possible compunds that may be effective in the attenuation of atherosclerosis.
Footnotes
Acknowledgments
This study was partially supported by grants from the National Council of Scientific and Technical Research (CONICET), the National Agency of Promotion Scientific and Technical (FONCyT), and the National University of La Plata (UNLP). We thank Dr. Luciana Gavernet and Dr. Pablo Palestro for their scientific suggestions. We thank Ramos Mario for excellent technical assistance. Dr. Donald F. Haggerty, a retired academic career investigator and native English speaker, edited the final version of the article.
Author Disclosure Statement
The authors declare that no competing financial interests exist.