




Abstract
Abstract
Colorectal cancer (CRC) is the third most prevalent cancer in the world. Although great progress has been made, the specific molecular mechanism remains unclear. This study aimed to explore the differentially expressed genes (DEGs) and underlying mechanisms of CRC using bioinformatics analysis. In this study, we identified a total of 1353 DEGs in the database of GSE113513, including 715 up- and 638 downregulated genes. Gene ontology analysis results showed that upregulated DEGs were significantly enriched in cell division, cell proliferation, and DNA replication. The downregulated DEGs were enriched in immune response, relation of cell growth and inflammatory response. The Kyoto Encyclopedia of Genes and Genomes pathway analysis showed that upregulated DEGs were enriched in cell cycle and p53 signaling pathway, whereas the downregulated DEGs were enriched in drug metabolism, metabolism of xenobiotics by cytochrome P450, and nitrogen metabolism. A total of 124 up-key genes and 35 down-key genes were identified from the protein–protein interaction networks. Furthermore, we identified five up-modules (up-A, up-B, up-C, up-D, and up-E) and three down-modules (d-A, d-B, and d-C) by module analysis. The module up-A was enriched in sister chromatid cohesion, cell division, and mitotic nuclear division. Pathways associated with cell cycle, progesterone-mediated oocyte maturation, oocyte meiosis, and p53 signaling pathway. Whereas the d-A was mainly enriched in G-protein coupled receptor signaling pathway, cell chemotaxis, and chemokine-mediated signaling pathway. The pathways enriched in chemokine signaling pathway, cytokine–cytokine receptor interaction, and alcoholism. These key genes and pathways might be used as molecular targets and diagnostic biomarkers for the treatment of CRC.
1. Introduction
Colorectal cancer (CRC) is the third most common cancer and the second leading cause of cancer-related death in the world. Over 1.8 million new CRC cases and 881,000 deaths are estimated to occur in 2018, accounting for about 1 in 10 cancer cases and deaths (Bray et al., 2018). Although colonoscopy has made great achievements in the diagnosis and treatment of early CRC, there is still a low rate of early CRC diagnosis, advanced CRC is extremely difficult to treat, and the prognosis of the patients is poor. The survival rate of advanced CRC is still <10% (Ciani et al., 2015; Moriarity et al., 2016). Therefore, it is urgent to investigate potential mechanisms and the targets to provide new ideas and indicators for clinical diagnosis and treatment of CRC.
The risk factors of CRC include smoking, obesity, alcohol, older age, high-fat intake, and lack of physical exercise (Zauber et al., 2012). Increasing evidence has indicated that the occurrence and development of CRC are a complex biological process (BP), which involves the abnormal expression of multiple genes and the functional changes of multiple pathways. It is known that the level of CLC was correlated with eosinophil density in inflammation and IFNAR1 was associated with oncogenesis. Ågesen et al. identified that CLC and IFNAR1 are associated with early onset CRC and provided additional support to the importance of the discriminated genes in the development of CRC within a genetic susceptibility context (Agesen et al., 2011). In the exon level study, Aziz et al. (2014) reported that ATP8B1 was a novel target for CRC. Xu et al. (2014) found that microRNA-375 was matched in CRC and associated with some critical signal pathways, such as Wnt, MAPK, and TGF-β. Although great progress have been made, the molecular mechanisms of CRC are far from been fully understood.
Analysis of abnormal genes and their biological pathways at genomic level can provide a more comprehensive understanding of key functional genes and their core mechanisms in CRC. Recently, gene expression profile data associated with CRC have been studied by many researchers. Jun Peng et al. constructed the microarray data of GSE113513, and identified the differentially expressed genes (DEGs) between 14 CRC tissues and 14 matched adjacent normal tissues by using the affymetrix human GeneChip primeview array. However, they did not perform further study of DEGs, such as the construction of a protein–protein interaction (PPI) network and module analysis of the PPI network.
In this study, we download the database of GEO113513 and identified the DEGs by comparing RNA expression from 14 CRC tissues and 14 matched adjacent normal tissues. Based on the DEGs, the gene ontology (GO) analysis and Kyoto Encyclopedia of Genes and Genomes (KEGG) pathways enrichment analyses were applied, and the PPI network and module were also constructed. In addition, we reanalyze the GO analysis and KEGG enrichment pathways of the module of PPI network. The findings of this study may provide new insights into CRC diagnosis and treatment.
2. Materials and Methods
2.1. Data sets
The gene expression omnibus (GEO) is a public functional genomics data repository, which is freely available for users (Barrett et al., 2013). The GSE113513 gene expression profiles were downloaded from the GEO database. This data set was deposited by Jun Peng et al., which is based on the Affymetrix GPL15207 platform and has 28 samples, including 14 CRC tissues and 14 matched adjacent normal tissues.
2.2. Data processing
We used the packages of R statistical software to analyze the gene expression profile. The original CEL file data of the GSE113513 were processed into expression estimates, and background adjustment, normalization, and log transformation of the values were analyzed by affy package (Gautier et al., 2004). The probe-level data was transformed and matched with the gene symbols; when several probes correspond to one gene symbol, the gene expression value was the mean of the probes. The missing values of the genes were supplemented using the K-Nearest Neighbor. Furthermore, the LIMMA package was used to identify DEGs between CRC and matched adjacent normal tissues. The log2-fold change (log2FC) was calculated. We selected DEGs with |log2FC| > 1 and p < 0.05 in microarray data for further analysis. Then, we constructed heatmap and volcano for DEGs using the packages in R software.
2.3. GO and pathway enrichment analysis of DEGs
GO analysis is a common genes analysis method, which can provide functional classification for genomic data, including categories of BPs, cellular component (CC), and molecular function (MF) (Ashburner et al., 2000). The KEGG database is a knowledge bioinformatics resource for systematic analysis, annotation, and visualization of gene functions (Du et al., 2014). The Database for Annotation, Visualization and Integrated Discovery (DAVID) is an online tool for gene functional classification, which can systematic and integrative analysis of large gene lists (Huang da et al., 2009). In this study, to analyze the functions of DEGs, GO enrichment and KEGG pathway analysis were conducted using the DAVID online tool; p < 0.01 was set as the cutoff point.
2.4. Integration of PPI network and key genes identification analysis
The Search Tool for the Retrieval of Interacting Genes (STRING) is a biological database designed to predict PPI information (von Mering et al., 2003). The DEGs were mapped to STRING to evaluate the interactive relationships, with a confidence score >0.9 defined as significant. Then, we use Cytoscape, a biological graph visualization tool for integrated models of biologic molecular interaction networks software, to construct PPI networks (Smoot et al., 2011). The key genes were identified with a connectivity degree >10.
2.5. Module analysis of the PPI network
The Molecular Complex Detection (MCODE), a plugin for Cytoscape, was used to screen the modules of the PPI network. The criteria were set as follows: degree cutoff = 2, node score cutoff = 0.2, k-core = 2, and maximum depth = 100 (Rhrissorrakrai and Gunsalus, 2011). Moreover, the biological function and pathway enrichment analysis were performed for key genes in the modules.
3. Result
3.1. Identification of DEGs
The raw data and the annotation information of the GSE113513 were downloaded from GEO database. Based on the LIMMA package analysis, a total of 1353 DEGs between 14 CRC samples and 14 matched adjacent normal samples were identified, of which 715 were upregulated and 638 were downregulated.
3.2. GO function enrichment analysis
To further investigate the functions of identified DEGs, all DEGs were uploaded in the DAVID software to analyze the GO categories and KEGG pathways. GO function result showed that the upregulated DEGs were markedly enriched in 22 terms and the downregulated DEGs were enriched in 14 terms. Among them, the upregulated DEGs were mainly enriched in nucleolus and nucleoplasm in CC, and the downregulated DEGs were markedly enriched in extracellular exosome, extracellular matrix, and proteinaceous extracellular matrix. GO BP analysis showed that upregulated DEGs were enriched in cell division, DNA replication, and cell proliferation, the downregulated DEGs were enriched in inflammatory response, immune response, and regulation of cell growth. For MF, the upregulated DEGs were mostly enriched in protein and poly(A) RNA binding, and downregulated DEGs were enriched in heparin and receptor binding. The top 10 GO terms in each are shown in Table 1 (all p < 0.02).
Gene Ontology Analysis of Differentially Expressed Genes Associated with Colorectal Cancer
Category: GO function; count, the no. of DEGs; The p-value was adjusted with the Benjamini–Hochberg method.
BP, biological process; CC, cellular component; DEG, differentially expressed gene; GO, gene ontology; MF, molecular function.
3.3. KEGG pathway analysis
We performed pathway enrichment analysis using the KEGG analysis of DAVID. The results showed that the upregulated DEGs were mainly enriched in nine KEGG pathways, including cell cycle, ribosome biogenesis in eukaryotes, p53 signaling pathway, and progesterone-mediated oocyte maturation, whereas the downregulated DEGs were enriched in mineral absorption, complement, and coagulation cascades, cytokine–cytokine receptor interaction, nitrogen metabolism, and the drug metabolism of cytochrome P450 (all p < 0.01). The top five enriched KEGG pathways in each are shown in Table 2.
The Top Five Enriched Kyoto Encyclopedia of Genes and Genomes Pathways in Upregulated Differentially Expressed Genes and Downregulated Differentially Expressed Genes
Category: KEGG pathway; Term: Homo sapiens; Count, the no. of DEGs.
KEGG, Kyoto Encyclopedia of Genes and Genomes.
3.4. PPI network construction and hub gene identification
After the upregulated and downregulated DEGs were submitted into STRING, a total of 1657 upregulated and 470 downregulated PPI relationships were obtained. Then, the key genes in the networks with connectivity degree >10 were identified. A total of 124 key genes were selected from the upregulated PPI network, which included CDK1, CCNB1, and CCNB2. Meanwhile, 35 key genes, such as KNG1, GNG8, and GNG7, were identified from the downregulated PPI network. The top 20 key genes in each are shown in Table 3.
The Top 20 Differentially Expressed Key Genes in the Upregulated and Downregulated Protein–Protein Interaction Network
Degree: the connectivity of the protein.
3.5. Module analysis
Five modules with MCODE score ≥4 and nodes ≥6 were selected in the upregulated PPI networks: up-A (MCODE score = 20) with 20 nodes, up-B (MCODE score = 15,128) with 40 nodes, up-C (MCODE score = 8.222) with 10 nodes, up-D (MCODE score = 6) with 13 nodes, and up-E (MCODE score = 5.833) with 13 nodes (Fig. 1). Meanwhile, there are three modules in the downregulated PPI network: d-A (MCODE score = 20) with 20 nodes, d-B (MCODE score = 10) with 10 nodes, and d-C (MCODE score = 5.6) with 6 nodes. The top one module in each is shown in Figure 2.
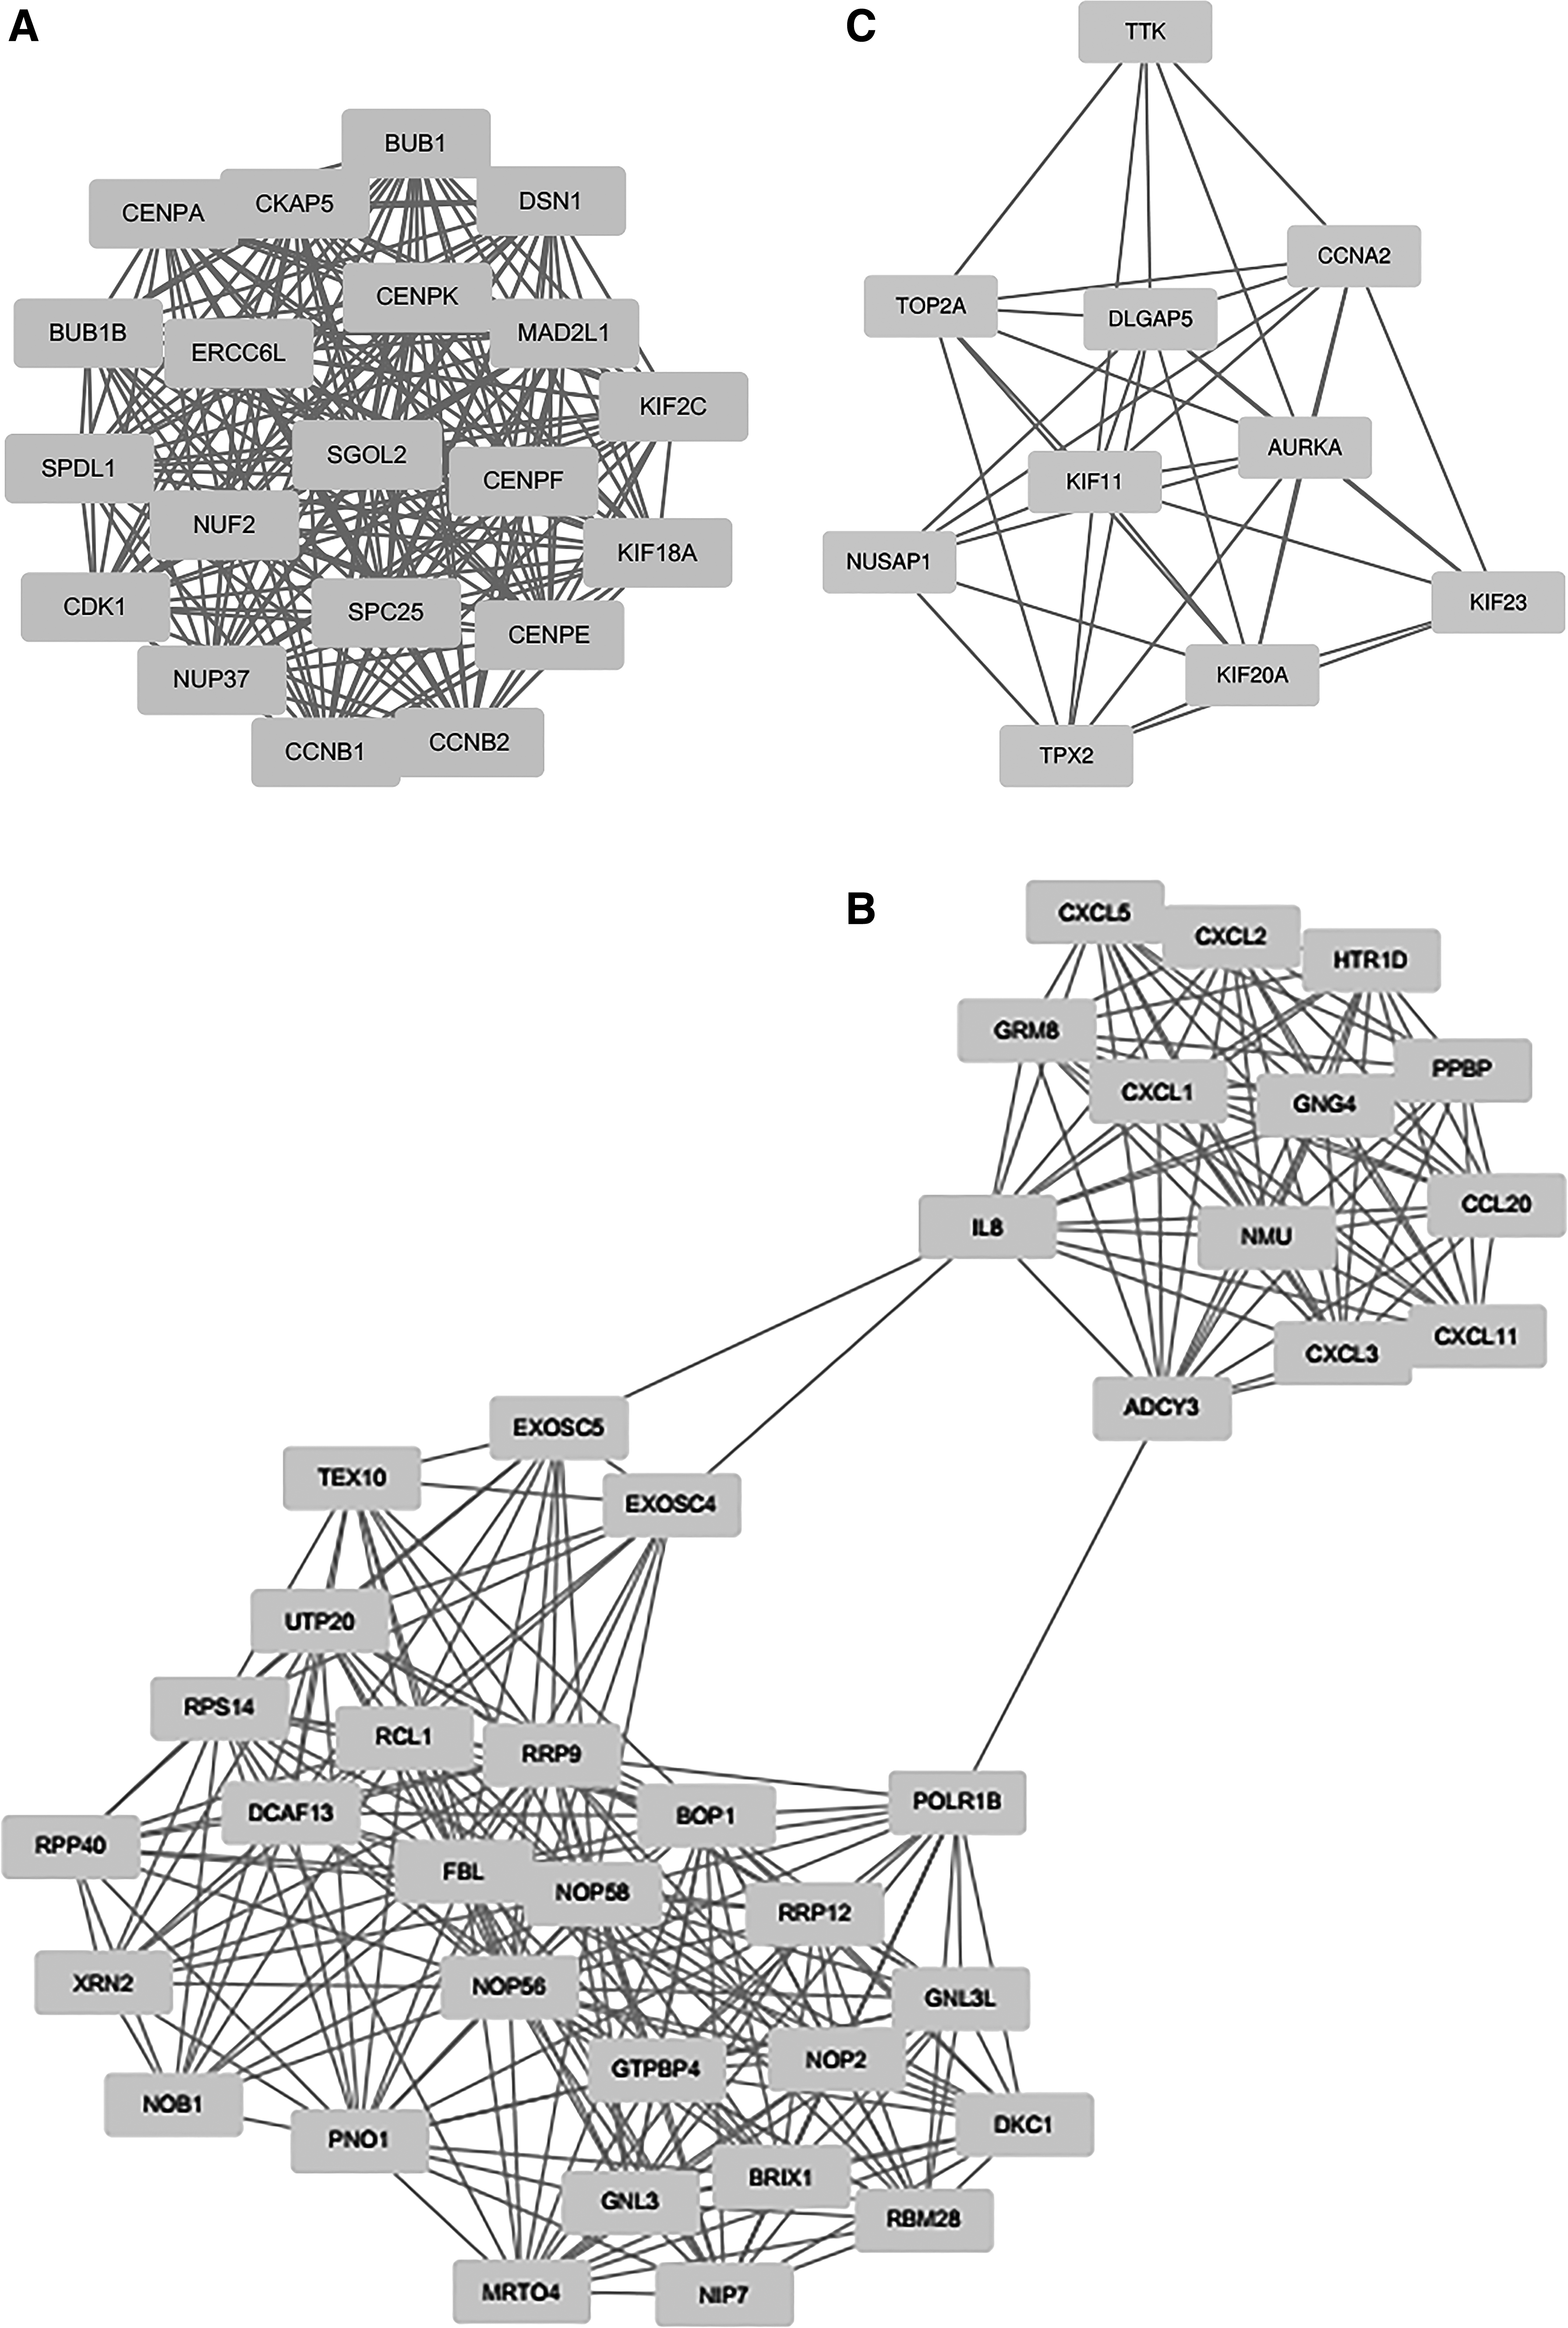
Upregulated PPI network with MCODE score ≥4 and node ≥6. PPI, protein–protein interaction.
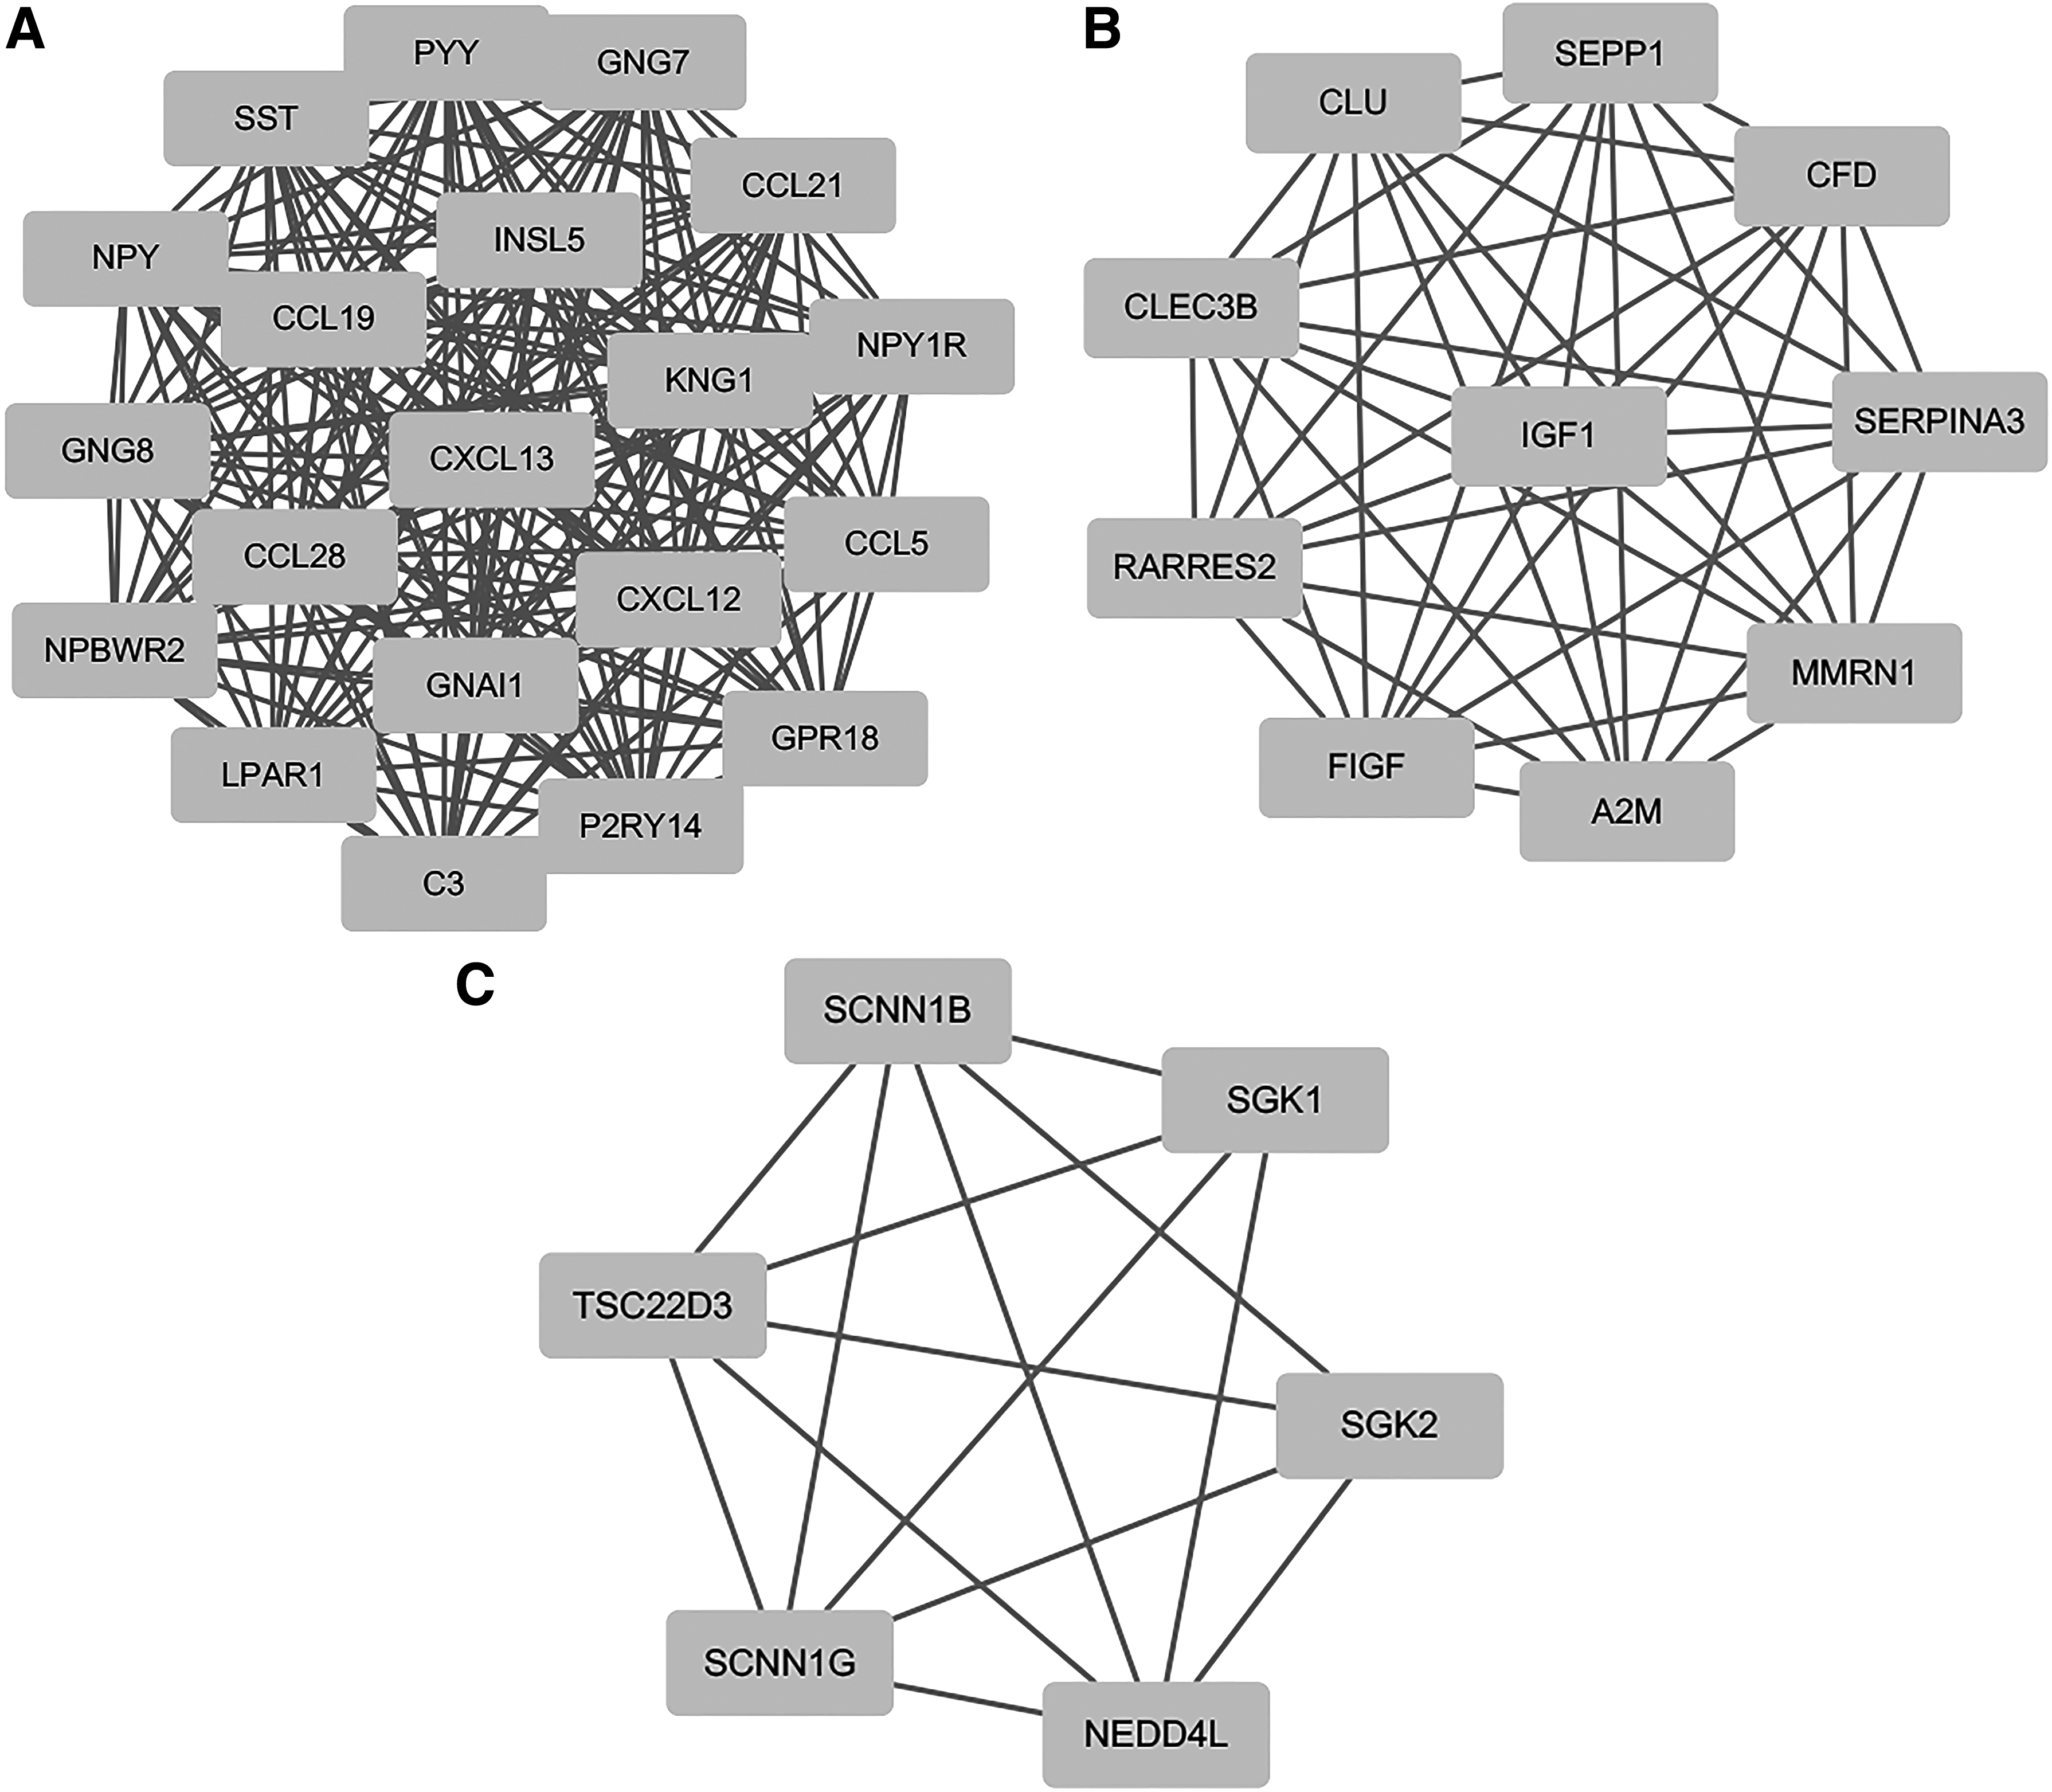
Downregulated PPI network with MCODE score ≥4 and node ≥6.
The GO functional enrichment scores of modules up-A were mainly enriched in sister chromatid cohesion, cell division, mitotic nuclear division, and mitotic nuclear division; module d-A was enriched in G-protein coupled receptor signaling pathway, cell chemotaxis, chemokine-mediated signaling pathway, inflammatory response, and immune response (Table 4). In addition, the KEGG pathway analysis revealed that the DEGs in module up-A were markedly enriched in cell cycle, progesterone-mediated oocyte maturation, oocyte meiosis, and p53 signaling pathway; the DEGs in module d-A were significantly enriched in pathways including chemokine signaling pathway, cytokine–cytokine receptor interaction, alcoholism, and the regulation of lipolysis in adipocytes (Table 5).
The Gene Ontology Functional Enrichment Analysis of Differentially Expressed Genes in the up-A and down-A Modules
Category: GO function; ; Count, the no. of DEGs. The p-value was adjusted with the Benjamini–Hochberg method.
The Kyoto Encyclopedia of Genes and Genomes Pathways Analysis of Differentially Expressed Genes in the Upregulated-A and Downregulated-A Modules with the Threshold of p < 0.01
Category: KEGG pathway; Term: Homo sapiens; Count: the no. of DEGs.
4. Discussion
In this study, we applied a bioinformatics approach to investigate the DEGs in patients with CRC tissues and matched adjacent normal tissues. Based on DEGs data, the molecular mechanism of CRC was identified by DEGs gene ontology and pathway enrichment analysis and PPI network construction. Then we identified the key functional genes and investigated the core module using functional and enrichment analysis. These results are strong supplement for further understanding of CRC diagnosis and treatment.
Our DEGs screening results identified 1353 DEGs between 14 CRC samples and 14 matched adjacent normal samples, which included 715 upregulated and 638 downregulated DEGs. These upregulated DEGs were obviously enriched in cell proliferation and protein and poly(A) RNA binding, whereas the downregulated DEGs were enriched in inflammatory response, immune response, and regulation of cell growth. All these are compatible with the important mechanism of cancer occurrence and development (Diakos et al., 2014; Kolch et al., 2015; Chiou and Burotto, 2015; Chung et al., 2016; Fridman et al., 2017; Hojman, 2017).
KEGG pathway enrichment analysis of upregulated DEGs identified a total of 21 pathways, including cell cycle, ribosome biogenesis in eukaryotes, p53 signaling pathway, and homologous recombination. Disruptions of the cell cycle have been well documented to be involved in the genesis and propagation of a variety of cancers. In addition, several aberrations in the cell cycle checkpoints have been shown to have prognostic significance in CRC (McKay et al., 2002; Santamaria and Ortega, 2006; Solier et al., 2012; Balakrishnan et al., 2016). Iacopetta et al. revealed that p53 mutations that lose transactivational ability are more common in advanced CRC and associated with poor survival (Iacopetta et al., 2006). Meanwhile, the impaired ribosome biogenesis is also to be considered a risk factor for cancer initiation (Goudarzi and Lindstrom, 2016).
In addition, the downregulated DEGs pathway enrichment analysis identified 25 pathways, such as complement and coagulation cascades, nitrogen metabolism, and cytochrome P450 of drug metabolism. In agreement with our study, after upregulation of complement C3a receptor on neutrophils and activation of the complement cascade by increasing circulating lipopolysaccharide, Guglietta et al. (2016) revealed that tumorigenesis is associated with coagulation, neutrophilia, and complement activation. In liver cancer study, the aberrant expression of urea cycle enzymes was found to maximize the use of nitrogen and carbon for the anabolic synthesis of macromolecules that are required during tumor proliferation and growth (Keshet et al., 2018). Several cytochrome P450s may act as independent markers of CRC prognosis (Kumarakulasingham et al., 2005).
Our PPI network analysis constructed with DEGs identified key genes including CDK1, FBL, CIRH1A, KIF2C, TOP2A, KNG1, LPAR1, GNG7, CCL5, and GNAI1. In addition, a modular analysis of the PPI network indicates that the CRC is primarily associated with eight core modules, including five upregulated cores and three downregulated cores. Based on these results, we further explored the biological function and pathway enrichment for up-A and d-A modules. The up-A results showed that CRC was associated with sister chromatid condensation, cell division, mitotic nuclear division, and mitotic midplate sessions. The d-A module shows that CRC is involved in G protein-coupled receptor signaling pathways, cell chemotaxis, chemokine-mediated signaling pathways, inflammatory responses, immune responses, and negative regulation of leukocyte binding or rolling.
Through literature mining of those key genes in up-A module, we have found that a large number of studies on the CDK family including CDK1 are closely related to the development of CRC (He et al., 2018.). Small nucleolar RNAs are emerging as a novel class of proto-oncogenes and tumor suppressors. Nucleolar protein 5A (NOP56), nucleolar protein 5 (NOP58), and fibrillarin (FBL) as the three core proteins of box C/D small nucleolar ribonucleoprotein complexes play an essential role in ribosome assembly. Qin et al. (2017) reported that FBL regulated rRNA methylation patterns and promoted tumorigenesis. However, their involvement in tumorigenesis remains unclear. The other two key genes of CIRH1A and KIF2C were reported that significantly overexpressed in CRC. Gnjatic et al. reported that KIF2C induces frequent T cell response in patients with CRC (Gnjatic et al., 2010; Guo et al., 2017). Another key gene, TOP2A, functions as the target for several anticancer agents, and a variety of mutations in this gene have been associated with the development of drug resistance. In CRC, increased topoisomerase IIalpha expression is associated with advanced disease and chemotherapeutic resistance through inhibition of apoptosis (Coss et al., 2009).
The other five hub genes are KNG1, LPAR1, GNG7, CCL5, and GNAI1. It has been found that KNG1 was shown to be a potential serum predictor of advanced colorectal adenoma and cancer (Wang et al., 2013). Florence Quesada-Calvo et al. also reported that OLFM4 and KNG1 are abnormally expressed in CRC tissues, especially in early pTNM CRC stages. This could also be observed but more moderately in precancerous lesions. Further studies on these proteins are warranted to better understand these roles in CRC progression and their potential as early diagnostic tools (Quesada-Calvo et al., 2017). LPAR1 was reported to regulate cell proliferation, survival, angiogenesis, or migration (Wei et al., 2013). Further studies are needed to determine the role of LPAR1 in CRC. For GNAI1, G protein subunit alpha i1, which participates in many physiological processes, including adhesion, proliferation, and differentiation, however, the biological functions of GNAI1 in CRC remain unclear (Foley et al., 2010). Another key gene, GNG7, belongs to a family of large G-proteins that may be involved in cell-contact-induced growth arrest and function in tumor suppression. GNG7 was downregulated in gastrointestinal cancer, and GNG7 suppression represents a new prognostic indicator in cases of esophageal cancer (Ohta et al., 2008), To date, the biological functions of GNG7 in CRC remain unclear.
After biological functions and pathway enrichment analysis, the up-A results showed that upregulated key genes were associated with cell cycle and cell division, which play an essential role in proliferation and growth in CRC. The d-A module shows that downregulated key genes were involved in G protein-coupled receptor signaling pathways, cell chemotaxis, chemokine-mediated signaling pathways, inflammatory responses, immune responses, and negative regulation of leukocyte binding or rolling. These pathways were associated with the processes in the prognosis and treatment of CRC. To investigate the detailed mechanism, further studies are needed to be verified.
In conclusion, our study is based on the study of Jun Peng et al., which lays the foundation for further research on the underlying molecular mechanisms of CRC. These findings identified the key genes and pathways of CRC. However, this study also has some limitations, such as the lack of experiments and small number of samples. Therefore, further experimental studies based on our findings are needed.
Footnotes
Acknowledgment
We thank Dr. Tianmin Zhou for his technical assistance.
Author Disclosure Statement
The authors declare there are no competing financial interests.