
Abstract
Abstract
The employment of machine learning (ML) approaches to extract gene expression information from microarray studies has increased in the past years, specially on cancer-related works. However, despite this continuous interest in applying ML in cancer biomedical research, there are no curated repositories focused only on providing quality data sets exclusively for benchmarking and testing of such techniques for cancer research. Thus, in this work, we present the Curated Microarray Database (CuMiDa), a database composed of 78 handpicked microarray data sets for Homo sapiens that were carefully examined from more than 30,000 microarray experiments from the Gene Expression Omnibus using a rigorous filtering criteria. All data sets were individually submitted to background correction, normalization, sample quality analysis and were manually edited to eliminate erroneous probes. All data sets were tested using principal component analysis (PCA) and t-distributed stochastic neighbor embedding (t-SNE) analyses to observe sample division and were additionally tested using various ML approaches to provide a base accuracy for the major techniques employed for microarray data sets. CuMiDa is a database created solely for benchmarking and testing of ML approaches applied to cancer research.
1. Introduction
Microarray is a molecular biology technique in which tens of thousands of probes representing a given DNA sequence are analyzed and quantified to provide a general gene expression profile of multiple biological samples (Epstein and Butow, 2000; Blohm and Guiseppi-Elie, 2001; Blalock, 2003). The resulting output of a microarray experiment is a two-dimensional (2D) matrix with genes as rows and samples as columns (usually coming from different conditions). Each cell in the matrix is a real number indicating how much a gene is expressed in a sample. These expression matrices will usually have thousands of rows and dozens or hundreds of columns (Ressom et al., 2009).
In the last decade, the ongoing availability of microarray data sets became one of the most available sources of large-scale transcriptomic biological data, propelling Bioinformatics studies and increasing our knowledge of biological functions and diseases (Tao et al., 2017). Nevertheless, despite the diversity of microarray studies, the continuous improvement of platform technologies, and the broad selection of analysis tools, the identification of expression patterns is still a major challenge (Walsh et al., 2015), specially in diseases, such as cancer. According to the World Health Organization (WHO), cancer is the second leading cause of death globally,* and understanding the molecular pathways underlying the tumoral process is a challenge yet to be overcome, especially due to its heterogeneous nature, as observed in different cancer types (Shen et al., 2016; Hardiman, 2018; Ho et al., 2018; Joseph et al., 2018). Hence, continuous efforts must be made to understand the expression patterns of different cancer types.
Among the many techniques available to analyze microarrays, machine learning (ML) is being heavily employed for gene selection and classification of expression data sets, as well as information discovery. Moreover, cancer data have become a frequently used benchmark for new ML algorithms, appearing even in pure computational research (Tong and Mintram, 2010). The popularization of industrialized microarray chips can be traced back to 1995 (Schena et al., 1995), and the application of ML for such techniques is as old as 1999 when Golub et al. (1999) designed a class discovery procedure for leukemia and Alon et al. (1999) used a clustering algorithm for analyzing tumor and normal colon tissues. Since then, the use of microarray data in ML and Bioinformatics became commonplace.
Microarray data can be used in multiple ML tasks, for both computational and biological studies. Under supervised learning, it can be used to train classifiers able to predict different conditions and help with diagnostics. Several algorithms had their efficacy tested for this task, such as artificial neural networks, support vector machine (SVM), k-nearest neighbors (k-NN), and random forest (RF) (Peterson et al., 2005; Díaz-Uriarte and De Andres, 2006; Pirooznia et al., 2008; Statnikov et al., 2008). There is no clear consensus in which algorithm is superior (Allison et al., 2006), but some studies point to SVMs and RF as the stronger contends (Lee et al., 2005; Pirooznia et al., 2008; Statnikov et al., 2008).
Another use of ML on microarray data is the clustering algorithms. By autonomously grouping samples by their genes expression according to some similarity criteria, clustering methods can help with knowledge discovery and biological inference about that set of genes or samples (Whitworth, 2010). The review of Thalamuthu et al. (2006) and the case study of Dash and Misra (2018) compare some of these methods in microarray analysis. The work of Oyelade et al. (2016) also brings descriptions of the clustering methods and insights on how to better choose and use them for microarray data.
The employment of feature extraction and feature selection methods on gene expression data is also common for dimensionality reduction, data visualization, as a preprocessing step for other algorithms, or to find a subset of more relevant genes. Lazar et al. (2012) and Ang et al. (2016) bring extensive reviews on this subject.
Despite the ongoing employment of ML for cancer research, there is an increasing difficulty in finding new databases providing a proper benchmark of microarray data sets, focused on cancer, to be used as a matter of comparison or testing of ML approaches. As a matter of fact, the proper use and creation of benchmarks for comparing the result of new tools, and the correct employment of such metrics was recently discussed as being fundamental for the advancement of Bioinformatics in general (Peters et al., 2018). The current scenario is that there are specific supplementary files from different works where one may find available data sets to test or benchmark ML studies focused on cancer research, but they are majorly scattered through personal, academic, and public repositories. According to a recent review by Ang et al. (2016) on gene selection methods published between the years of 2010 and 2016, the five most used cancer microarray expression data sets in the literature were leukemia (Golub et al., 1999), colon (Alon et al., 1999), prostate (Singh et al., 2002), diffuse large B cell lymphoma (DLBCL) (Alizadeh et al., 2000), and small round blue cell tumor (SRBCT) of childhood data sets (Khan et al., 2001). As it can be seen, all of them were relatively old, the most recent being published in 2002.
One aspect that must be observed is that, overall, each author designs their own pipeline and algorithm to treat the raw data derived from the microarray experiment. Even new works usually employ data sets already created by other authors, sometimes from decades ago (Alon et al., 1999; Golub et al., 1999; Alizadeh et al., 2000; Khan et al., 2001; Singh et al., 2002; Ang et al., 2016). Additionally, input quality can strongly influence the precision of the biological results in an ML context. In this sense, raw data contain inherent noise from the hybridization and manipulation steps of the microarray analysis that can strongly influence the final results (Kauffmann and Huber, 2010; Owzar et al., 2011). In addition, one must be careful of how raw data are manipulated before the ML pipeline, and a classical biological approach might be the most adequate way to treat these data sets than personalized raw data treatment.
Here, we present the Curated Microarray Database (CuMiDa), a repository of 13 different types of cancer. CuMiDa is an extensively curated database, where more than 30,000 studies of the Gene Expression Omnibus (GEO) database were individually explored through a rigorous filtering criteria. In this sense, CuMiDa is composed of 78 handpicked data sets that were submitted to normalization, background correction, sample viability, sample quality analysis, and personalized editing to provide reliable data sets to be employed in ML studies for either testing or benchmarking.
2. Materials and Methods
2.1. Microarray data sets obtainment
To obtain multiple microarray data sets [GEO Series (GSEs)], data of multiple subtypes of colorectal, gastric, pancreatic, liver, bladder, lung, throat, renal, brain, prostate, ovary, leukemia, and breast cancers were downloaded from GEO database using the GEOquery package (Davis and Meltzer, 2007) for the R platform. † All the following criteria were applied to select the most reliable data sets: (1) selection of studies that did not apply chemotherapics, did not conduct gene therapies of any kind, and did not employ interfering molecules, such as miRNA, siRNA, and so on; (2) studies performed only on Homo sapiens; (3) microarrays that did not use any form of knockdown cultures or induced mutations; (4) data sets that contained at least six samples per condition; (5) studies with clear description of the protocols used in the experiments; (6) studies that did not use any kind of xenograft technique; and (7) studies that made their raw data available.
The final list of data sets was composed of different platforms from Illumina, Agilent, and Affymetrix companies. In the end, more than 30,000 studies available at GEO were individually opened and carefully inspected and manually curated, and 78 microarray data sets were handpicked, including single and dual channel. Among the 78 chosen data sets, if any sample still matched the previous criteria, they were manually excluded before preprocessing. Samples that displayed errors, such as irreparable misformating, or corruption (i.e., cannot even be read by the R package) were also manually excluded. Additionally, the GEO platform information (GPL) containing the full information of the probe set was obtained and is provided alongside the data sets.
2.2. Microarray data sets processing
After data obtainment, quality, background correction, and normalization of the 78 selected GSEs were performed in R. We employed the packages: (1) affy (Gautier et al., 2004) for Affymetrix data sets; (2) lumi (Du et al., 2008), beadarray (Dunning et al., 2007), and illuminaio (Smith et al., 2013) for Illumina microarrays; and (3) the package limma (Ritchie et al., 2015) for Agilent and other platforms, when needed. The package Biobase (Huber et al., 2015) was employed in multiple occasions for information of biological data. After normalization, all data sets were analyzed by the R package arrayQualityMetrics (Kauffmann et al., 2009) to access the sample quality of the selected microarrays. Samples that displayed low quality in at least half of any parameters measured by arrayQualityMetrics were discarded. Each final normalized matrix was then manually curated to remove unwanted probes that are not related in any way to nucleic acid sequences.
2.3. Data set generation for ML
The final expression matrices, containing the list of probes with background correction, normalization, and the samples approved by the quality analysis, were converted to the formats .arff, ‡ .csv, .tab, and .gct § and .cls,** which are common file formats for data mining and ML techniques. In this sense, Attribute-Relation File Format (.arff) is the default extension file to be employed in the Waikato Environment for Knowledge Analysis (WEKA) program (Frank et al., 2016), whereas Comma-Separated Values (.csv) and Tabular (.tab) are regular table file formats, readable by multiple programs, including Microsoft®Excel and the R programming language, but .tab can also be opened in the Orange Datamining tool for ML testing. †† Finally, .gct and .cls are file formats for the GenePattern platform for reproducible Bioinformatics (Reich et al., 2006). Thus, files for several computational and biological platforms are available from the start, without the need of parsers, preprocessing, or conversion.
2.4. ML methods for benchmarking comparison
Values of threefold cross-validation accuracy were generated by different ML approaches employed for each data set using the WEKA program. The classification algorithms used were (1) SVMs, (2) decision trees (DT), (3) RF, (4) Naive Bayes (NB), (5) multilayer perceptron (MLP) with a single hidden layer with 10 neurons, and (6) k-NN. The ZeroR classifier, which provides a classification baseline, was also employed. In addition, the following clustering algorithms were tested: (1) k-means (k-M) and (2) Hierarchical clustering (HC). Although all algorithms were tested using the default parameters provided by WEKA, their specifications and the command line which generated them are available inside each individual output in the database.
Two methods for dimensionality reduction and visualization, principal component analysis (PCA) and t-distributed stochastic neighbor embedding (t-SNE), were also applied to each data set, and the 2D charts were made available. These algorithms were implemented using the scikit-learn Python library (Pedregosa et al., 2011), with two components and default parameters. As recommended by Maaten and Hinton (2008), before using t-SNE we ran PCA over the original data. The methodological workflow can be found in Figure 1.

Summary of the methodological steps taken in this work. See main text for the full description of each step. See Section 2 for filtering criteria.
3. Results
3.1. Database overview and interface
CuMiDa contains 78 data sets, from which 73 are unique. Some studies performed the same experiments in different platforms; thus, in those particular cases, we divided the samples of each platform and treated them separately to avoid any bias. From the 78 microarrays, 5 are dual-channel and 73 are single-channel, where the single-channel ones contain 2 separate files: 1 containing the probes and the normalized expression values, and another one containing the classes. Due to the nature of dual-channel experiments, in which the expression values related to each sample are already a comparison between two distinct conditions, those data sets do not contain a separate class file and are not intended for classification methods. In contrast, they would be more suitable for clustering techniques. Taking into consideration the importance of the data set year of publishing, the oldest microarray studies available in CuMiDa are from 2007, whereas the newest are from 2017.
Each data set containing the probes provides the expression values derived from the processing step and was manually edited to remove probes that are not related to nucleic acids. Please note that each company has its own pattern for probe names. Moreover, each class files yield the number of classes and the names they contain are related to the different tissue types analyzed in their respective samples as they appear in the expression values file. Normal (control) samples were treated as one single class in some cases where they would not reach the minimum of six samples per class to be used as inputs in the ML protocol. This happened for GSE77953, GSE10797, and GSE89116.
In other cases, control classes were deleted because they also did not reach the minimum of six samples total, leaving only the cancer classes to be classified. This happened for GSE6008, GSE28427, GSE15824, and GSE59246. The late four, even after the exclusion of the normal (control) samples, still posses two or more classes. Finally, GSE15824, GSE7904, and GSE57297 had one or more classes (experimental) removed since it did not reach the minimum of six samples required. Nevertheless, these fusions or exclusions will not affect the utility of these microarrays or they biological meaning, as they still possess two or more classes to be classified. Moreover, by clicking on the GSE code, CuMiDa will redirect the user to its GSE page in GEO. Finally, by clicking in the platform button, the user can download the full GPL information regarding the data set. GPLs contain multiple probe information, such as Gene Symbol Ensembl code, full name, associated gene ontologies, and many others. We chose to provide the GPLs separated from the main data sets to avoid larger microarray files—thus, only the information requested by the user is selected.
From the main interface, the user can query for data sets based on: (1) the type of cancer, which comprises 13 different types; (2) order by crescent number of wanted samples, which ranges from 12 to 357; (3) order by crescent number of genes (features), which ranges from 12,621 to 54,676; (4) order by crescent number of classes, which ranges from 2 to 5; or (5) list all. The last option will simply list all 78 data sets in alphabetical order based on the cancer type. Regardless of the choice, the database will return the desired data sets and the information associated to it. In this sense, CuMiDa indicates the accuracy values of the different ML approaches tested for each data set: SVM, DT, k-NN, NB, RF, MLP, HC, and k-M (Fig. 2).
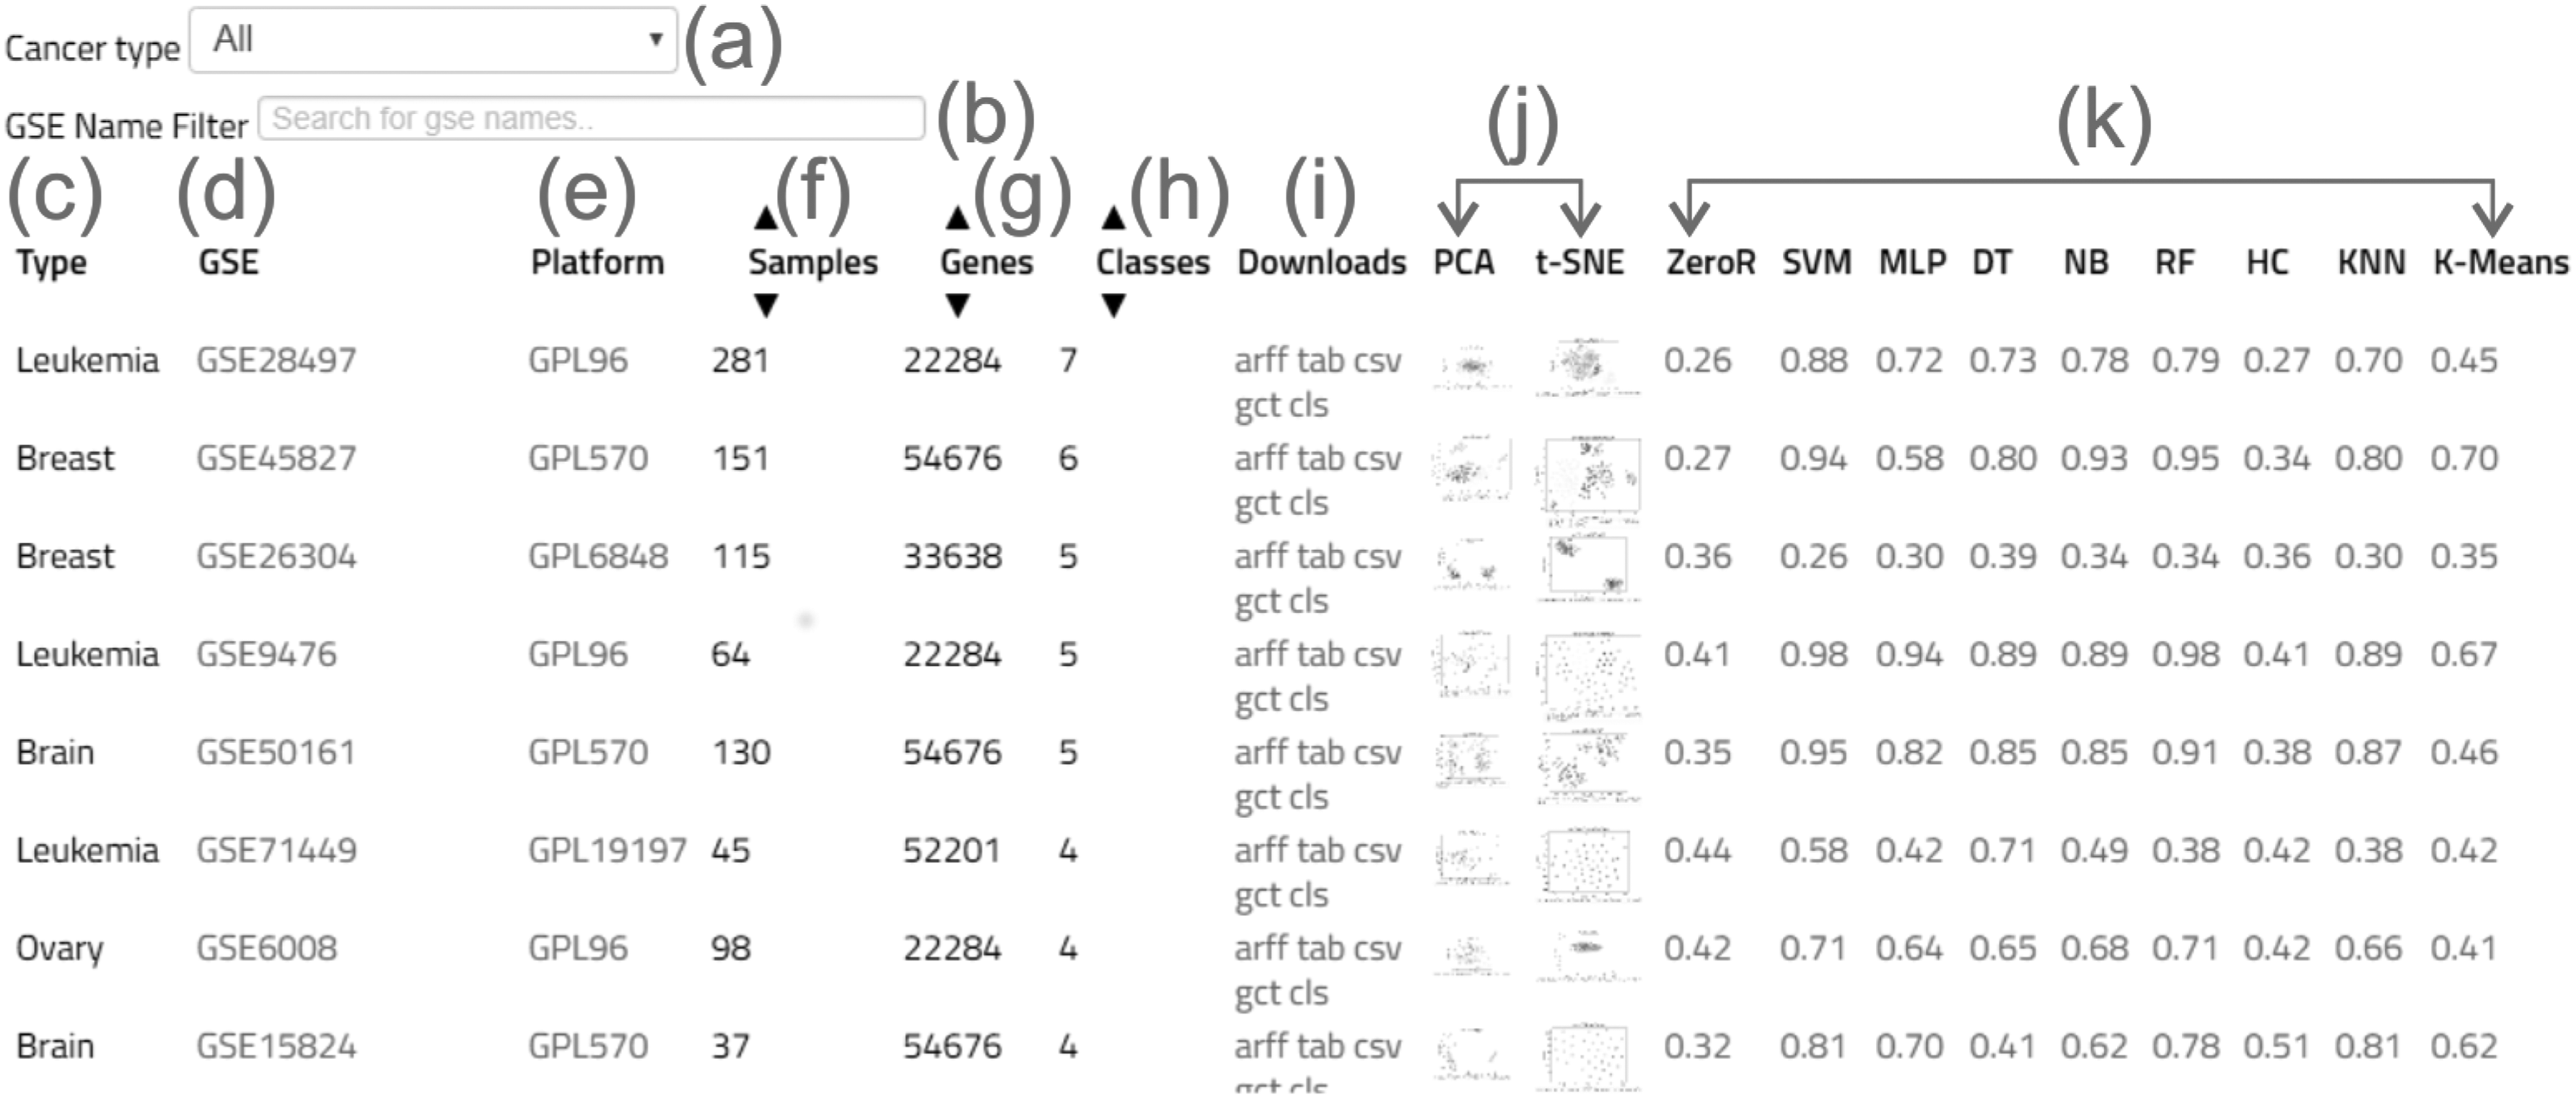
Overview of the CuMiDa database interface. The initial interface offers the following options:
CuMiDa offers the baseline and threefold cross-validation results for the most employed ML algorithms for microarray analysis, together with the WEKA output for each individual case. Thus, the user can download the full information regarding the WEKA analysis for each algorithm, for their respective GSE. These basic analyses were added to aid users in the comparisons between their own methods and default versions of the most popular ML approaches for microarray analysis. Additionally, the command lines employed to generate the WEKA analyses are available inside each file. All the threefold cross-validation accuracy results can also be found in Supplementary Table S1.
PCA and t-SNE charts in 2D are also provided (Fig. 3). Although these results are not a quality parameter, they show the default distribution of samples for each class. Tumoral cells, by nature, are heterogeneous (Shen et al., 2016; Hardiman, 2018; Joseph et al., 2018) and difficult to be clearly separated among themselves and, sometimes, even from the normal tissue. Thus, it is important to previously know the default distribution, before applying any ML approach to a given data set, to compare future results. In a nutshell, the expected results are better distributed samples.
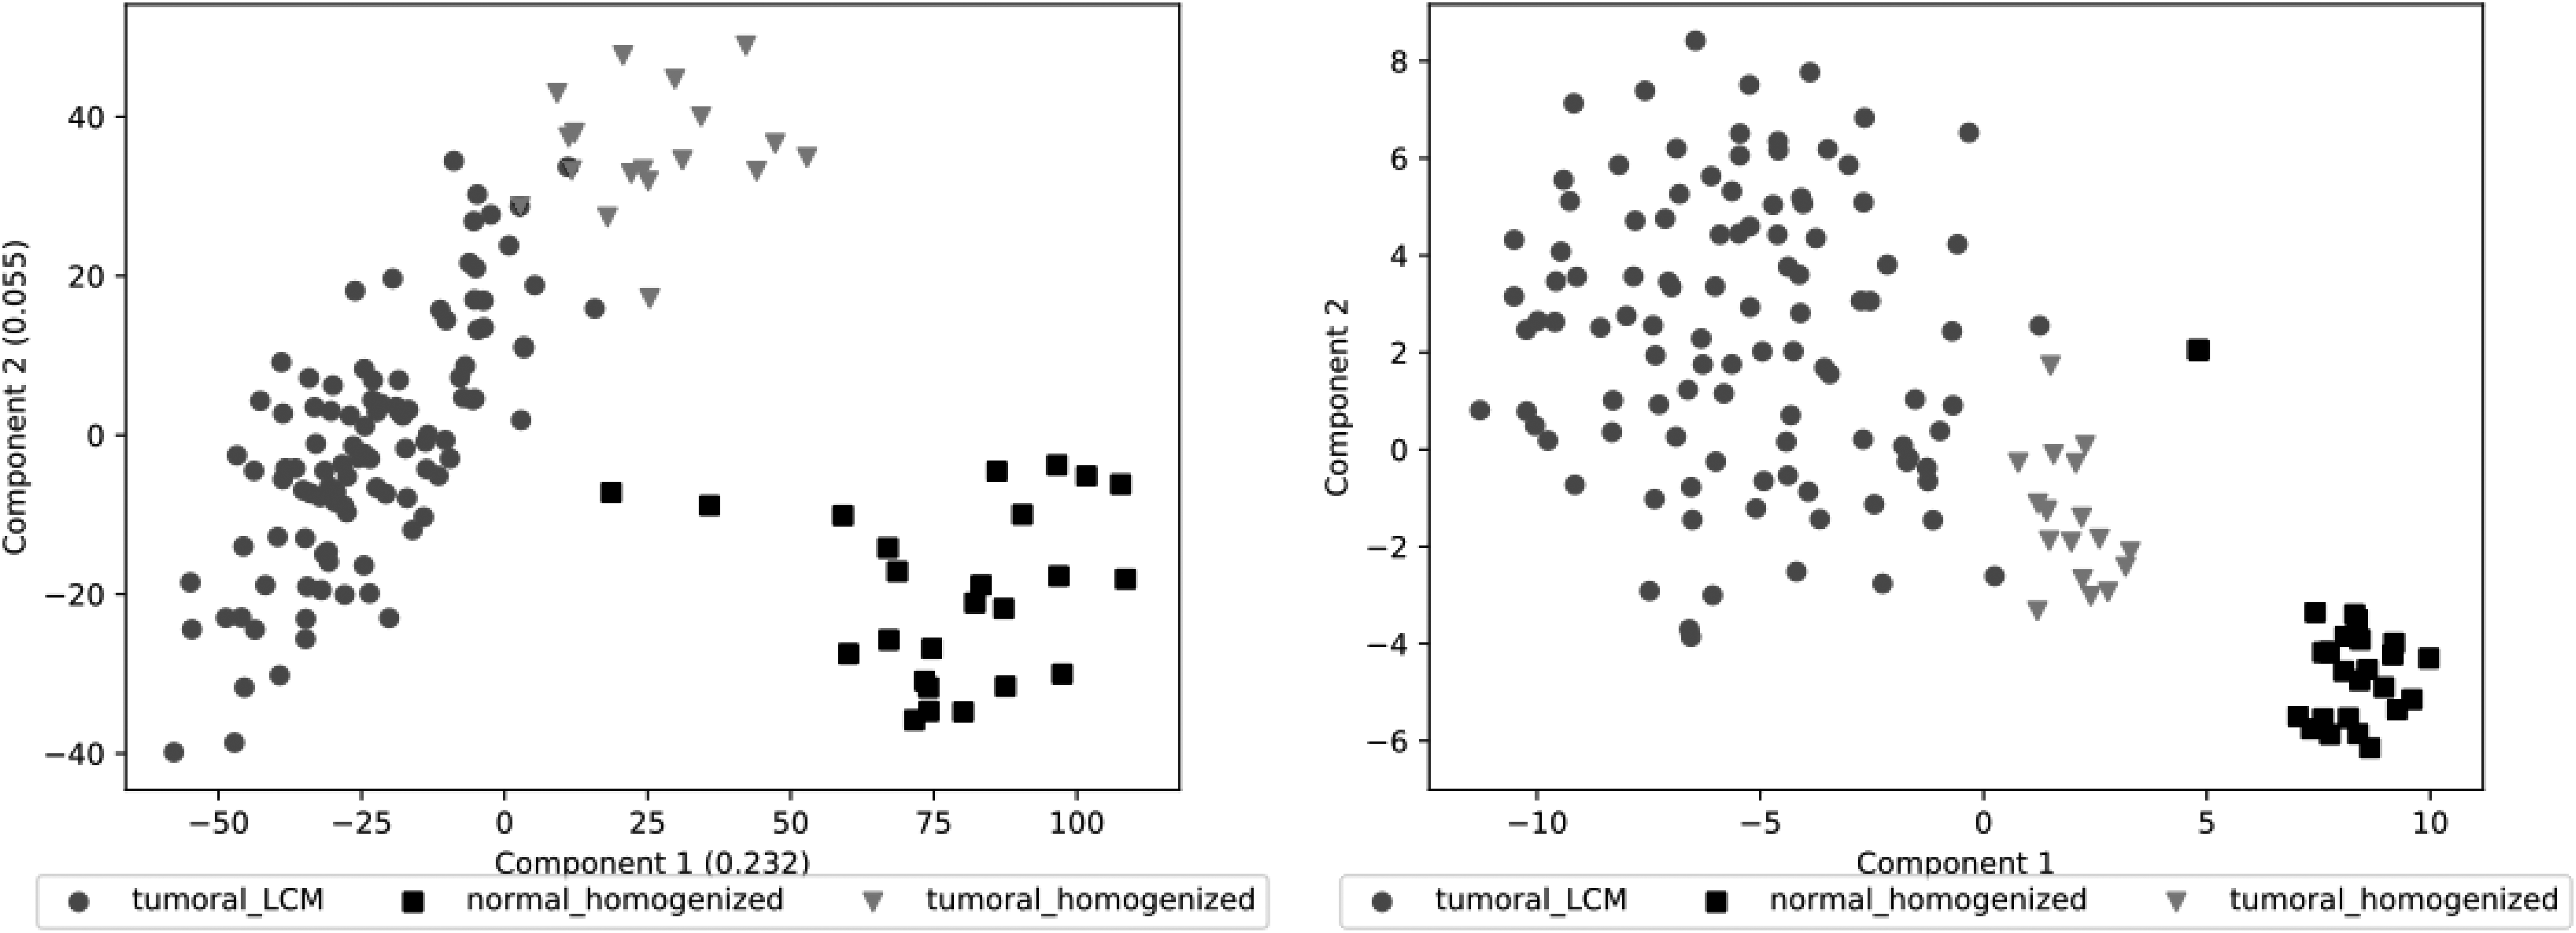
PCA and t-SNE examples from GSE21510 from colorectal cancer. This data set contains 147 samples (1 excluded), 54,675 dimensions, and 3 classes: 1 from normal tissue and 2 from tumoral tissues. The axes of the PCA include the percentage of the original information represented by the components.
4. Comparison to Other Databases: Why is Cu mi da Different?
In this section, we will compare databases in which their purpose can be associated to CuMiDa. However, please note that we are only listing databases that possess similar characteristics or that can, in some level, be compared with CuMiDa (Table 1). There are other curated databases focused on microarray data. For example, inSilicodb (Taminau et al., 2011), an R package, is a curated microarray database containing 86,104 Affymetrix data sets. There are a number of differences between inSilicodb and CuMiDa, aside from the fact that CuMiDa is focused only on cancer data sets. For instance, inSilicodb offers data sets that have already been curated by the Bioinformatics community, thus they do not offer a uniform protocol of how the data sets were selected and manipulated.
Comparison Between the Databases Most Closely Related to Curated Microarray Database
We are only listing databases that possess similar characteristics or that can, in some level, be compared with CuMiDa.
Referring to low-quality sample exclusion.
We are taking into consideration databases that offer data sets from the last 5 years or if the majority of the data sets are at least from the last 10 years.
Some databases, such as inSilicodb and datamicroarray, which are R packages, can be exported in different formats, due to R flexibility. In this case, we are only listing the default entries they offer or their regular file format. inSilicodb, however, does not possess a file format since the information is imported directly into R.
For benchmarks, we are listing the different techniques these databases compare their available data sets. In this case, since inSilicodb offers data sets curated by the community, the condition they were build depends on the user.
SVM, DT, RF, k-NN, NB, MLP, HC, k-M.
BIGS, BioInformatics Group; CuMiDa, Curated Microarray Database; DT, decision trees; HC, hierarchical clustering; k-M, k-means; k-NN, k-nearest neighbors; MLP, multilayer perceptron; NA, not applicable; NB, Naive Bayes; NS, not specified; RF, random forest; SVM, support vector machine.
In addition, there is no description of exclusion of bad quality samples by inSilicodb, which is one of the major biases if ML approaches are to be employed for analysis since the algorithm would be learning from potential erroneous data. Finally, inSilicodb is focused on Affymetrix data, whereas CuMiDa was curated from all microarray data sets focused on cancer available in GEO, from all platforms. Obviously, the major highlight is that CuMiDa was exclusively built for ML approaches; thus, it offers metrics for basic ML techniques, as well as the download of different file extensions. Another crucial difference is that inSilicodb is directed toward bioinformaticians that have a biological background to begin with. In contrast, CuMiDa was made to bypass the need of a priori biological background, making data sets available with a uniform preprocessing already manipulated and edited in its final format.
Another R package, datamicroarray (documentation can be found in the package site ‡‡ and more can be acquired at GitHub §§ ) is focused on obtaining and processing microarray data sets, most from cancer studies, for ML purposes. Both databases provide classes number and their respective diseases, but there are major differences between datamicroarray and CuMiDa. In this sense, datamicroarray data sets are not curated from full microarray data sets, in contrast, they are derived from studies that already applied ML techniques and thus were already processed by various approaches. Additionally, there is no low-quality sample control, no benchmarking results, or curation processes of any kind. Finally, another major aspect is that most studies available in datamicroarray are from 1999 to 2006, falling into the same category as previously mentioned of data sets that are heavily employed throughout the literature with no curation and quality preprocessing. The same happens for the data sets available at the Broad Institute*** and the OpenML repositories, ††† which provide various microarray data sets for ML, but with none of the curation and preprocessing protocols offered by CuMiDa.
Moreover, another important mention is the BioLab supplementary database ‡‡‡ (Mramor et al., 2007). In this work, the authors employed 18 data sets, including some classical examples, and made the .tab files for Orange usage available for download. The website also offers classification results, based on Radviz visualization and k-NN, and lists of top ranked genes according to their method. However, these data sets were not curated with the same rigorous filtering protocol and classical preprocessing offered by CuMiDa. Additionally, CuMiDa still offers more file download options and benchmark results.
Another repository that makes available handpicked microarray data sets, built for ML, is in the BioInformatics Group (BIGS) website, §§§ which provides a list of different data sets, their .arff format for download, as well as training and test data sets. But they are not curated, preprocessed, do not provide other file formats, nor benchmarking results.
Thus, the curated data sets offered by CuMiDa, together with the available benchmarking results and different file formats for download, make it a valuable addition to the existing databases focused on microarray studies for ML.
5. Validation of Data Sets and Benchmarks
It is interesting to note that the accuracy results obtained by applying different ML classification algorithms to the data sets available in CuMiDa are in agreement with the scientific literature, where SVM and RF displayed the overall higher accuracy (Lee et al., 2005; Pirooznia et al., 2008; Statnikov et al., 2008) (Supplementary Table S1), exhibiting a mean of 88% and 85% of classification accuracy, respectively (Table 2), even though only the default parameters of WEKA were adopted.
Classification Accuracies (Threefold Cross Validation) with Their Mean, Standard Deviation, and Median Values for Each Applied Algorithm Over All Single-Channel Data Sets
SD, standard deviation.
Bold represents the best average accuracy and best average median found.
In contrast, DT and k-NN displayed the lowest mean classification accuracy of 76% and 81%, respectively, excluding the ZeroR algorithm. ZeroR was included as a baseline since it only classifies each sample as belonging to the largest class in the data set and, as expected, presented the worst results. As for the clustering results, k-M showed better results than HC, which, by its turns, displayed the second worst result aside from ZeroR.
CuMiDa has already successfully contributed to a gene expression pattern identification research that used the data available from some of the breast, colorectal, and leukemia cancers. This study employed neuroevolution ML algorithms and performed gene selection and sample classification over 13 GSEs present in CuMiDa (Grisci et al., 2018).
Finally, according to Peters et al. (2018), who discuss the role of benchmarks in computational biology, there are seven criteria to be considered when evaluating a benchmark. In Table 3, we discuss how CuMiDa fulfills these criteria.
Major Criteria Designed to Evaluate a Proper Benchmark
ML, machine learning.
6. Conclusion and Perspectives
Despite the fact that there are numerous databases that provide data sets, scripts, or curated information for microarray analysis, CuMiDa is the first database that was exclusively designed to provide curated data sets focused only on cancer microarray analysis for ML. By providing rigorously handpicked, preprocessed, and manually edited data sets, together with different file formats for download and numerous benchmark testing values for various ML approaches, CuMiDa becomes an important addition to the existing toolkit for both biological and computer science community. Currently, CuMiDa offers only microarray data sets for H. sapiens. However, for future updates, we aim to provide curated data sets of RNAseq studies. RNAseq is the most recent source of biological large-scale expression data, and ML approaches are also being implemented to deal with this kind of data. Moreover, the addition of mice microarray cancer data is also a possible update. Studies that employ the mice model usually possess way more samples than H. sapiens studies and could become valuable additions to train and test ML approaches. CuMiDa is available at http://sbcb.inf.ufrgs.br/cumida
Footnotes
Acknowledgments
This work was supported by grants from FAPERGS (16/2551-0000520-6), MCT/CNPq (311022/2015-4), CAPES-STIC AMSUD (88887.135130/2017-01)—Brazil, Alexander von Humboldt-Stiftung (AvH) (BRA 1190826 HFST CAPES-P)—Germany. This study was financed in part by the Coordenacão de Aperfeiçoamento de Pessoal de Nível Superior—Brazil (CAPES)—Finance Code 001.
Author Disclosure Statement
The authors declare that no competing financial interests exist.
References
Supplementary Material
Please find the following supplemental material available below.
For Open Access articles published under a Creative Commons License, all supplemental material carries the same license as the article it is associated with.
For non-Open Access articles published, all supplemental material carries a non-exclusive license, and permission requests for re-use of supplemental material or any part of supplemental material shall be sent directly to the copyright owner as specified in the copyright notice associated with the article.