
Abstract
Abstract
The classification of pathogens in emerging and re-emerging viruses represents major interests in taxonomic studies, functional genomics, host–pathogen interplay, prevention, and disease treatments. It consists of assigning a given sequence to its related group of known sequences sharing similar characteristics and traits. The challenges to such classification could be associated with several virus properties including recombination, mutation rate, multiplicity of motifs, and diversity. In domains such as pathogen monitoring and surveillance, it is important to detect and quantify known and novel taxa without exploiting the full and accurate alignments or virus family profiles. In this study, we propose an alignment-free method, CASTOR-KRFE, to detect discriminating subsequences within known pathogen sequences to classify accurately unknown pathogen sequences. This method includes three major steps: (1) vectorization of known viral genomic sequences based on k-mers to constitute the potential features, (2) efficient way of pattern extraction and evaluation maximizing classification performance, and (3) prediction of the minimal set of features fitting a given criterion (threshold of performance metric and maximum number of features). We assessed this method through a jackknife data partitioning on a dozen of various virus data sets, covering the seven major virus groups and including influenza virus, Ebola virus, human immunodeficiency virus 1, hepatitis C virus, hepatitis B virus, and human papillomavirus. CASTOR-KRFE provides a weighted average F-measure >0.96 over a wide range of viruses. Our method also shows better performance on complex virus data sets than multiple subsequences extractor for classification (MISSEL), a subsequence extraction method, and the Discriminative mode of MEME patterns extraction tool.
1. Introduction
Advances in DNA sequencing technologies have allowed a massive proliferation of genomic sequences (Goodwin et al., 2016). Particularly, in the viral molecular biology fields, the advent of these massive data has brought new challenges to sequence analysis and classification disciplines. Genomic sequence classification is a fundamental practice in different fields of microbiology research. It consists of assigning a given sequence to its related group of known sequences sharing similar characteristics and traits. Indeed, accurate classification of genomic sequences can have major impacts in many related domains. In medicine, this can help to determine pathogenicity and virulence of strains, develop vaccines and study of microbial epidemiology and drug resistance (Struck et al., 2014). In biology, it improves phylogenetic and functional studies of viruses, automatic recognition of organisms, and characterization of genomic regions (Van Belkum et al., 2001). Finally, in text classification, referenced biological sequences provide quality support for the development and evaluation of new algorithms (Xing et al., 2010).
Several methods were implemented into tools to classify viral sequences. Initial methods rely on sequence alignment including (1) general-purpose tools for similarity search such as BLAST (Altschul et al., 1997) and USEARCH (Edgar, 2010) and (2) organism-specific tools such as REGA (De Oliveira et al., 2005) and SCUEAL (Pond et al., 2009) for human immunodeficiency virus 1 (HIV-1) classification. However, using alignment-based methods could face certain limitations. Indeed, they are memory and time consuming and their computational load for large databases presents a real bottleneck (Bonham-Carter et al., 2013; Zielezinski et al., 2017). Alignment-based methods are not suited for genomes, like those of viruses, that are exposed to large genetic variations such as recombination, shuffling, and horizontal gene transfer events (Duffy et al., 2008; Zielezinski et al., 2017). In addition, performing an alignment requires often the adjustment of several parameters (substitution matrices, gap penalties, threshold values for statistical parameters, etc.) that are dependent on a priori knowledge of the evolution of the sequences being compared. Adjusting these parameters is, therefore, sometimes arbitrary and requires a trial-and-error approach (Zielezinski et al., 2017). Many experiments have shown that minor variations in these parameters can greatly affect the quality of alignment (Wong et al., 2008).
Finally, they require whole sequence realignment and often rely on tree reconstruction for each new prediction. Efforts are done on techniques for taxon placement (Matsen et al., 2010; Berger et al., 2011; Zhang et al., 2013) and realignment but remain slow to handle quickly large-scale sequence data in the classification process.
Hence, to overcome these issues, alignment-free methods rose as an alternative in sequence comparison and classification. They transform biological sequences into feature vectors (Vinga, 2014) to compute a distance and construct a phylogenetic or a machine learning model (Xing et al., 2010). Handling sequences in a vector space avoids residue correspondences, which increases the speed of calculation and provides a robustness for the genetic variation prediction (Zielezinski et al., 2017). To obtain accurate classification using alignment-free approaches, it is mandatory to identify relevant features. Combining these methods with clustering and supervised learning techniques has attracted new interests in virus classification (Deng et al., 2011; Struck et al., 2014; Remita et al., 2017; Ren et al., 2017; Silva et al., 2017). We have shown previously that using restriction fragment length polymorphism (RFLP) signatures could be relevant in classifying several virus data sets but limited in diversity coverage for specific pathogen detection (Remita et al., 2017).
Nowadays, k-mers (nucleotide subsequences of length k) constitute an alternative or complementarity to vectorize nucleotide sequences (Bonham-Carter et al., 2013). The use of this kind of attribute has shown its efficiency in the classification of sequences through phylogenetic trees (Blaisdell, 1986; Sims et al., 2009; Kolekar et al., 2012), distance-based approaches (Otu and Sayood, 2003; Liu et al., 2011; Nalbantoglu et al., 2011), or methods based on statistics and nucleotide compositions (Ulitsky et al., 2006; Reinert et al., 2009; Chan et al., 2012). However, in areas such as metagenomic classification (Wood and Salzberg, 2014; Ounit et al., 2015), this type of transformation can require the storage of several hundred gigabytes of RAM. Indeed, the k-mer transformation implies
In this article, we focus first on the extraction of discriminating features for the classification of viral genomic sequences. Recently, multiple subsequences extractor for classification (MISSEL) has been developed (Fiscon et al., 2016). MISSEL is a supervised method based on a genetic algorithm, using alignment sequences to identify small genomic subsequences that discriminate different species. In Fiscon et al. (2016), the authors applied this approach to classify various virus data sets such as influenza virus, polyomavirus and rhinovirus. The results showed the ability of MISSEL to extract discriminant patterns allowing to predict with an accuracy between 90% and 100% for the different data sets. In the field of pattern extraction from DNA sequences, the MEME web platform (Bailey et al., 2009) has a prominent importance. This suite of tools specialized in the discovery and analysis of sequence patterns representing features provides a Discriminative mode (Bailey et al., 2010) for enriched pattern extraction through sets of sequences. The Discriminative mode takes in input two sets of sequences to discover motifs that are enriched in the first (primary) set relative to the second (control) set. MEME creates a position-specific prior (PSP) from the two sets of sequences, up-weighting words in the primary data set that occur frequently there but are infrequent in the negative data set. PSP assigns a probability that a motif starts at each possible location in the sequence data. Then, it searches in the first set of sequences for motifs using the PSP to discriminate from the second set.
In this study, we propose an original alignment-free machine learning method, CASTOR-KRFE, to extract discriminating k-mers within known pathogen sequences to detect and classify accurately new sequences. The proposed approach is powerful to identify a minimum feature set with optimal k length to maximize classification performance. We performed a simulation study on synthetic data to assess the quality of the extractor. Moreover, we assessed this method on 12 viral data sets from different groups and compared its performance against MISSEL (Fiscon et al., 2016) and the Discriminative mode of MEME (Bailey et al., 2010) patterns extraction tool. Finally we analyze in more detail the properties of extracted k-mers.
2. Materials and Methods
2.1. Objectives
In this article we introduce CASTOR-KRFE (k-mers extraction by recursive feature elimination) to construct a set of features relevant for the classification of genomic sequences. Using this method, we expect to achieve three main objectives: (1) first, extract a minimal discriminating set of subsequences maximizing viral classification performances; (2) second, identify the optimal subsequences length maximizing classification accuracy; (3) finally, make these features easily interpretable on a human scale. Indeed several extracted subsequences could correspond to meaningful biological information.
2.2. The CASTOR-KRFE algorithm
The CASTOR-KRFE learning algorithm takes as input (1) S, a set of n known sequences, such that
In Algorithm 1, for each
After this preprocessing step, the algorithm will start by analyzing whether the current number of features (corresponds to the number of columns in matrix X) is higher than the maximum number of features given in parameter (
The feature sets and their associated scores will be included in the feature extractors and the classifier assessment as described in Algorithm 2. Our algorithm uses an SVM based on a linear kernel. This kernel requires a few hyperparameters involving a low complexity of the selection model. In the last part of Algorithm 2, we scan the performance score lists to extract the optimal feature set and the optimal k length of the subsequences. The selected optimal feature must satisfy two conditions. First, it has an F-measure score higher than the best score multiplied by the performance threshold T (percentage of performance maintained relative to best score). Second, it has the fewest number of features. Finally, a supervised learning algorithm is trained with the optimal feature set to build a predictive model.
2.3. Data sets
We applied our approach to a heterogeneous set of genomic data covering the seven major virus groups. From a wide range of data sets, we sampled re-emerging viruses affecting the current world populations such as Ebola virus, HIV, hepatitis C virus (HCV), and dengue virus. The accurate and fast identification of these types of viruses can have major impacts for their study and the preservation of human life and health. Indeed Ebola virus disease is associated with a case fatality rate of 30% to 90%, depending on the virus species (Baize et al., 2014). The dengue virus has also been included in our data set. Dengue fever is an emerging disease in all tropical and subtropical regions of Asia, Africa, America, and the Pacific (Vaughn et al., 2000). Each year, at least 100 million dengue infections are estimated (Halstead, 1988). Dengue infection is associated with hemorrhagic fever and shock syndromes, which is a major cause of pediatric morbidity and mortality in tropical Asia (sangkawibha et al., 1984).
Some re-emerging viruses, at the same time, are complex and with a large variety of subtypes and high recombination rates. Indeed, the HCV includes many genotypes that differ from each other by ∼30% at the nucleotide level. Moreover, each genotype is composed of multiple divergent subtypes of ∼20% on their nucleotide composition (Simmonds et al., 2005). The classification of HIV also represents a major interest. In fact, its predominant group M is currently divided into 13 subtypes. Genetic variation within a subtype can be ranged between 15% and 20%, whereas variation between subtypes is usually 25% to 35% (Taylor et al., 2008). In addition, HIV has high mutation and recombination rates. They are two essential features of the replication cycle that allow the continuous spread of HIV around the world, involving a pandemic of unprecedented genetic and geographic complexity (Taylor et al., 2008).
In this study, we also incorporated other viruses that have large-scale impacts on the world population. For instance, influenza virus has high epidemiological and clinical importance, which is why European Centre for Disease Prevention and Control (ECDP) has recently set up epidemiological influenza surveillance program (Fiscon et al., 2016). Polyomavirus and human rhinovirus were included as well, as there are still a great number of unanswered questions about their evolution, interactions with the host, contributions in diseases and their clinical severity (Fiscon et al., 2016; Pierangeli et al., 2013). Moreover, we also investigate Geminiviridae family, which infects a wide range of plants and causes significant worldwide economic losses (Silva et al., 2017).
The characteristics of the different data sets are summarized in Table 1. The data sets of HIVs (HIVGRPCG, HIVSUBCG, and HIVSUBPOL), human papillomaviruses (HPVs; HPVGENCG and HPVSPECG), and hepatitis B viruses (HBVGENCG) were obtained directly from CASTOR database (Remita et al., 2017). Genomic sequences of polyomaviruses (POLSPEVP1, POLSPEVP2, POLSPEVP3, POLSPEST, and POLSPELT), influenza viruses (INSUBFNA, INFSUBHA, and INFSUBMP), and rhinoviruses (RHISPECG) were collected from the additional resources of the MISSEL article (Fiscon et al., 2016). Data sets of dengue viruses (DENSPECG), Ebola viruses (EBOSPECG), and rotaviruses (ROTSPECG) were obtained from the Virus Pathogen Resource database (Pickett et al., 2011). HCV data (HCVGENCG and HCVSUBCG) were collected from the Virus Pathogen Resource Los Alamos HCV database (Kuiken et al., 2004). Finally, Geminiviridae data set (GEMGENCG) was built from the Geminivirus Data warehouse (Silva et al., 2017).
Data Sets
CG, complete genome; dsDNA, double-stranded DNA; dsRNA, double-stranded RNA; HA, hemagglutinin; HIV-1, human immunodeficiency virus 1; LT, large tumor antigen; MP, M1 protein + M2 protein; NA, neuraminidase; pol, pol fragment.; ST, small tumor antigen; ssDNA, single-stranded DNA; ssRNA, single-stranded RNA; VP1, structural protein VP1; VP2, structural protein VP2; VP3, structural protein VP3; VP4, structural protein VP4.
3. Results and Discussion
3.1. Evaluation of CASTOR-KRFE for the extraction of relevant k-mers on simultated synthetic sequences
A first required step for our approach is the evaluation of its ability to identify correct and discriminant k-mers, the optimal k length in various sequences. To perform a reproducible assessment, we simulated several data sets of random sequences. These sequences have been separated into different groups. For each group, a specific k-mer was generated and introduced at a random position in each sequence belonging to this group. Once the data sets were generated, we execute CASTOR-KRFE to try to find the specific k-mers to each class. After extracting k-mers, they were used to build a model on the data set. This model was then evaluated using 10-fold cross-validation. This evaluation was carried out by varying three major parameters, which are the length of the sequences (1000, 5000, and 10,000 nucleotides), the length of k-mers (2, 10, and 20 nucleotides), and the number of classes (2, 10, and 20 classes). The information and average results of this assessment are illustrated in Table 2. We set the other parameters as follows: T = 0.99,
Evaluation Table on Randomly Simulated Sequences
This table illustrates the evaluations performed on the simulated synthetic sequence sets divided into different categories (varying, respectively, the length of the sequences, the number of classes, and the length k of the introduced discriminating k-mers). The first column indicates the length of the generated sequences. The second column specifies information on the length of the discriminating k-mers inserted into the sequences. The third column shows the number of classes in the data sets. Column “No. of sequences/class” gives the number of sequences per class. Columns “No. of identified k-mers” and “Identified k” give, respectively, the number of k-mers extracted by the algorithm and the length of k identified. The last column gives the weighted F-measure of the model evaluation.
The natural way to evaluate classification performances is to use the accuracy measure that refers to the number of correctly classified instances in the data set. However, the F-measure (
Based on the results presented in Table 2, in all cases, CASTOR-KRFE identifies the optimal lengths of the discriminating k-mers, inserted randomly into the sequences. Also, it was able to extract the minimal set of the discriminating k-mers. Indeed, our algorithm directly characterized the last class by the absence of all other k-mers. Therefore, the results show an F-measure very close to 1 when evaluating models trained with the extracted features. We note that the F-measure slightly decreases when the length of the sequences increases and the length of the discriminating k-mers decreases. This could be explained by the increased probability of emergence of discriminating patterns when generating large random sequences. Consequently, the discriminating k-mers will be present in several classes, which explains the drop of F-measure. Moreover, we can highlight from the results that our approach can extract discriminating patterns of various lengths of k. Finally, the F-measure remains stable and high even with the increase in the number of sequences and classes.
3.2. Performance assessment on different virus data sets
We used a jackknife resampling method to evaluate the capacity of the method to extract relevant features and perform accurate classification on the 12 collected data sets covering the seven major virus groups. In each iteration, the data sets were partitioned randomly into two parts of 80% and 20%. The 80% sampled partitions constitute the training sets on which CASTOR-KRFE was applied to extract the discriminating k-mers and build the prediction models. The other 20% partitions were used as test sets to evaluate the performance of the trained models. The results of 100 performed iterations are presented in Figure 1. To preserve high performances while reducing the size of the feature sets, the parameters of the method were fixed as follows: T = 0.99,
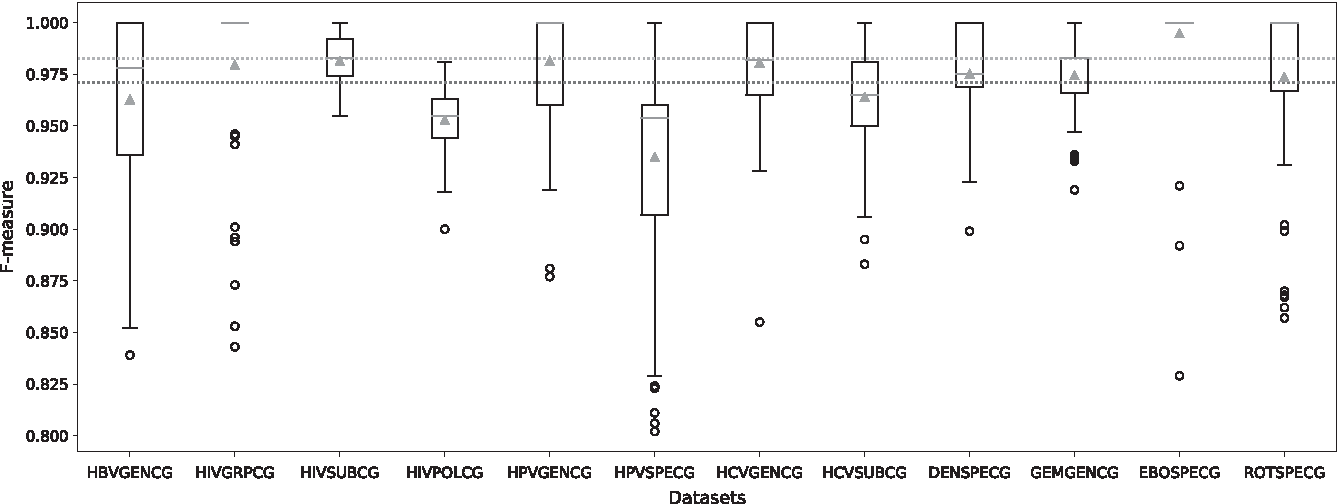
Prediction performance of virus data sets. This figure represents the F-measure distribution of the predictions on the 12 data sets. For each data set, a boxplot illustrates the distribution of the weighted F-measure obtained on 100 iterations. The black circles below the boxplots represent the outliers. The complete orange lines and the green triangles correspond, respectively, to the median and mean values for each data set. The orange and green dotted lines represent, respectively, the median and mean values of all data sets.
The results shown in Figure 1 highlight a good performance of CASTOR-KRFE, with an average F-measure around 0.970 for all the predictions. The median value of F-measure for all predictions is ∼0.980. Even for the lowest performance classifications (HPVSPECG), the average F-measure does not fall <0.920. Moreover, at least 50% of the predictions have an F-measure score >0.950. We can still note the wide variation of F-measure in the results of HIVGRPCG and HPVSPECG. This variation could be associated with the small number of instances that constitute some classes of these data sets (four instances of HIV1 group O in HIVGRPCG data set, and seven instances of HPV ALPHA 14 and nine instances of HPV ALPHA 14 in HPVSPECG data set).
Figure 2 presents the distribution of the extracted k-mers length. In general, the k-mers with lengths ∼10 provide better results to discriminate the different viral genomic sequences. We can also note that data sets consisting of short sequences with large number of classes often discriminated with k-mers of lengths <10 (Table 1 and Fig. 2). For instance, the HIVSUBPOL data set, consisting of a sequence of ∼1300 nucleotides and including 28 classes, has a discriminating k length of 5. However, the Ebola virus data set (EBOSPECG), with average sequence length of ∼19,000 nucleotides and 5 classes, involves discriminating k-mers of average length 26.
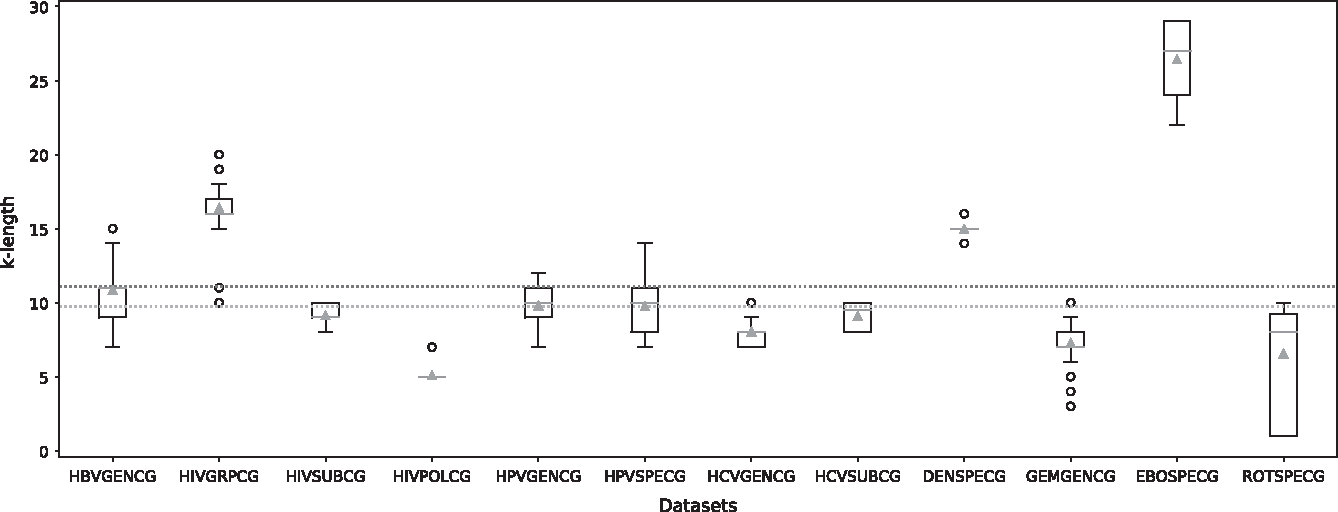
Distribution of the length of the extracted k-mers. This figure illustrates the extracted k length distribution of the predictions for the different data sets. For each data set, a boxplot illustrates the length of k identified for 100 iterations. The black circles below the boxplots represent the outliers. The complete orange lines and the green triangles represent, respectively, the median and mean values for each data set. The orange and green dotted lines represent, respectively, the median and mean values of all data sets.
In agreement with the information in Table 1, we can see that the number of k-mers extracted per data set shown in Figure 3 is often close to its number of classes. This shows that our method tends toward searching for rare specific subsequences. Figure 3 also reveals the complexity of the HIVSUBCG, HIVSUBPOL, HCVGENCG, and HCVSUBCG data sets where variabilities between sequences are large. Thus, they require a higher average number of features to get an F-measure >0.950. For these complex data sets, the number of extracted features is often three times higher than their number of classes.

Distribution of the number of extracted features. This figure shows the distribution of the number of extracted features on the different data sets. For each data set, a boxplot illustrates the distribution of the number of features selected on 100 iterations. The black circles below the boxplots represent the outliers. The complete orange lines and the green triangles represent, respectively, the median and mean values for each data set. The orange and green dotted lines represent, respectively, the median and mean values of all data sets.
3.3. Comparison with MISSEL
As mentioned in Fiscon et al. (2016), no accurate supervised classification method capable of extracting several human-readable models had been released. We conducted our comparative study against MISSEL with the data sets used in Fiscon et al. (2016) combined with the complex virus data sets. The data sets are composed as follows: (1) RHISPECG, INSUBFHA, INSUBFNA, INSUBFMP, POLSPEVP1, POLSPEVP2, POLSPEVP3, POLSPEST, and POLSPELT data sets were extracted from the additional resources of Fiscon et al. (2016) and (2) HIVGRPCG, HIVSUBCG, HIVSUBPOL, HCVGENCG, and HCVSUBCG data sets were collected from CASTOR database (Remita et al., 2017). The last four data sets are considered complex data sets with often a large number of classes and a large variation within sequences of the same group. MISSEL requires a multiple sequence alignment to extract discriminating subsequences. Hence, the sequences of the data sets extracted from CASTOR database were aligned with MUSCLE (Edgar, 2004). MISSEL was applied to the collected aligned sequences with a train (80%)/test (20%) split and its best performing parameters (Fiscon et al., 2016). CASTOR-KRFE was assessed as follows. For each data set, we generated 100 random sampling with a train/test ratio similar to that of MISSEL. Figure 4 reports results of the predictions of CASTOR-KRFE and MISSEL.
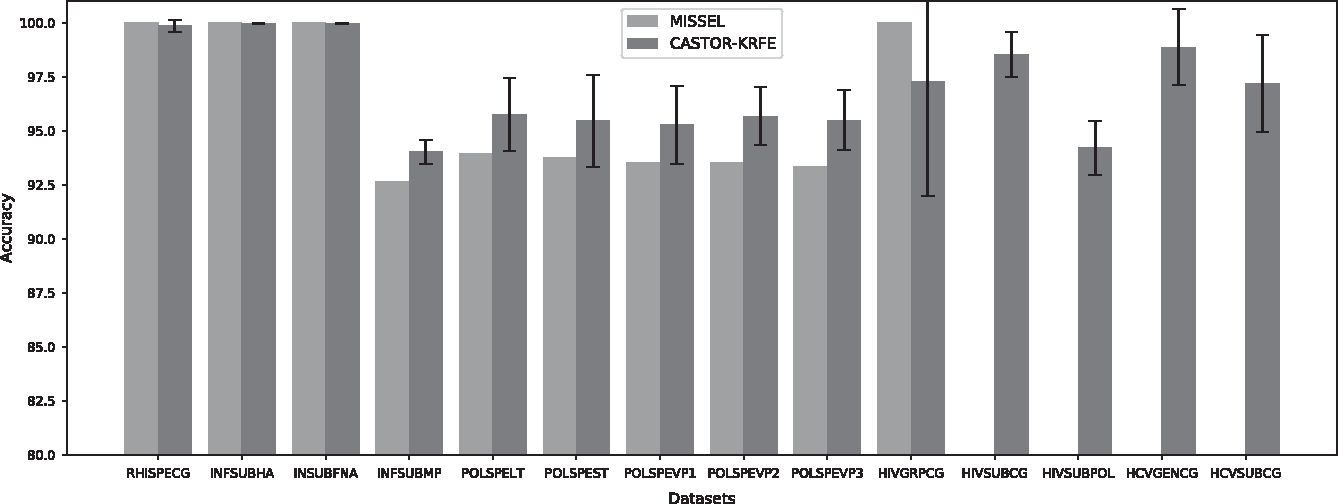
Comparison of prediction performance with MISSEL of multiple virus data sets. This figure illustrates the comparison of the accuracy between MISSEL and CASTOR-KRFE. The green bars represent the performance of the best results obtained by the MISSEL algorithm. The blue bars represent the average performance obtained for 100 iterations by the CASTOR-KRFE algorithm. The corresponding standard deviations are included. The first nine data sets, going from the left, are performed from the MISSEL data. The last five data sets, including four complex data sets, have been collected from CASTOR database. On the last four complex data sets, the MISSEL algorithm failed to identify discriminating subsequences, which explains the absence of a plot bar. MISSEL, multiple subsequences extractor for classification.
Both methods, CASTOR-KRFE and MISSEL, obtained roughly the same results on the RHISPECG, INSUBFHA, and INSUBFNA data sets with an accuracy ∼100%. For the INSUBFMP, POLSPEVP1, POLSPEVP2, POLSPEVP3, POLSPEST, and POLSPELT data sets, CASTOR-KRFE average results are 4% higher than the best results obtained by MISSEL. On HIVGRPCG data set, MISSEL obtained a 100% accuracy, where CASTOR-KRFE obtained an average accuracy of 97.3% for the 100 iterations. For CASTOR-KRFE, we can observe a high standard deviation for this data set. This could be explained by the difficulty of establishing a robust prediction model with very limited instance for some classes (4 for class O and 11 for class N). Finally, for the four most complex data sets (HIVSUBCG, HIVSUBPOL, HCVGENCG, and HCVSUBCG), CASTOR-KRFE had an average prediction performance of 95%. On this type of data, the MISSEL algorithm was unable to identify discriminating subsequences to achieve the predictions. In general, CASTOR-KRFE outperforms MISSEL.
3.4. Comparison with MEME
A second comparison with a tool specialized in the discovery and analysis of sequence patterns representing features, from the MEME suite (Bailey et al., 2009) was performed. For this study, the MEME Discriminative mode (Bailey et al., 2010) tool was selected. This tool allows to discover ungapped discriminative motifs with fixed k length from a set of sequences. The MEME Discriminative mode algorithm takes as input two classes of sequences. It discovers motifs that are enriched in the first (primary) set relative to the second (control) set. To assess MEME, we set up the following experiment for each virus data set D: for each class c of the data set D, we select all sequences belonging to class c as primary sets. All other sequences of D were used to form the control or negative set. Then, we apply the MEME algorithm to extract the discriminative patterns. This step is iterated for each known class in the data set (described in section 3.2) to extract the patterns that discriminate each class from the others. All the extracted patterns are then used to build a predictive model.
Finally the quality of this model is to assess using 10-fold cross-validation. For CASTOR-KRFE, the same data sets were given as input to extract the discriminative k-mers and build a model. The patterns extracted by the two algorithms, MEME and CASTOR-KRFE, are then compared in terms of number, length, and discriminative power. Regarding the parameters, for both methods, the length of the extracted patterns should be between
Table 3 highlights Precision, Recall, and F-measure performance metrics for each comparison. For the 12 data sets, MEME obtained an average Precision of 0.892, an average Recall of 0.870, and an average weighted F-measure of 0.869. CASTOR-KRFE improves the results by an average of 14%, obtaining, respectively, for Precision, Recall, and F-measure average scores of 0.994, 0.993, and 0.993. The lowest result for MEME is obtained for HPV genus classification, with an F-measure of 0.555. For CASTOR-KRFE, the lowest result is obtained for HIV pol fragments classification, with an F-measure of 0.972. These results show that the patterns extracted by CASTOR have a better potential to discriminate between different virus classes.
Comparison with MEME (Discriminative Mode)
This table presents the results of the comparative study between CASTOR-KRFE and MEME (Discriminative mode). The first column provides information on the different data sets used. The other columns show, respectively, for the two methods, the number of extracted motifs, their length k, and the scores of the different performance metrics (Precision, Recall, and F-measure) obtained during the cross-validation evaluation.
Regarding the number of the extracted motifs, CASTOR-KRFE needed on average only 11 motifs to obtain better performance than MEME that requires on average 28 motifs per data set. Finally, observing the length of the extracted patterns, we can see that CASTOR-KRFE has identified specific and varied k-mers according to the different data sets. The smallest k length is obtained for the HIV pol fragments data set (number of classes = 28, average sequence length = 1211) with a k = 5. The longest k length is obtained for the Ebola virus data set (classes = 5, average sequence length = 18,982) with k = 29. In general, CASTOR-KRFE identified an average length of k = 11. However, MEME has identified degenerated motifs of length k = 30 for all data sets. We can highlight that short patterns imply less sensitivity to mutations within nucleotide sequences.
3.5. Detecting unknown viruses from large databases
To test our approach and evaluate the quality of the extracted features, we performed large-scale predictions on complex viruses throughout the world. For HIV-1 sequences, we used collected data sets by Remita et al. (2017) from the Los Alamos HIV database (www.hiv.lanl.gov). These data sets include a set of complete genome (GC) data (3778 instances) and another set of pol fragments (119,005 instances). Moreover, we combined and removed duplicates of all the curated HCV sequences of the Los Alamos HCV database (Yusim et al., 2005) and the Virus Pathogen Resources Database (Pickett et al., 2011). Two sets of 3455 HCV sequences for genotype and subtype classification were created. Also, all complete genomes of the NCBI Dengue Virus Database (Hatcher et al., 2016) were downloaded forming a data set with 4938 sequences of different types of dengue virus.
Finally, a last data set of Ebola virus species (2045 instances) was aggregated data from the Virus Pathogen Resources Database (Pickett et al., 2011), the NCBI Ebola Virus Database (Brister et al., 2014), and the LANL Hemorrhagic Fever Virus Database (Kuiken et al., 2011). We used CASTOR-KRFE to extract features and train predictive models from the data sets HIVSUBCG for HIV-1 complete genomes subtypes prediction, HIVSUBPOL for HIV-1 pol fragments subtypes prediction, HCVGENCG for HCV complete genomes genotypes classification, HCVSUBCG for HCV complete genomes subtypes classification, DENSPECG for dengue complete genomes types predictions, and EBOSPECG for Ebola complete genomes species prediction. Finally, we evaluated the prediction performances of all the new constituted virus data sets. We took care to remove all the sequences used in the training step from these test data sets (except for HCV data set due to the small number of instances of certain classes).
The overall results illustrated in Figure 5 highlight performance scores >0.940 of the different data sets. For the prediction of the HVI-1 complete genomes, CASTOR-KRFE extracted from the data set HIVSUBCG (597 sequences) 74 k-mers of length of 8. The built model from these extracted k-mers allowed to predict the complete genome Los Alamos HIV-1 GC database with a Precision of 0.950 and a Recall of 0.960. For pol fragments, 96 k-mers of length of 5 were identified from the HIVSUBPOL data set (1352 sequences). The model built with these identified k-mers allowed to predict the classes of >119,000 sequences with a Precision of 0.985 and a Recall equal to 0.976. Compared with the CASTOR prediction method based on RFLP fragments (Remita et al., 2017), we improved the classification accuracy by 5% for complete genomes and 12% for pol fragments.
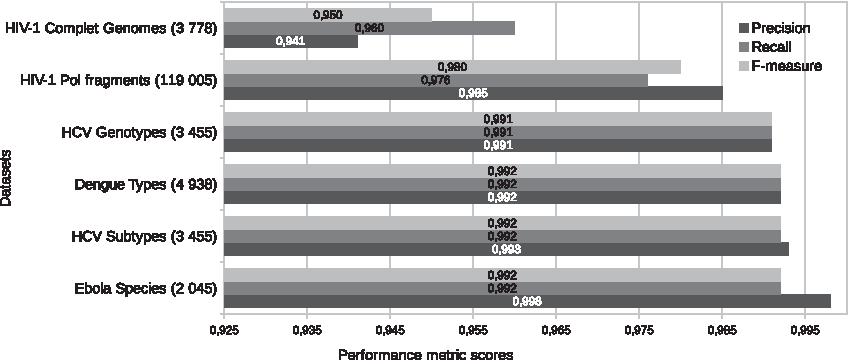
Prediction performance of large databases. This figure illustrates the predictive performance of six virus data sets (HIV-1 complete genomes and HIV-1 pol fragments for subtype classification, HCV complete genomes for genotype and subtype classification, dengue complete genomes for type classification, and Ebola complete genomes for specie classification). The values in the parentheses indicate the number of instances in each data set. The blue, red, and green represent the Precision, the Recall, and the weighted F-measure, respectively.
For HCV genotyping, CASTOR-KRFE extracted from the data set HCVGENCG (284 sequences) 50 k-mers of length k = 8. The prediction model based on the discriminating k-mers was able to predict the genotypes of 3455 HCV sequences with a Precision and a Recall >0.990. The HCV classification at the subtype level also had the same performance scores. Its prediction model was trained from 43 k-mers with length of 8 extracted from the HCVSUBCG data set (284 sequences). Finally, the Precision, Recall, and F-measure are >0.990 for the classification of sequences of dengue viruses and Ebola viruses. For dengue virus, the model was trained with only 2 k-mers of length of 11 extracted from the DENSPECG data set (250 sequences). Furthermore, the model used to classify Ebola virus sequences was trained only with 3 k-mers of length k = 29 extracted from EBOSPECG (88 sequences).
4. Conclusion
CASTOR-KRFE is an accurate alignment-free method to extract discriminant genomic subsequences. It identifies a minimal set of k-mer-based features with an optimal k fragment length to maximize the classification performance. Our method outperforms MISSEL, the first supervised classification method based on multiple sequence alignment capable of extracting several human-readable models. This method showed its limitations on complex data sets of HIV and HCV in the comparative study. These results confirm that the large genetic variations of virus genomes are a limitation of the alignment-based algorithms (Zielezinski et al., 2017). An additional comparative study has shown that our solution can extract sets of patterns smaller and more discriminating than those of the Discriminative mode of MEME pattern extraction tool (Bailey et al., 2010). Several extracted subsequences could potentially correspond to meaningful biological information. These feature sets derived from k-mers could be used to build easily human-readable prediction models or rule-based classifiers. This type of approach would be suitable for building reduced databases of discriminatory patterns in fields of virus classification, viromics, and metagenomic classification. It can also be an asset in the process of identifying discriminant biomarkers for specific classes of viruses.
As specified in Zhang et al. (2017), identifying an optimal feature length in an alignment-free method is an important challenging process, which is still an open problem. Methods such as Wu et al. (2005), Chikhi and Medvedev (2013), and CASTOR-KRFE, which intend to tackle this problem, propose a unique length for k-mers as the optimal length. However, we are going to evolve our method by adding an additional layer that could build an optimal set of k-mers having different lengths. Thus, the new version could potentially achieve more accurate classification and might represent biological properties of k-mers in a better way. CASTOR-KRFE is implemented under a permissive open-source license (MIT) and it can be obtained from (https://github.com/bioinfoUQAM/CASTOR_KRFE). It will also be added for the detection of pathogens on CASTOR web platform (Remita et al., 2017), which is available at (http://castor.bioinfo.uqam.ca).
Footnotes
Acknowledgments
This work was supported by the Natural Sciences and Engineering Research Council of Canada (NSERC) and the Fonds de Recherche du Québec-Nature et Technologie (FRQNT) to Abdoulaye Baniré Diallo. Amine M. Remita is NSERC and FRQNT fellow.
Author Disclosure Statement
The authors declare there are no competing financial interests.