
Abstract
Abstract
This study aimed to investigate the role of prostate cancer associated transcript 1 (PCAT1) underlying the molecular mechanisms of prostate cancer. Using GSE29886 data set downloaded from Gene Expression Omnibus database, we screened the differentially expressed genes (DEGs) in PCAT1-siRNA interfering (PCAT1-siRNA) LNCaP cells compared with control-siRNA cells. Transcription factor (TF) and tumor-associated genes database were used to obtain oncogenes and tumor suppressor genes. Gene Ontology (GO) and Kyoto Encyclopedia of Genes and Genomes (KEGG) enrichment analysis were used to investigate the function and pathways of DEGs. Subnetwork was further analyzed using BioNet. A total of 93 DEGs were identified. KEGG analysis showed downregulated TF genes (ID1 and ID3) were enriched in transforming growth factor-β pathway, whereas upregulated genes were involved in pathways associated with immune system, environmental sensing, and metabolism. GO analysis showed that downregulated genes were primarily enriched in cell cycle-related biological functions and upregulated DEGs were related to immune response, exogenous genetic material response, and viral response. Centromere protein F (CENPF) was identified as the central node of the regulatory subnetwork. In the PCAT1 knockdown LNCaP cells, the CENPF, ID1, and ID3 were obviously decreased based on the RT-PCR (quantitative real-time reverse transcription PCR) analysis. PCAT1 may be involved in cell cycle and proliferation of prostate cancers by mediating the expression of CENPF, ID1, and ID3.
1. Introduction
Prostate cancer is one of the most commonly diagnosed tumor among men worldwide (Parkin et al., 2001). The primary risk factors for prostate cancer are age, obesity, and family history. The gene expression analysis revealed candidate markers and therapeutic targets for prostate cancer (Welsh et al., 2001). High serum macrophage inhibitory cytokine-1 level is associated with the metastatic prostate cancer. Enhancer of zeste homolog 2 was overexpressed in metastatic prostate cancer and resulted in transcriptional repression of a set of genes in prostate cells (Varambally et al., 2002). New targets and biomarkers that can aid in understanding the mechanism and contribute to discovery novel therapy are urgently needed. Noncoding RNAs (ncRNAs), including short ncRNAs and long ncRNAs (lncRNAs, >250 bp), are ubiquitous in all organisms (Birney et al., 2007; Kapranov et al., 2007; Van Dijk et al., 2011). Although ncRNAs has no ability to encode proteins, they have been suggested to play a role in distinct biological functions, such as stress response, embryonic stem cell pluripotency, splicing, localization, chromatin remodeling, and messenger RNA (mRNA) decay. Furthermore, lncRNAs also play important roles in many cellular processes, including cell cycle, survival, migration, and metabolism (Ge et al., 2013; Zhang et al., 2013). In human diseases, lncRNAs have important cellular functions, particularly in cancer (Huarte and Rinn, 2010; Pauli et al., 2011). Emerging study has suggested that lncRNAs have essential roles in tumorigenesis.
Prensner et al. (2011b) performed RNA sequencing and found prostate cancer associated transcript 1 (PCAT1) was a novel lncRNA involved in cell proliferation and was implicated in prostate cancer progression. It is reported that PCAT1 is an oncogene that can promote prostate cancer cell proliferation by targeting cMyc (Prensner et al., 2014). Besides, PCAT1 was found to be overexpressed in colorectal cancer patients and was suggested to be a biomarker for poor prognosis prediction (Ge et al., 2013). The expression of PCAT1 is correlated with the stage and prognosis of esophageal squamous cell carcinoma. However, the role of PCAT1 in the prostate cancer has not been clarified clearly.
Therefore, in this article, we attempted to explore the role of PCAT1 in the molecular mechanisms underlying prostate cancer. Gene Ontology (GO) function and Kyoto Encyclopedia of Genes and Genomes (KEGG) pathway enrichment analysis of complementary DNA (cDNA) microarray of PCAT1 knockdown LNCaP samples and normal tissues were performed.
2. Methods
2.1. Affymetrix microarray data
The expression profile data were acquired at National Center for Biotechnology Information Gene Expression Omnibus (www.ncbi.nlm.nih.gov/geo) through the accession number of GSE29886. The data sets included nine samples of LNCaP cells treated with PCAT1-siRNA versus cells treated with control siRNA. Microarray analysis was performed for LNCaP cells of knockdown PCAT1 by three independent siRNAs versus controls in three independent repeats by using dual channel microarray analysis based on the platform of Agilent-014850 Whole Human Genome Microarray 4x44K G4112F.
2.2. Data preprocessing and differentially expressed genes analysis
To obtain a gene expression matrix among samples, microarray data were preprocessed using AFFY (Gautier et al., 2004) and Limma (Smyth, 2004) package, including normexp Background Correction, Loess Normalization, and Probe Summarization. Several probes were mapped into one gene, and the average value was used to represent the expression level of this gene. The differentially expressed genes (DEGs) between PCAT1 interfering (PCAT1-siRNA) cells and control-siRNA-treated cells were detected by using Limma package (Smyth, 2004). The DEGs were identified based on t-test and controlled by false discovery rate (FDR)—Benjamini and Hochberg procedure (Benjamini and Hochberg, 1995). FDR <0.01 and |log2Fold Change |≥1 were considered to be statistically significant.
2.3. Function enrichment analysis of DEGs
GO allows gene annotation in biological process, molecular function, and cellular component (Ashburner et al., 2000). KEGG pathway database is a public pathway-related database (Kanehisa and Goto, 2000). DEG involved biological function and pathways were analyzed by DAVID software. p Value <0.01 were considered statistically significant.
2.4. Gene annotation
The transcription factors (TFs) of DEGs were mined based on the TF information recorded in TRANSFAC database (http://transfac.gbf.de/TRANSFAC), an integrated collection for TFs, their DNA binding sites, and DNA-binding profiles. In addition, the widely accepted oncogenes and tumor suppressor genes were also annotated based on the information of TSGene (Zhao et al., 2013) and tumor-associated gene (Chen et al., 2013) database.
2.5. Protein–protein interaction network construction and subnetworks identification
To systematically explore the effect of interfering PCAT1 on LNCaP cells, the protein interaction pairs were collected from String database (Franceschini et al., 2013). Protein–protein interactions (PPIs) with combined score ≥0.9 and one DEG at least were selected to construct the PPI network. The subnetwork was further analyzed by BioNet package (Beisser et al., 2010) with the FDR value <0.001.
2.6. PCAT1 knockdown in LNCaP cells
The LNCaP cells were kindly provided by lyunbio company, Shanghai, China. Cells were cultured in 90% Roswell Park Memorial Institute (RPMI)-1640 media supplemented with 10% fetal bovine serum and 1% penicillin-streptomycin (PS) according to the standard conditions. Then, cells were transfected with PCAT1-siRNA oligos. The siRNA sequences were as follows, according the previous study: nontarget siRNA UUAAAGAGAUCCACAGUUAUU, siRNA 1 GCAGAAACACCAAUGGAUAUU, siRNA 2 AUACAUAAGACCAUGGAAAU, and siRNA 3 GAACCUAACUGGACUUUAAUU. The knockdown efficiency of PCAT1 expression was determined by quantitative PCR (qPCR).
2.7. Quantitative real-time (reverse transcription) RT-PCR analysis
RNA was isolated from PCAT1 knockdown LNCaP cells by TRIzol Kit (TAKARA, Japan). cDNA was synthesized by TaKaRa cDNA Synthesis Kit (TAKARA). The expressions of PCAT1, centromere protein F (CENPF), centromere protein E (CENPE), ID1, and ID3 were assessed by qPCR. PCR was performed in a total reaction volume of 20 μL, containing 10 μL SYBR Premix EX Taq (2 × ), 1 μL forward primer, 1 μL reverse primer, and 8 μL cDNA. The primer sequences are listed in Table 1. The reaction conditions were run as follows: 50°C for 3 minutes followed by 40 cycles of 95°C for 3 minutes, 95°C for 10 seconds, and 60°C for 30 seconds. The same experiments were performed in triplicate.
Primer Sequences
F, forward; R, reverse.
2.8. Statistical analysis
All the data were expressed as mean ± standard deviation and analyzed by SPSS 22.0 software. The comparison was conducted by t-test and significant difference was considered at p < 0.05.
3. Results
3.1. DEGs in prostate cancer cells with PCAT1 interfering
Differential gene expression analysis between PCAT1-siRNA group and control-siRNA group showed that 93 genes were identified to be differentially expressed at FDR <0.01. Of these DEGs, the expression of 35 genes were downregulated and 58 were upregulated (Supplementary Table S1).
3.2. Function enrichment analysis of DEGs
We performed GO and KEGG pathway analysis to explore the potential perturbed biological functions. As shown in Table 2, the KEGG pathway analysis of treatment group suggested that downregulated genes were significantly enriched in transforming growth factor-β (TGF-β) signaling pathway. Whereas upregulated genes were enriched in many pathways, such as pathways associated with body's immune system (RIG-I-like receptor signaling pathway and cytosolic DNA-sensing pathway), environmental sensing pathway (cytokine–cytokine receptor interaction), and metabolism pathway (porphyrin and chlorophyll metabolism). GO analysis showed that downregulated genes mainly take part in cell cycle and cell division-related functions, including kinetochore assembly, metaphase plate congression, G2/M transition of mitotic cell cycle, mitotic cell cycle spindle assemble checkpoint, negative regulation of osteoblast differentiation, and collagen metabolic process. Upregulated genes function was enriched in immune response, exogenous genetic material response, and viral response (Table 3).
Kyoto Encyclopedia of Genes and Genomes Pathway Enrichment Analysis for Downregulated and Upregulated Genes
Gene counts: the number of downregulated genes; p value <0.01.
KEGG, Kyoto Encyclopedia of Genes and Genomes; TGF-β, transforming growth factor-β.
Gene Ontology Analysis for Differentially Expressed Genes
Gene counts: number of downregulated or upregulated genes; p value <0.002.
dsRNA, double-strand RNA; GO, Gene Ontology.
3.3. Gene annotation
Two upregulated DEGs were annotated to be oncogenes, such as ISG15 (interferon-stimulated gene 15) and CDKN1C (cyclin-dependent kinase inhibitor 1C). Besides, two TF genes, including ID1 and ID3 (inhibitors of DNA binding protein 1 and 3) involved in cell proliferation, differentiation, and apoptosis regulation, were significantly downregulated in PCAT1-siRNA cells.
3.4. PPI network construction and regulation analysis
The PPI network connecting 559 nodes (12 downregulated genes, 30 upregulated genes, and 517 non-DEGs) are visualized in Supplementary Figure S1. The top 10 hub nodes in descending order were CENPF (degree = 102); CENPE (degree = 83); chemokine (C-X-C motif) ligand 10 (CXCL10, degree = 60); ISG15 (degree = 52); abnormal spindle homolog (degree = 51); CXCL11 (degree = 47); translocated promoter region (degree = 46); interferon-induced protein with tetratricopeptide repeats 1 (IFIT1, degree = 44); collagen, type IX, alpha 3 (degree = 39); and IFIT3 (degree = 36). Among these genes, CENPF and CENPE were significantly downregulated. Two acquired immune-related chemokines, CXCL10 and CXCL11, were significantly upregulated.
As shown in Figure 1, a CENPF-centered subnetwork was screened, which comprised 53 nodes. To gain further insights into the function of CENPF, we used KEGG pathway analysis to identify the significant pathways. The genes in the subnetwork were closely related with cell cycle, oocyte meiosis, RNA transport, mRNA surveillance, circadian rhythm-mammal, and progesterone-mediated oocyte maturation pathways (Table 4).
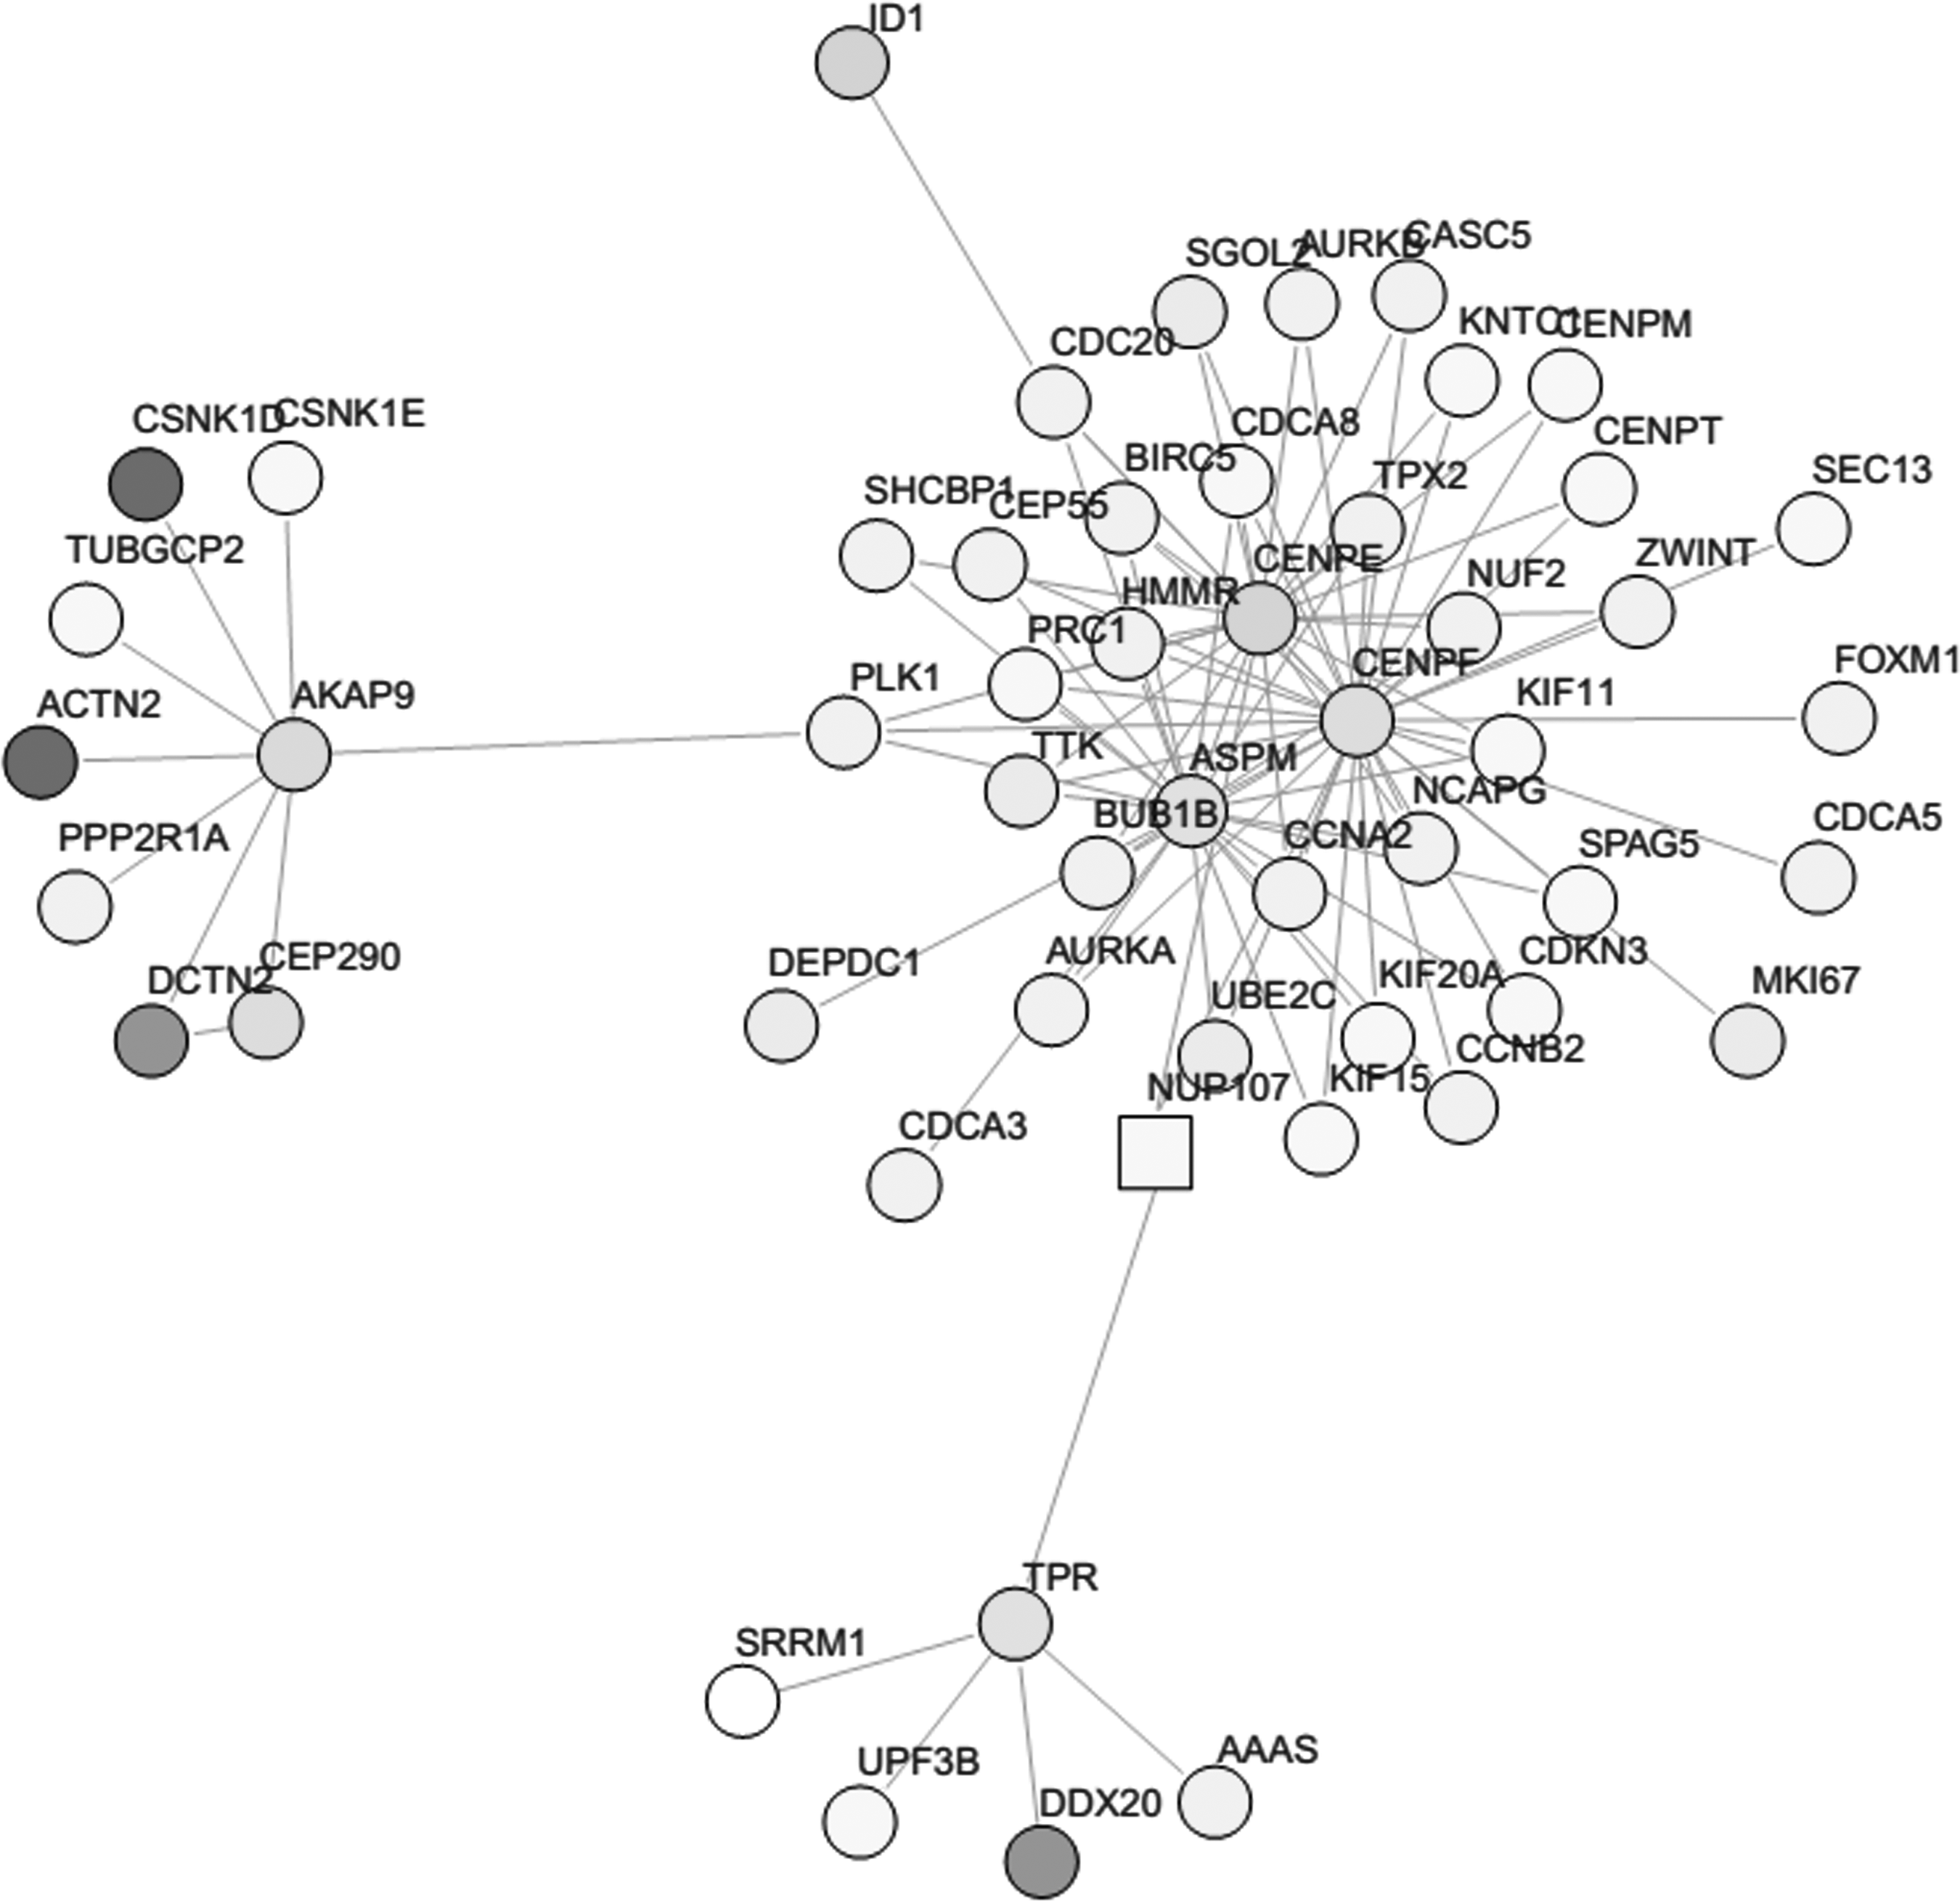
Subnetwork of protein–protein interaction network. The color of nodes is associated with fold change of differentially expressed genes. CSNK1D, ACTN2, DCTN2, and DDX20 were up-regulated targets; others were down-regulated targets. The circles and squares represent nodes with high and low degree in the subnetwork, respectively.
Kyoto Encyclopedia of Genes and Genomes Pathway Enrichment Analysis for Module-Related Differentially Expressed Genes
Gene counts: number of downregulated genes; p < 0.01.
mRNA, messenger RNA.
3.5. PCAT1 knockdown in LNCaP cells
The knockdown of PCAT1 expression was performed by siRNA oligos. Compared with nontarget siRNA (8.82. 0.41), the relative expression of PCAT1 interfered by three independent siRNAs were 3.81 ± 0.62, 9.24 ± 0.96, and 12.67 ± 2.67, respectively. The inhibitive rate of PCAT1 expression by siRNA-1 was significant (p < 0.01). Thus, LNCaP cells with PCAT1 knockdown interfered by siRNA-1 were used for further analysis (Fig. 2).
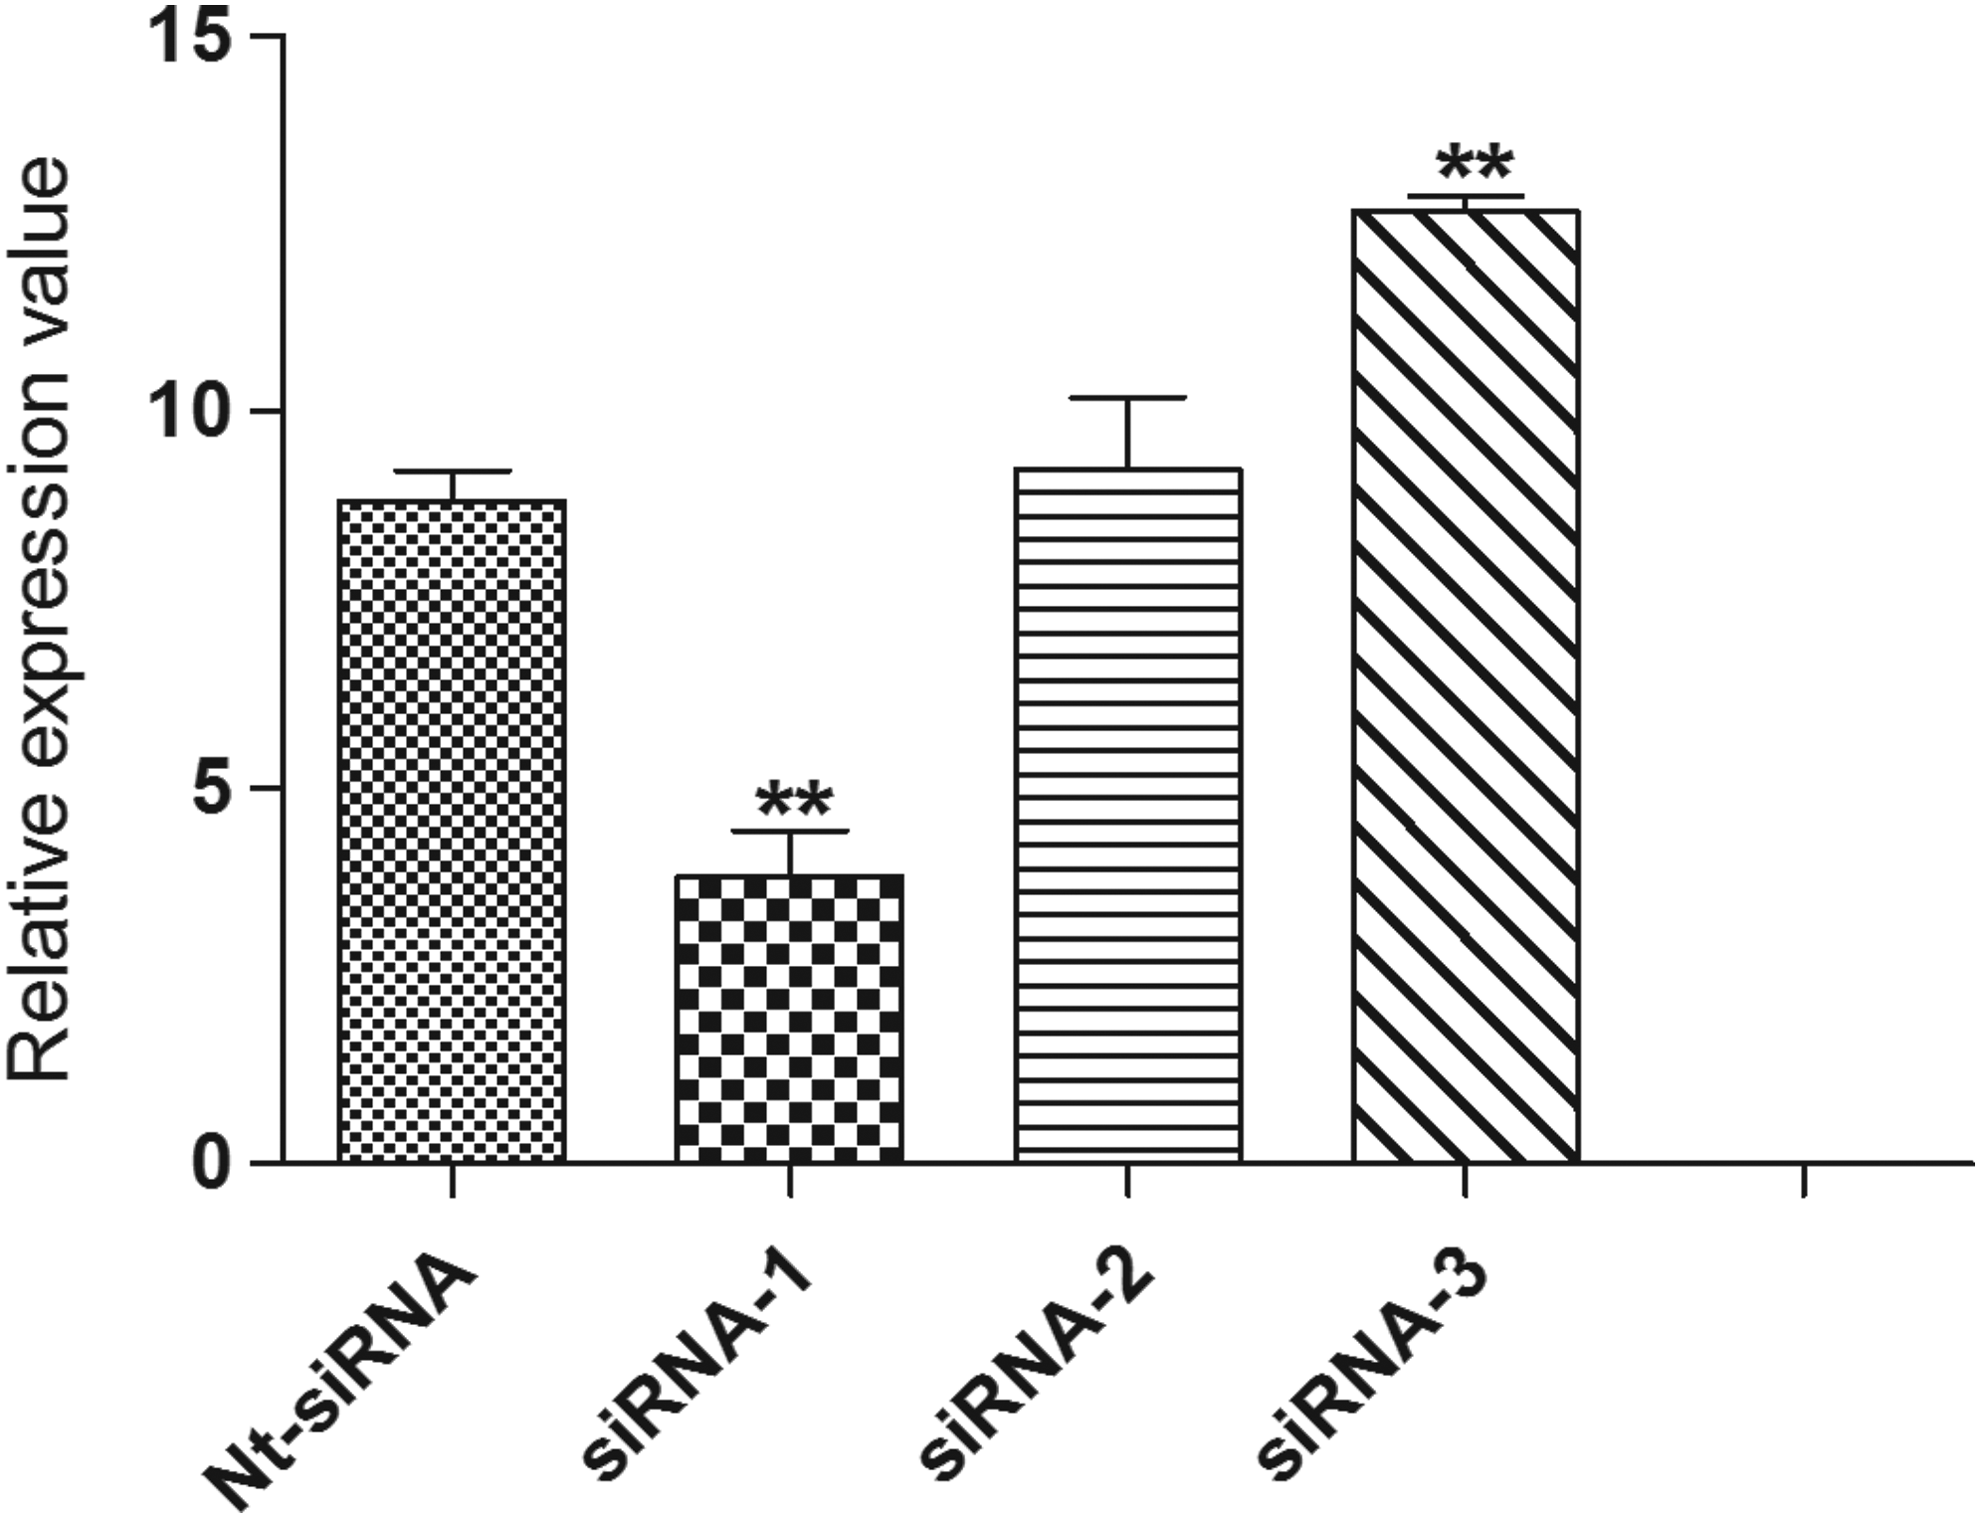
The relative expression of PCAT1 interfered by siRNA oligos. **p < 0.01. Nt, nontarget.
3.6. The expression of CENPF, CENPE, ID1, and ID3 after PCAT1 knockdown
To examine the interactions between PCAT1 and its target genes, qPCR analysis was performed to measure the expression of CENPF, CENPE, ID1, and ID3 after PCAT1 knockdown in LNCaP cells. Consistent with the bioinformatic analysis, we found that after PCAT1 knockdown, the expression of CENPF was significantly decreased in LNCaP cells (p < 0.05). The expressions of ID1 and ID3 were also declined after PCAT1 knockdown, although the difference was not significant. There was a comparable expression of CENPE in LNCaP cells before and after PCAT1 knockdown (p > 0.05; Fig. 3).

The expression of CENPF, CENPE, ID1, and ID3 after PCAT1 knockdown. *p < 0.05. NC, cells treated with nontarget siRNA; si-PCAT1, cells with PCAT1 knockdown by siRNA-1.
4. Discussion
LncRNAs are served as the novel markers, play critical role in tumor progression. PCAT1 has been recently discovered as a novel lncRNA in the prostate cancer. However, the role of PCAT1 in prostate cancer has not been clarified clearly. In this study, gene expression profiles in PCAT1 silenced prostate tumor cells were generated in the previous study (Prensner et al., 2011b). GO and KEGG pathway analysis showed that the downregulated genes in silencing PCAT1 tumor cells were enriched in cell cycle and cell division-related functions, whereas the upregulated genes were significantly enriched in immune response. Subnetwork analysis identified CENPF as the hub protein, which is involved in several functional terms such as cell cycle, RNA transport, and mRNA surveillance pathway.
CENPF and CENPE (also known as mitosin) are named for its association with the centromere–kinetochore protein complex (Feng et al., 2006) and specifically localize to the outer kinetochore plate during prophase. It has been reported that CENPE participants in efficient capture and attachment process of spindle microtubules and silencing CENPE causes chromosome mis-segregation and mitotic delay (Tanudji et al., 2004). However, CENPF functions are not very clear; recent studies show that it regulates cell mitosis and cellular proliferation mediated partly by protein interactions (Ma et al., 2006). Moreover, it has been reported that human CENPF mRNA is closely linked to the abnormal cell proliferation in malignant conditions (Shigeishi et al., 2005). By assembling genome-wide regulatory interactions for human and mouse prostate cancer, Aytes et al. (2014) have identified forkhead box M1 and CENPF as the drivers of prostate cancer malignancy, and these interactome functions synergistically promote tumor growth by regulating target genes expression and activating key signaling pathways associated with malignancy. Meanwhile, CENPF is upregulated and is used as a prognostic indicator for primary breast cancer (Ueda et al., 2008).
Functional studies have suggested that CENPF is constantly overexpressed in hepatocellular carcinoma (HCC) and plays an important role in driving HCC tumorigenesis. Silencing CENPF leads to cell cycle arrest at G2/M checkpoint by downregulating cell cycle proteins Cdc2 and cyclin B1. Thus, CENPF is used as a G2-specific marker protein (Kao et al., 2001; Dai et al., 2013). In addition, CENPF knockdown triggers chromosomes decondensation before anaphase, and overexpression of CENPF mutants alters nuclear chromatin organization (Du et al., 2010). In this study, when PCAT1 expression was silenced by RNA interference, CENPF was significantly downregulated and was identified as the core gene in PPI subnetwork module that was closely related with RNA transport, cell cycle, and oocyte meiosis pathways. These results suggest that PCAT1 may have a regulatory role in the expression of CENPF. Silencing the regulator function of PCAT1 leads to reduced CENPF expression and subsequently inhibits the carcinogenesis by disrupting its downstream functions or signaling pathways related to cell cycle through chromosomes decondensation or downregulating cell cycle proteins Cdc2 and cyclin B1 in prostate cancer cells.
In addition, two transcriptional regulatory factors, ID1 and ID3, were downregulated in this study. ID family proteins, ID1 to ID4, are essential in many processes, such as cell differentiation, cell cycle progression, proliferation, and migration (Norton and Atherton, 1998). Deregulated ID expression was found in many tumors, such as ovarian cancer, breast cancer, and prostate cancer (Wang et al., 2004). Among the four ID proteins, ID1 and ID3 are extensively overexpressed in various tumors. For instance, overexpression ID1 leads to breast cancer cells invasion and cell proliferation by inducing the expression of MT1-MMP protein and by inducing inactivation of p16INK4a/pRB pathway. Besides, EGF-R and nuclear factor-κB were also activated when ID1 was overexpressed in prostate cancer cells, and ID1 expression can make cancer cells escape chemotherapeutic drug-induced apoptosis by regulating the Raf-1/MAPK and JNK pathways (Ouyang et al., 2002; Ling et al., 2006). Moreover, studies in mice have shown that ID1 and ID3 knockdown can inhibit angiogenic processes, tumor progression, and metastasis (Sakurai et al., 2004).
Recently, Fong et al. (2003) have demonstrated that disrupting ID1 expression by antisense technology in breast cancer can inhibit cells invasiveness and the ability to metastasize in vivo. Ling et al. (2005) has also indicted that downregulation of ID1 may be used as a novel target to inhibit the growth of metastatic cancers by suppression of angiogenesis, which is activated by vascular endothelial growth factor. Meanwhile, at the molecular level, silencing ID1 or ID3 can attenuate cell cycle through attenuating cyclin-dependent kinase inhibitor CDKN1A (p21) or CDKN1B (p27; Sharma et al., 2012). Similarly, in our result, when PCAT1 was silenced both ID1 and ID3 were significantly downregulated and were enriched in TGF-β signaling pathway, which affects cell proliferation, differentiation, apoptosis, and adhesion. Therefore, considering our results, we suggest that in the proliferation of prostate cancer cells, a complex containing PCAT1, ID1, ID3, cyclin-dependent kinase inhibitor, and TGF-β may be assembled. Silenced PCAT1 may disrupt TGF-β and its downstream signaling pathways through decreasing the expression of ID1 and ID3 proteins, which thereby regulate cell proliferation by breaking cellular processes through inhibiting the binding of TGF-β to cell surface receptors (Fang et al., 2014).
To examine the interactions between PCAT1 and its targets, we evaluated the expression of CENPF, CENPE, ID1, and ID3. First, we constructed the PCAT1 silencing cell model and found siRNA-1 resulted in the significant inhibitive rate of PCAT1 expression, which was consistent with the previous study (Prensner et al., 2011a). Based on qPCR analysis, we found a consistent decrease of CENPE, ID1, and ID3 expression after PCAT1 silencing by siRNA oligos. However, the consistent decreased expression of CENPF was not observed, which should be further assessed in clinical tissue samples.
In summary, PCAT1 plays an important role in the cell cycle and proliferation of prostate cancer cells by mediating the expression of CENPF, CENPE, ID1, and ID3. Thus, interfering PCAT1 may provide a novel strategy for the prevention and treatment of prostate cancer. However, more evidence in vivo is needed to evaluate the potential application.
Footnotes
Acknowledgments
The project was sponsored by the Scientific Research Foundation for the Returned Overseas Chinese Scholars, State Education Ministry (SRF for ROCS, SEM) under grant 3C109M753430.
Author Disclosure Statement
The authors declare there are no financial conflicts of interest.
References
Supplementary Material
Please find the following supplemental material available below.
For Open Access articles published under a Creative Commons License, all supplemental material carries the same license as the article it is associated with.
For non-Open Access articles published, all supplemental material carries a non-exclusive license, and permission requests for re-use of supplemental material or any part of supplemental material shall be sent directly to the copyright owner as specified in the copyright notice associated with the article.