
Abstract
Abstract
Predicting the location of the translation initiation sites (TIS) is an important problem of molecular biology. In this field, the computational cost for balancing non-TIS sequences is substantial and demands high-performance computing. In this article, we present an optimized version of the K-modes algorithm to cluster TIS sequences and a comparison with the standard K-means clustering. The adapted algorithm uses simple instructions and fewer computational resources to deliver a significant speedup without compromising the sequence clustering results. We also implemented two optimized parallel versions of the algorithm, one for graphics processing units (GPUs) and the other one for general-purpose multicore processors. In our experiments, the GPU K-modes's performance was up to 203 times faster than the respective sequential version for processing Arabidopsis thaliana sequence.
1. Introduction
Several research problems required the use of techniques and algorithms that need substantial computational effort. A field with many such problems is Bioinformatics, a multidisciplinary area that employs statistical, mathematical, and computational techniques to solve biology problems. In molecular biology, one problem of great interest that has a high computational effort demand is the prediction of translation initiation sites (TIS) in mRNA sequences. In eukaryote cells, the start of protein translation happens when the ribosome is connected to the mRNA and finds an AUG codon (methionine) with a suitable context for the start of the translation process. So, only a part of the mRNA transcript contains the information that will be translated into proteins. This region is called the CoDing Sequence. When the AUG codon is found in an appropriate context, the ribosome starts to express the codons in the protein by a peptide chain. The protein translation process is finalized when a stop codon (UAG, UAA, or UGA) is found. According to Kozak (1984), the translation usually starts at the first AUG codon of the mRNA sequence. However, the start of a translation can also appear in a different codon (Hatzigeorgiou, 2002). Thus, this process of translation initiation identification is a complex task.
In this context, machine learning techniques have been employed on the TIS identification task. This is performed by constructing classification or prediction models considering TIS (AUG that starts translation) and non-TIS sequences (AUG that does not start translation) as instances in a data set. Then, the created classification model estimates whether an AUG has the appropriate context to start the translation of the protein. In TIS identification problems, the learning process faces an inherent class imbalance issue of TIS and non-TIS sequences. This happens because, in most cases, each mRNA molecule contains only one AUG that synthesizes protein (TIS). Normally, all other AUGs are not translation initializers (non-TIS). This scenario causes problems in the use of several machine learning algorithms, which are significantly affected by class imbalance.
In general, to address the class imbalancing problem, two approaches are known: oversampling, which is based on replicating instances of the minority class, and undersampling, wherein the balancing is achieved by eliminating instances of the majority class. This instance replication or elimination can occur randomly or by applying heuristics. The latter is more indicated because replicating data can cause overfitting in classifiers, and removing significant instances can reduce their predictive accuracy, so some care should be employed when performing instance undersampling and oversampling (Batista et al., 2004). To address this problem, Silva et al. (2011) and Rodrigues et al. (2012) have proposed a heuristic undersampling approach based on clustering technique. The authors considered for training the TIS and non-TIS sequences, extracted with 10 and 30 nucleotides in the upstream (before AUG codon) and downstream (after AUG codon) regions, respectively, along with other conservative features extracted from molecule. Their results showed that the approaches achieved more accurate classifications. However, the methodology adopted requires the use of the K-means clustering algorithm for the balancing problem, which did not have an efficient computational performance.
The balancing technique proposed by Silva et al. (2011) and Rodrigues et al. (2012) searches a subset from majority class containing the most representative sequences. The approaches employ the K-means algorithm to cluster the majority class, where the number of clusters (K) corresponds to the number of sequences of the minority class. To speed up the process, Rodrigues et al. (2012) presented a parallel and distributed solution of K-means algorithm using the MPI (message passing interface) and OpenMP (Open Multi-Processing) libraries, whereas Silva et al. (2011) used the sequential version of the algorithm. Although the algorithm presented by Rodrigues et al. (2012) has reached a substantial speedup when compared with the sequential algorithm, the execution time is still considered high. Thus, this work presents an alternative coding using the K-modes algorithm to solve the imbalance problem in the TIS context with improved computational efficiency. In accordance with Silva et al. (2011) and Rodrigues et al. (2012), who proposed an undersampling technique, this work proposes efficient clustering algorithms to support the class imbalancing problem.
Therefore, this article presents an optimized version of the K-modes clustering algorithm, employed to balance a data set of TIS and non-TIS nucleotide sequences. In addition, we evaluate and compare our results with those obtained by the K-means algorithm, used by Rodrigues et al. (2012). Our proposal makes uses of simple instructions and fewer computational resources to get a significant speedup. To improve the performance, we also implemented two parallel versions of the K-modes algorithm for graphics processing units (GPUs) and multicore computer clusters. Therefore, our contributions are the following:
An adapted K-modes algorithm to cluster sequences in the context of TIS prediction. For this adapted version, we can highlight: the use of Hamming distance, a binary representation for sequences, and reduction of operations by removing an inner loop. Parallel K-modes versions
1
for multicore computer clusters and GPU computing. A computing performance comparison between the K-modes and K-means algorithms for the TIS prediction context.
This article is divided into the following sections: Section 2 presents the theoretical foundation of the TIS prediction problem and related work on applications of K-means and K-modes algorithms. Section 3 presents the parallel techniques used in the clustering algorithms. Sections 4 and 5 present methods and results, respectively, and Section 6 presents our conclusions.
2. Background and Related Work
2.1. Translation initiation site
The scanning model in eukaryotes starts the link between the ribosome and the mRNA on the 5′ region, reading the codons in the direction of the 3′ region, for translation. The following concepts and definitions about the translation process are relevant to this study: (1) The upstream region (nucleotides before the start codon), (2) the downstream region (nucleotides after the start codon), and (3) the phase of mRNA molecule reading. The model is shown in Figure 1.
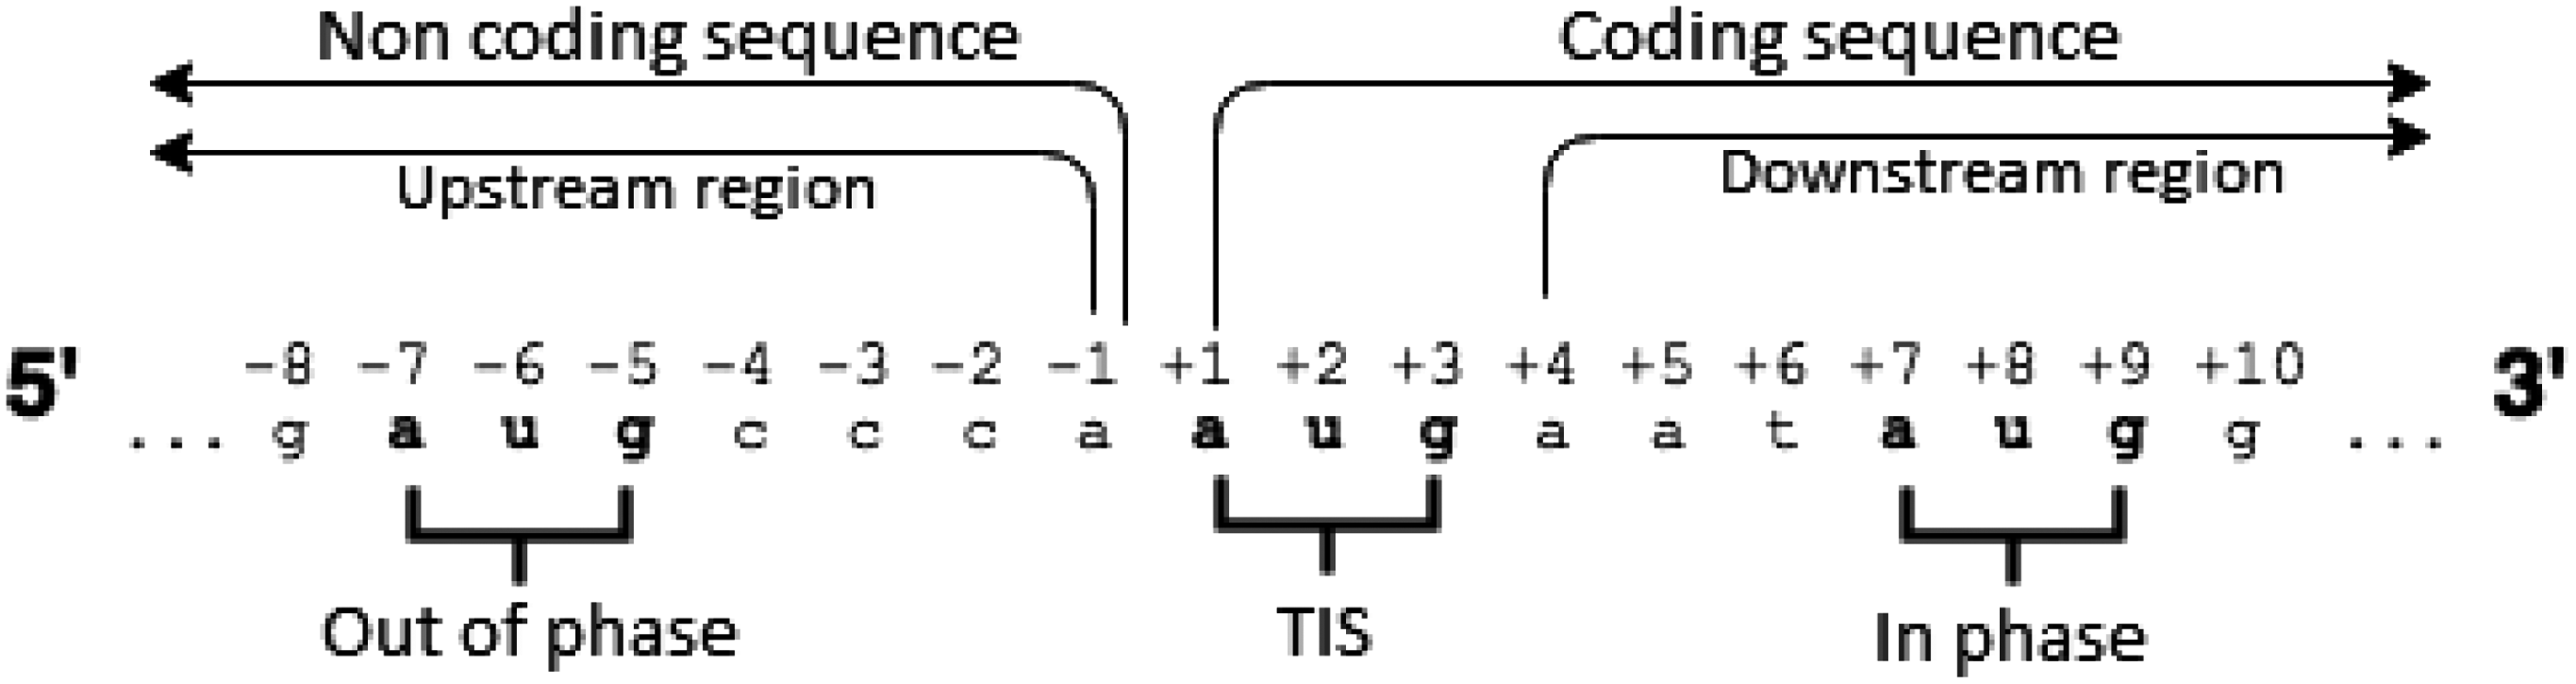
Scanning of mRNA molecule of eukaryotic cell.
Kozak (1984) identified some conservative positions relative to the TIS. The position −3 presents a purine, where the nucleotide is either an adenine (A) or a guanine (G) in 79% of the cases. In the positions −1, −2, −4, and −5, the nucleotide C (cytosine) is more common. These conservative positions are called the Kozak consensus.
2.2. Parallel and distributed algorithms
In data mining, the K-means is one of the most widely used clustering algorithms. Its standard implementation cannot be applied to categorical data because of the distance function used (Euclidean) and the use of the mean to represent the centroids of the groups.
The K-modes algorithm modifies the standard K-means to enable categorical data clustering, replacing the Euclidean distance function with a simple measure of similarity and using mode instead of the mean to represent the centers of each group. The iterative clustering process is not essentially altered, thus the efficiency of the clustering is maintained, ensuring convergence to a local minimum.
The K-means algorithm is widely used in clustering applications for Bioinformatics problems. For instance, similarity in protein models (Jamroz and Kolinski, 2013), gene prediction (Liu et al., 2013; Díaz et al., 2014), and validation of gene expression in microarrays (Dysvik and Jonassen, 2001; Yeung et al., 2001). These problem domains are characterized by the use of large volumes of data. In this context, parallel implementations of the algorithms become mandatory to achieve high-performance computing. The methodology discussed in the study by Rodrigues et al. (2012) is based on a hybrid approach focused on shared-memory (OpenMP programming) and message-passing (MPI programming) models. However, most successful techniques in the modern implementations of the parallel K-means are using GPUs (Wu et al., 2009).
In our work, we present two parallel versions of the K-modes algorithm: one using CUDA (Compute Unified Device Architecture) for GPUs and other using MPI/OpenMP for clusters of parallel computers. CUDA is an application programming interface (API) and platform that enables the execution of parallel codes in Nvida GPUs (Ryoo et al., 2008). Despite the fact that the code executed in parallel inside the GPU is ran using shared memory, the data have to transfer between the host and the device (GPU) and vice versa.
The MPI is a message-passing application programmer interface with protocols and semantic specifications for how its features must behave in any implementation (Gropp et al., 1996). Although currently the MPI specifications and some of its implementations offer support to shared memory, MPI programs are frequently written using distributed memory, in which some implementations use shared memory for message transfer if it is available. The OpenMP API uses an ensemble of directives, and the compiler generates parallel code based on those directives. OpenMP applications use shared memory for exchanging data (Dagum and Menon, 1998).
2.3. Related work
The clustering process often involves a large volume of data. Due to that and the K-means algorithm's popularity, several studies proposed parallel versions for that algorithm, with some implementations using technologies available in the market since the 90s (Kantabutra and Couch, 2000) and others employing more recent technologies (Kang and Park, 2015; Saffran et al., 2017; Baydoun et al., 2018; Souza et al., 2018). Although fewer studies work with the K-modes algorithm, their implementations are very similar, but different in the metrics used for distance calculations and in the centroid updating step.
Even recent framework such as the Hadoop has already been employed in a K-means implementation. Kang and Park (2015) used K-means implementation in Hadoop to group 128,000 instances in 64 clusters, and the algorithm execution took 112 seconds, contrasted with the 1618 seconds of the sequential algorithm. Similarly, the K-modes implementation in Hadoop in Tao et al. (2015) reached a six times speedup when compared with the sequential algorithm.
Despite parallel implementations achieving satisfactory results using the Hadoop technology, the greatest speedups found in the recent literature make use of GPUs. In these implementations, CUDA has been frequently used. One of the first such studies, Hong-tao et al. (2009), achieved a 40 times speedup when compared with the sequential implementation of the algorithm. When comparing a GPU implementation to an already optimized parallel K-means implementation for central processing unit (CPU), Wu et al. (2009) achieved 10 times faster execution to cluster a billion of instances. In another study, Li et al. (2010) used a GPU cluster capable of optimizing memory access in graphic units, reducing access to the global memory. They reached a six times speedup clustering 51,200 instances compared with CPU processing.
Unlike other recent studies on GPU implementations, Dhanasekaran and Rubin (2011) have developed a K-means implementation using the OpenCL (Open Computing Language) library. They used an ATI Radeon® HD 5870 GPU and obtained a 35 times speedup when compared with an OpenMP algorithm version. In the same way, other researches (Cong et al., 2018; Souza et al., 2018; Xu et al., 2018) focus on OpenCL to run K-means on GPUs and field programmable gate arrays (FPGAs). Due to the reconfigurable characteristics, FPGA devices present a high speedup, such as the results shown by Xu et al. (2018) that achieved up to 7.76 times more performance than a software version.
Although the MPI library being older than CUDA and OpenMP, it is still widely studied due to its robustness and reliability, often along with other libraries such as the OpenMP (Saffran et al., 2017). For instance, an older work proposed by Kantabutra and Couch (2000) showed that a simple master-slave implementation of K-means algorithm ran 11 times faster than its original implementation.
Rao et al. (2009) presented a parallel K-means implementation using only OpenMP, and it achieved a 50% reduction in execution time compared with a sequential version. The hybrid MPI/OpenMP K-means implementation presented by Waghmare and Kulkarni (2010) was superior to find the Convex Hull Scan of a data set in comparison to nonhybrid versions that used either MPI or OpenMP individually.
Similarly, Rodrigues et al. (2012) proposed a hybrid version of the K-means algorithm for mRNA sequence clustering. Their experiments showed a speedup of up to 23 times when compared with the original sequential implementation. Unlike most studies involving parallel algorithm implementations, the authors worked with a real data set, collecting their data from the RefSeq data repository (Pruitt and Maglott, 2001).
Table 1 presents the cited studies in chronological order, in function of their approach, and includes our own proposal for comparison. As shown in this session, many different approaches can be used to reduce execution times and clustering quality. Our study aims to improve the work proposed by Rodrigues et al. (2012) replicating their experiments in a similar environment and compare their results with K-modes implementations in different parallel architectures: CUDA for GPUs and hybrid MPI/OpenMP for computer clusters. Moreover, it is important to notice that our work is the only one to propose K-modes to cluster sequences in the context of TIS prediction improving the performance considerably.
Related Work Implementations
CUDA, Compute Unified Device Architecture; MPI, message passing interface; OpenCL, Open Computing Language; OpenMP, Open Multi-Processing.
3. Proposal of the K-Modes Parallel Algorithm
3.1. Computational cost
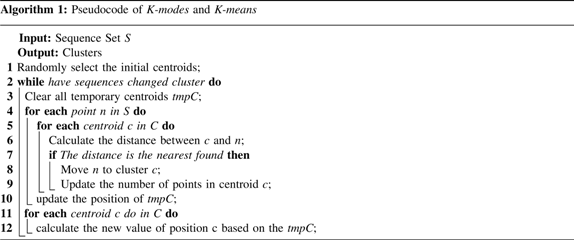
Both K-means and K-modes can be defined as shown in Algorithm 1. The difference between them is expressed in lines 6 and 12, where the distance between the instances is calculated using the Hamming distance (line 6) instead of the Euclidean distance. The centroid position is updated based on the mode instead of the mean (line 12), where tmpC is an auxiliary struct (an array of integers) that counts the number of active bits in each position of the centroid. To reduce the computational cost in the distance calculation (line 6), we used the hamming distance to measure the dissimilarity between the mRNA sequences. Additionally, the sequences were codified in binary using the method described by Stormo et al. (1982), where A = 1000, C = 0100, G = 0010, and U = 0001. Table 2 shows the binary representation of the ACG and AUG sequences and how the distance between them is calculated.
Distance Between Sequences
Bold numbers highlight the different bits used to calculate the distance.
The centroid value is represented by a synthetic sequence, where each bit is composed of the mode of the most activated bit in a 4-bit window (a nucleotide). Figure 2 shows a centroid calculation example of a group composed of the sequences AGG, GCG, and AAG. When the clustering process is concluded, we selected the closest sequence to each cluster centroid. Those selected sequences are the most representative non-TIS sequences of each cluster, which will be used in the support vector machines (SVM) classifier (Hearst et al., 1998) to better predict the TIS sequences. To store the sequence, in contrast to Rodrigues et al. (2012), who chose a char array, we used a struct with three integers (64 bits) to store the sequences (totaling 192 bits per sequence).
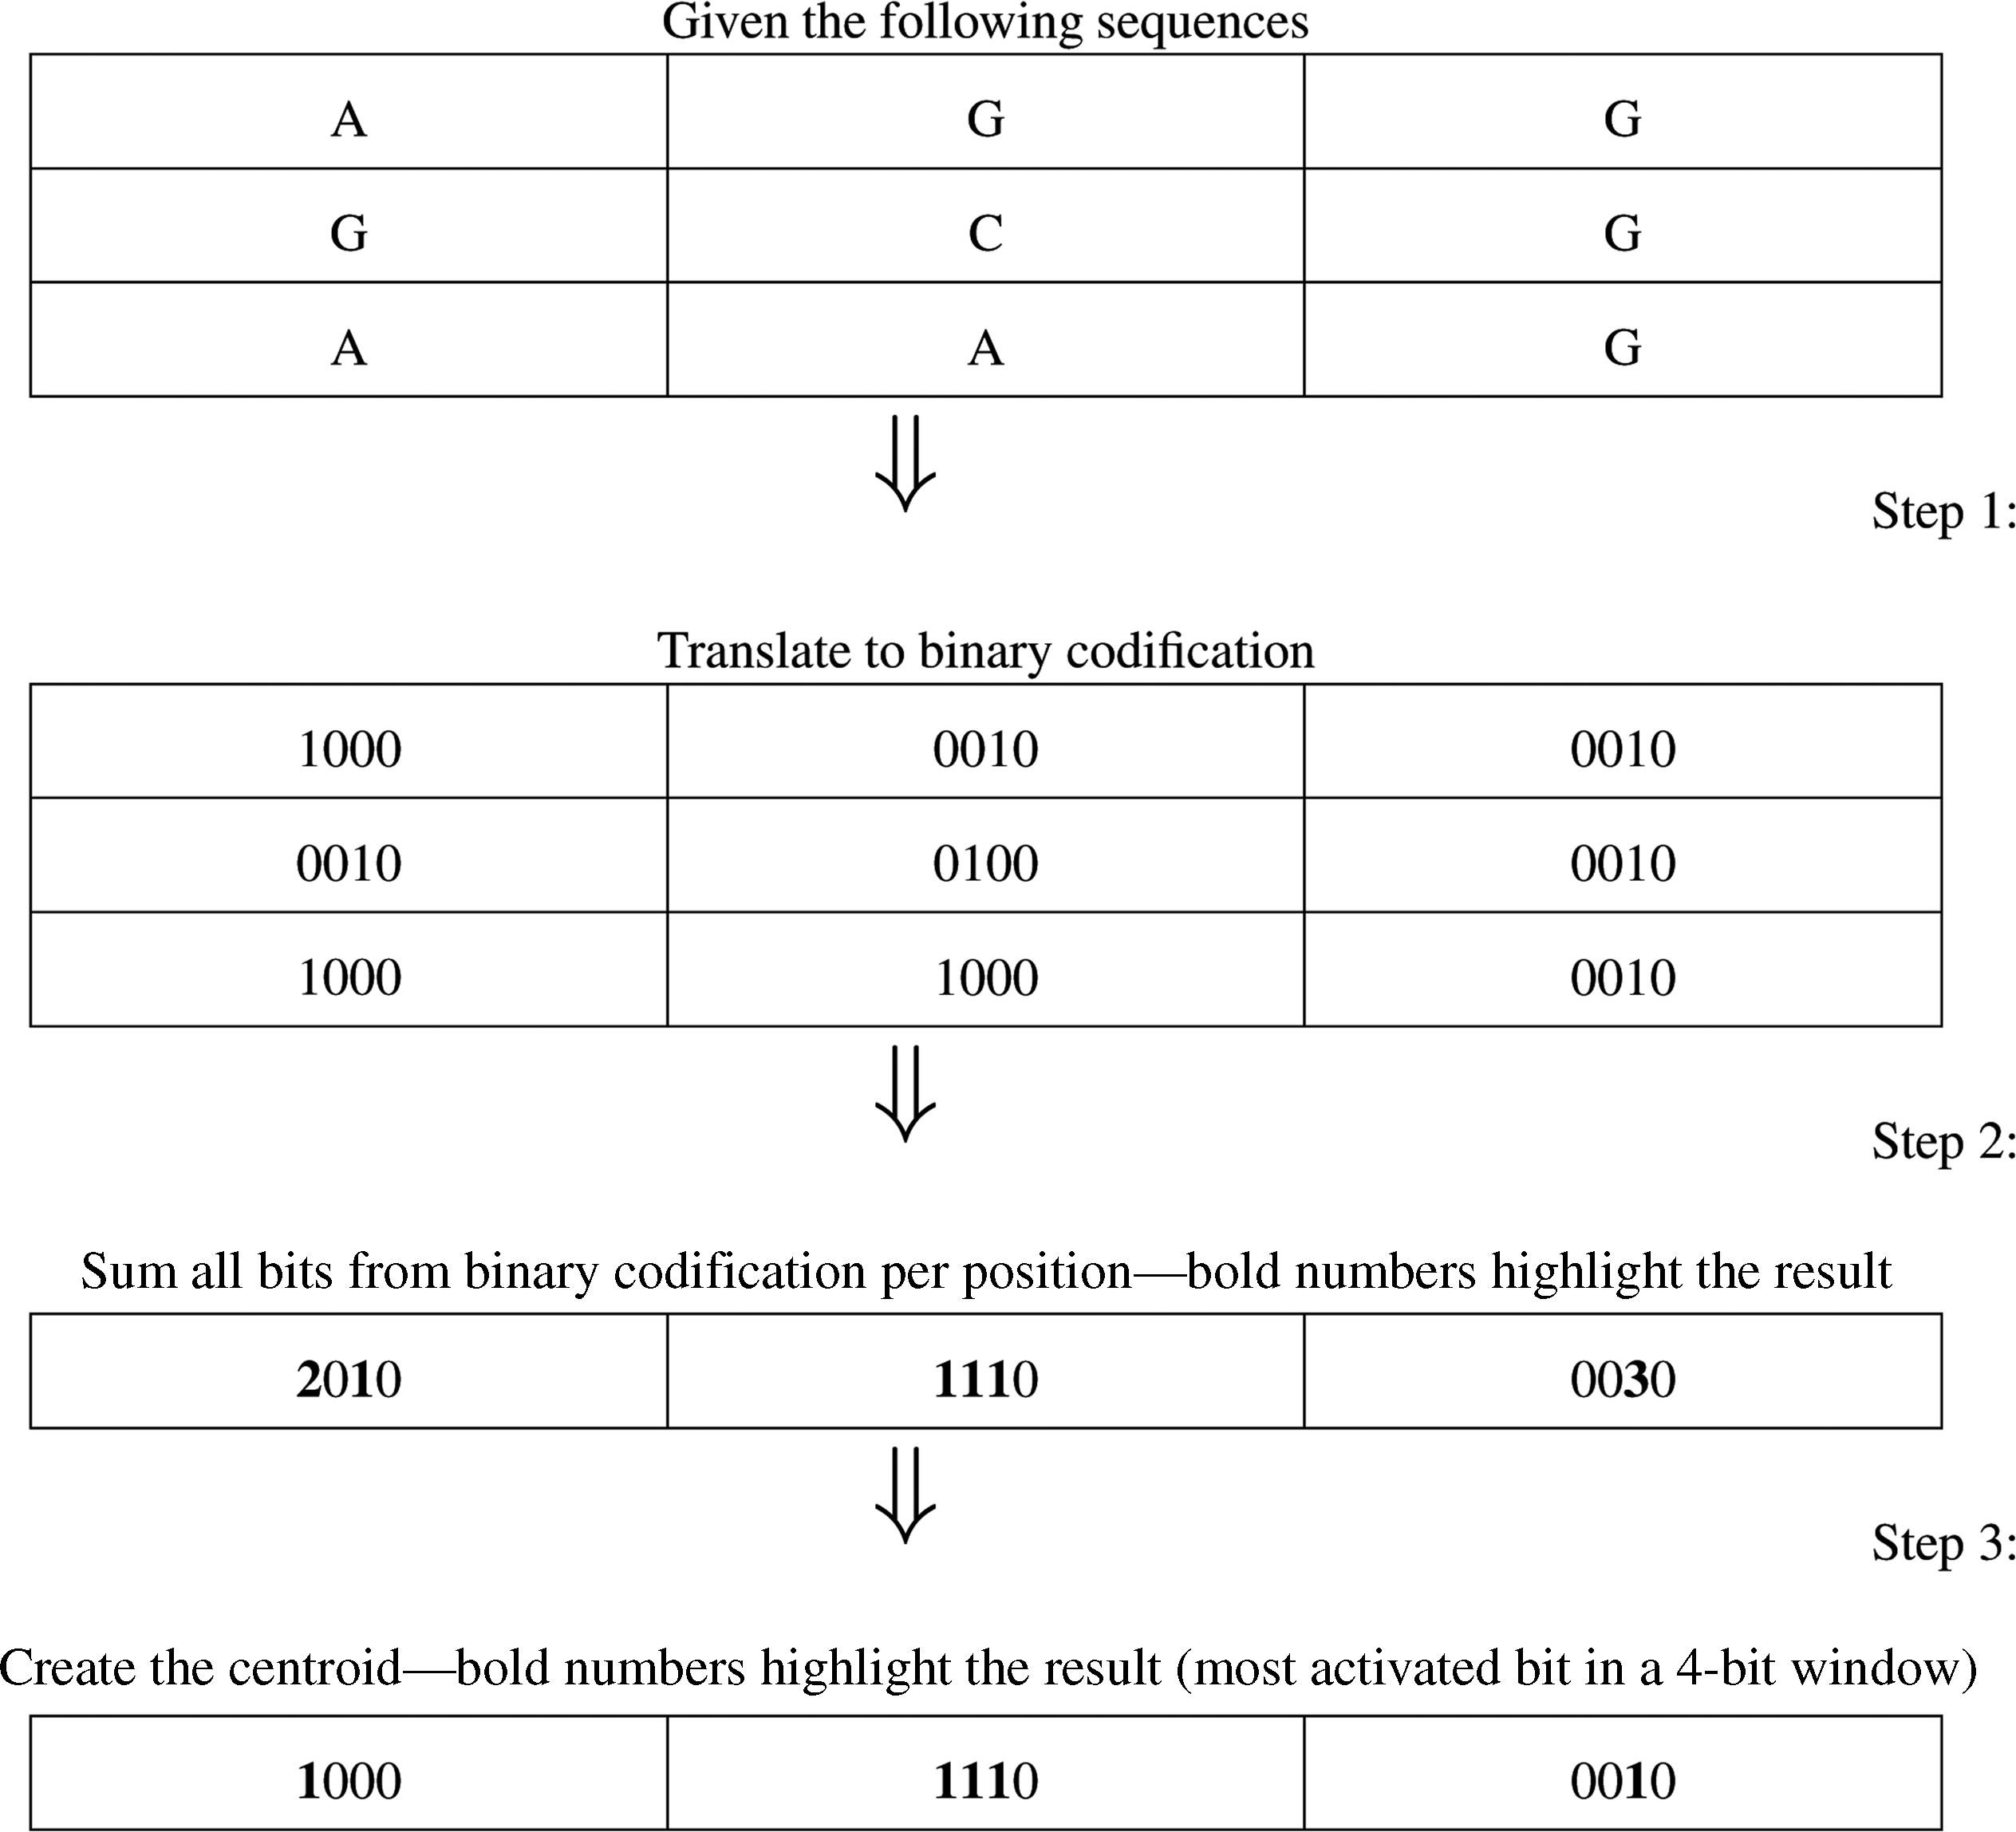
Example of a centroid calculation.
The use of this struct reduces the computational cost of the distance calculating by removing an inner loop, reducing the number of operations. With only three XOR operations, we can evaluate the distance between the sequences (Table 2) substantially reducing the operations needed for this evaluation. Furthermore, all floating-point operations have been replaced by integer operations, which are more efficient. Given the operations performed to calculate the distance and update the centroids as a unit of computational cost, it is possible to express the computational cost of the K-means and K-modes algorithms as presented in Equations 1 and 2, respectively,
where k is the number of centroids to be obtained, p is the number of points of the data set (number of instances), d is the dimension of the data set (number of attributes), and l is the size of the integer in a given architecture. Therefore, using the K-modes instead of K-means in this TIS prediction context incurred in a significant reduction in the number of operations to be performed.
3.2. Parallel loops
The K-means and K-modes algorithms can easily be implemented in parallel. We focused on the loop responsible for calculating the distance between the points and the centroids, and the loop responsible for updating the centroids values, as those are the parts that most affect the algorithm's performance. Furthermore, they do not have many data dependencies, which simplify the parallel implementation using atomic operations, without reducing the performance.
3.3. GPU K-modes
GPUs are most effective when the data are granular because they are capable to do thousands of calculations simultaneously. Thus, we choose to implement the distance calculation and the centroid calculation in GPU. The part of the code that runs on GPUs is called the kernel. Algorithm 2 is the pseudocode of the kernel implemented in CUDA. In this code, tmpC is an auxiliary struct (an array of integer) that counts the number of active bits in each position of the centroid (represented by step 2 in Algorithm 2). Delta represents the number of sequences that had their cluster changed in a given iteration.
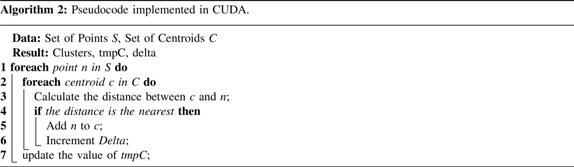
The kernel is responsible for calculating the distance between the instances and the cluster centroids. The kernel has two stop conditions: one in line 6, where we calculate the number of points which have their centroid changed, and the other one is in line 7, where we calculate the sum of all active bits presented in the centroid. The two stop conditions are arithmetic, solved by using the atomicInc function from the CUDA API. Minimizing the data transfer between host and device is essential to achieve a good performance in CUDA (Ryoo et al., 2008). For this reason, we stored all data used by the kernel in the device memory, so the algorithm does not need to transfer the data again to the device in the next iteration. One exception is the Delta variable because the host needs to access it in all iterations.
4. Methods
This section shows the method to evaluate the parallel algorithms in the context of the TIS prediction problem. This way we highlight the following content: databases, the class balancing process, the computational environment, the evaluation metrics of the SVM classifier, and the developed parallel version.
4.1. Database description
The databases used in our experiments were extracted from the public repository RefSeq (Pruitt and Maglott, 2001) from the National Center for Biotechnology Information (NCBI). 2 Our study is based on the following organisms: Arabidopsis thaliana (AT), Caenorhabditis elegans (CE), Drosophila melanogaster (DM), Homo sapiens (HS), Gallus gallus (GG), Mus musculus (MM), and Rattus norvegicus (RN). Each molecule was identified according to its inspection level and classified as: Model, Inferred, Predicted, Provisional, Reviewed, Validated, and WGS. 3 In this work, we have considered only mRNA molecules with inspection level Reviewed since those underwent a thorough reviewing process that better ensures their reliability.
The procedure for extracting TIS and non-TIS sequences followed the methodology proposed by Silva et al. (2011). We collected the sequences from the upstream and downstream mRNA regions and out of reading frame. In accordance with the best result obtained in Silva et al. (2011), for each AUG of the mRNA molecule, we considered 10 nucleotides in the upstream region and 30 nucleotides in the downstream region (Fig. 1). Table 3 shows the number of TIS and non-TIS sequences extracted for each organism with the proportion between these two classes, which show the class imbalancing issue.
Extracted Sequences
AT, Arabidopsis thaliana; CE, Caenorhabditis elegans; DM, Drosophila melanogaster; GG, Gallus gallus; HS, Homo sapiens; MM, Mus musculus; RN, Rattus norvegicus; TIS, translation initiation sites.
4.2. Class balancing
To address the class imbalancing issue (Table 3), we chose to do an undersampling of the majority class. This process was performed using the proposed K-modes clustering algorithm to select the most representative instances of the each cluster of instances from majority class (non-TIS). To define the number of clusters, we used the number of instances in the minority class, so the process results in equal number of instances of each class.
The balancing process occurred during the 10-fold cross validation (Kohavi, 1995), in which the data set was divided into 10 subsets. Nine subsets were used for training, whereas only one was used for validation. We applied the balancing in each fold for each training process. This process was repeated 10 times, and after the final repetition, the average performance and standard deviation were calculated.
4.3. SVM parameter definition
A SVM classifier was used to predict the TIS and non-TIS sequences. The SVM is a machine learning algorithm that can be used for both classification and regression problems. In this approach, each training sequence is represented as a point in the n-dimensional space and the algorithm works with the objective of finding the hyperplane that best distinguishes (separates) the analyzed classes.
The classifier's efficiency depends on an appropriate selection of the parameters of its kernel function and on a margin of separation of the optimal hyperplane, represented by C. We used the same parameters defined by Silva et al. (2011) and Rodrigues et al. (2012), that is, a fourth-order polynomial function was adopted and the trade-off between training error and margin was 1.0.
4.4. Test environment
The GPU experiments were executed on a computer with an Intel Core i5 2.7 GHz, 16GB of RAM, and an Nvidia GeForceGT 640M with 512 MB. The other experiments were executed in a cluster SGI Altix at the Centro Nacional de Supercomputação (CESUP). 4 Our cluster hardware contains 64 GB of RAM and 2 dodeca core AMD Opteron, totalizing 36 cores. This configuration intent to mimic the same test environment used by Rodrigues et al. (2012).
4.5. Performance measures
Five metrics were used to evaluate the SVM classifier: accuracy (Ac), precision (Pr), sensitivity (Se), specificity (Sp), and adjusted accuracy (Adj). To evaluate the performance of the parallel versions of the K-means and K-modes algorithms, we used the metric speedup (Sd).
The accuracy (Eq. 3) shows the rate of positive and negative examples correctly classified, where TP, TN, FP, and FN denote the number of true positives, true negatives, false positives, and false negatives, respectively.
The precision metric shows the proportion of positive examples correctly classified among all predicted as positives (Eq. 4).
The sensitivity is relative to the hit rate in the positive class. It is also called rate of true positives (Eq. 5).
The specificity corresponds to the hit rate in the negative class (Eq. 6).
The adjusted accuracy is the arithmetic average between the sensitivity and specificity, described by Equation 7.
Finally, we use the Speedup (Eq. 8) to calculate the computational performance gain between the algorithm versions.
5. Results and Discussion
We performed experiments to analyze the behavior of K-means and K-modes algorithms for the TIS prediction problem as well as their performance. The databases were divided into two groups, large and small. The first group (large databases) is composed of the organisms AT, CE, DM, and HS. The second group (small databases) is composed of the organisms GG, MM, and RN.
For each database, the algorithm was executed 10 times, with the exception of the sequential version from Rodrigues et al. (2012), which was executed only three times per organism, due to the high execution time demanded. Table 4 shows the average execution time in seconds for each organism and the speedup between the sequential and GPU versions. The average execution time shows, as expected, that the performance is directly related to the number of sequences and centroids to be processed. For the large databases, the speedup was very high (up to 203.45 times). However, for two of the small databases (GG and RN), the execution time was slower in the GPU. This is because the overhead caused by the kernel launch and data transfers between host and device. In this case, the time to perform those operations is higher than the time to calculate the centroids.
Execution Time in Seconds
GPU, graphics processing unit.
Table 5 shows the 10-fold average for accuracy (Ac), precision (Pr), sensitivity (Se), specificity (Sp), and the adjusted accuracy (Adj) for each organism. Most of the results were very similar to those presented by Silva et al. (2011) and Rodrigues et al. (2012). For the large and small databases, the adopted methodology and the K-modes algorithm got better results for most of the metrics in comparison to the previous works. Although for RN (small database) there is a higher variation, the results are better except for sensitivity and adjusted accuracy.
Classification Results
Ac, accuracy; Adj, adjusted accuracy; Pr, precision; Se, sensitivity; Sp, specificity; P, proposal; R, Rodrigues et al. (2012).
Using our GPU K-modes implementation as clustering technique we achieved one of our objectives since the results of this article are similar those found in our previous work (Rodrigues et al., 2012) with an significant speedup and using less resources. Figure 3 presents the comparison between the execution times of the algorithm versions for the large databases: AT, CE, DM, and HS. Figure 4 presents the same comparison for the small databases: GG, MM, and RN.
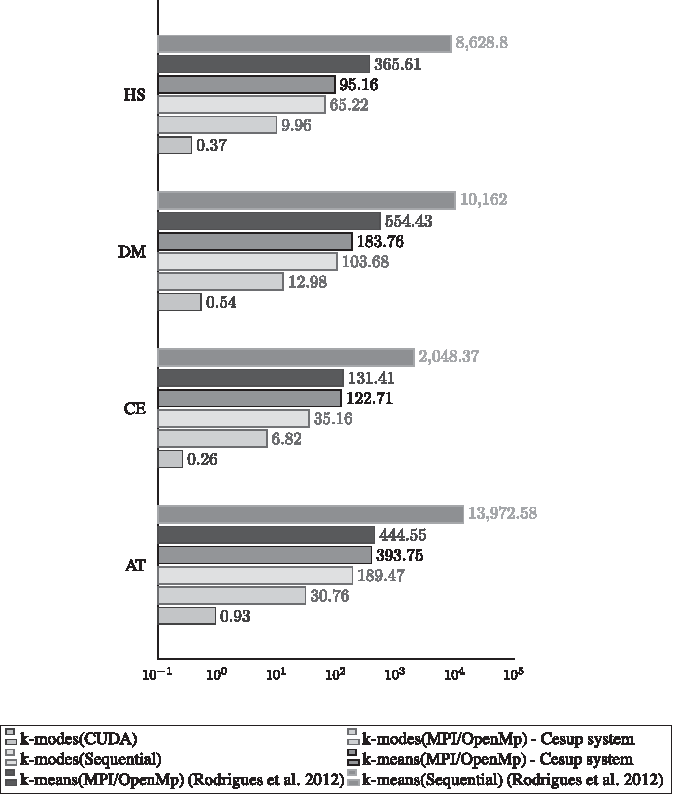
Execution time in minutes for large bases. AT, Arabidopsis thaliana; CE, Caenorhabditis elegans; CUDA, Compute Unified Device Architecture; MPI, message passing interface; DM, Drosophila melanogaster; HS, Homo sapiens; OpenMP, Open Multi-Processing.
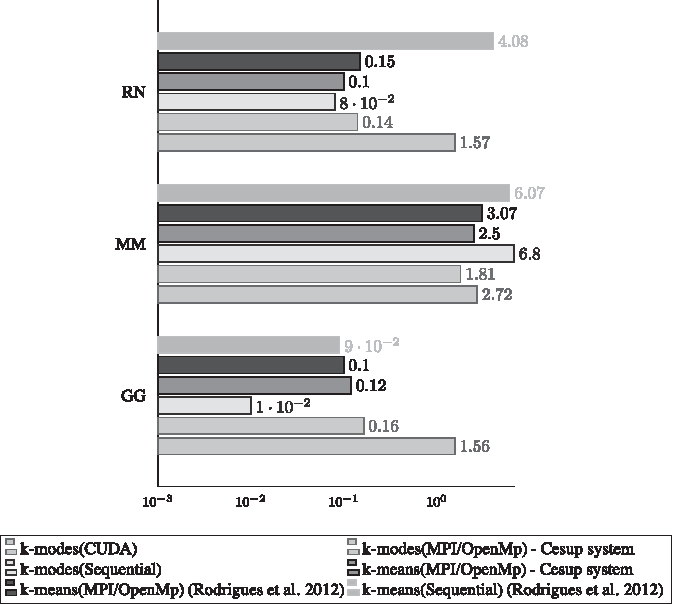
Execution time in seconds for small bases. GG, Gallus gallus; MM, Mus musculus; RN, Rattus norvegicus.
According to the results shown in Figure 3, it is clear which versions of the algorithm are faster for large database. The sequential version of the K-means was the slowest, followed by its parallel versions. Interestingly, all versions of the K-modes (including the sequential) outperformed the K-means algorithm. This is very positive as it highlights how the algorithm used considerably fewer resources. Although the K-means executed by Rodrigues et al. (2012) and the K-means version executed in this work are the same, their execution times are slight different. Even theoretical replicating of the same configuration from the Rodrigues et al. (2012) experiments, the results obtained from the CESUP were better. Thus, the CESUP MPI implementation and the hardware are more optimized for internode communication, decreasing the overhead of the parallel execution. Therefore, our results corroborate with the scalability results from Rodrigues et al. (2012). The K-modes and K-means algorithms had a great performance in parallel environments, especially when using GPU. The speedup from the sequential K-means version to the CUDA K-modes has reduced the execution time from days to less than 1 minute.
Figure 4 shows results for small databases. For the smallest base (GG), all parallel versions were slowest. This means that the parallel versions expended more time managing resources than doing computation. Regarding to the RN, which is a slightly bigger database, the parallel versions using MPI/OpenMP achieved better results than the sequential version; however, its GPU version was still slower when compared with the sequential algorithm. Finally, the MM database, which can be considered a medium-sized database, had better results using the parallel versions. In this case, the MPI/OpenMP version showed a modest advantage in comparison to the CUDA version. In our experiments, the CUDA implementation nearly outperformed all other algorithms, but its overhead was shown to be higher than the MPI/OpenMP in our context.
5.1. Convergency
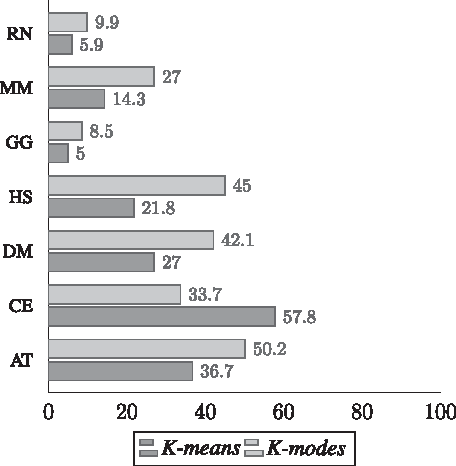
Figure 5 presents the 10-fold average of the number of iterations per organism. It is clear that the K-means algorithm tends to converge faster than the K-modes, with the exception of the CE database. However, even with the slower convergence curve, the K-modes algorithm was still faster than the K-means in total execution time.
Total number of iterations per organism.
Figures 6 and 7 present the convergence behavior of the clustering process for the large databases of the K-means and K-modes algorithms, respectively, for the first 15 iterations. From these results, it is possible to evaluate the bias of the centroids. Note that the convergence (in other words, the cluster formation) was fast for all databases. The major changes are made in early iterations of the algorithm, once the initial centroid is chosen randomly. Also, Figure 5 corroborates with Figures 6 and 7 showing that the K-means algorithm tends to converge faster than the K-modes.
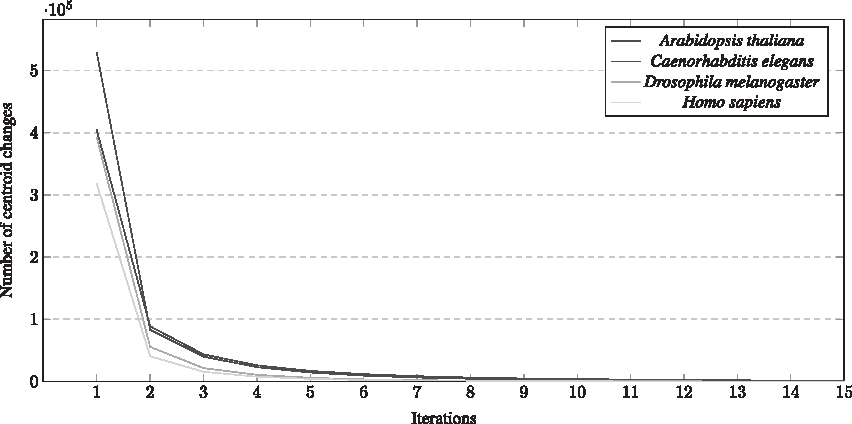
K-means convergence.

K-modes convergence.
5.2. Overall evaluation
This section highlights the K-modes performance evaluation with focus on large bases (Fig. 3). First of all, the sequential K-modes implementation, disclosed in this article to cluster non-TIS sequences, reduced the processing time for all databases in relation to the K-means algorithm versions. We observed a 132 times faster performance (e.g., HS) compared with the sequential version. Moreover, using the parallel CUDA K-modes version, we achieved up to 23,321 and 988 times faster execution time (e.g., HS) compared with the sequential and parallel MPI/OpenMP K-means versions presented by Rodrigues et al. (2012). In comparison to the MPI/OpenMP K-means version executed on CESUP system, the parallel CUDA K-modes is 257 times faster. Concerning only K-modes versions, the parallel CUDA implementation (e.g., AT) obtained a speedup up to 203 and 33 times in comparison to the sequential and parallel MPI/OpenMP K-modes versions, respectively. Therefore, our proposed K-modes algorithm implementation to cluster non-TIS sequences proved to be the best alternative using less resources and having a huge performance gain without compromising quality of the classification results as presented in Table 5.
6. Conclusion
As presented is this article, the computational cost to balance the TIS and non-TIS sequences can be extremely high for large data sets, and research involving optimization is needed to make it viable. Our results showed how parallel CUDA K-modes is efficient for solving this issue. GPUs are important accelerators and can provide high performance in this field of Bioinformatics area. It is important to highlight that days of processing can be reduced to seconds and due to the several tasks that need computational power, fast processing is crucial for sharing computer resources.
Besides the validation of our proposal, our article shows the related state of the art the following main contribution: a fast parallel K-modes algorithm implemented in more than one approach, but mainly in CUDA, for clustering nucleotide sequences in the field of TIS prediction. This way, we reinforce the need to investigate this field to find and propose new improvements toward heterogeneous computing as approach to explore parallel and high-performance computing (HPC) in Bioinformatics. For this reason, further works in heterogeneous HPC are fundamental to new advances in this context.
Footnotes
Acknowledgments
This study was partially financed by the Brazilian Federal Agency for Support and Evaluation of Graduate Education (CAPES)—Finance Code 001. We also thank CESUP, FAPEMIG, and CNPq for the partial support.
Author Disclosure Statement
The authors declare that no competing financial interests exist.