
Abstract
Abstract
Protein phosphorylation is a kind of important post-translational modification of protein, which plays a critical role in many biological processes of eukaryote. Identifying kinase–substrate interactions is helpful to understand the mechanism of many diseases. Many computational algorithms for kinase–substrate interactions identification have been proposed. However, most of those methods are mainly focused on utilizing protein local sequence information. In this article, we propose a new computational method to predict kinase–substrate interactions based on protein–protein interaction (PPI) network. Different from existing methods, the PPI network is utilized to measure the similarities of kinase–kinase and substrate–substrate, respectively. Then, the pairwise similarities of kinase–kinase and substrate–substrate are adjusted based on the assumption that the similarities of kinase–kinase and substrate–substrate are more reliable if they are in the same cluster. Finally, the bi-random walk is used to predict potential kinase–substrate interactions. The experimental results show that our method outperforms other state-of-the-art algorithms in performance. Furthermore, the case study demonstrates that it is effective in predicting potential kinase–substrate interactions.
1. Introduction
Protein phosphorylation is an important post-translational modification in living organisms. In the phosphorylation process, the substrate is phosphorylated by transferring adenosine triphosphate phosphate groups to the amino acid sequence under the catalysis of kinases. It plays an important role in the regulation of many cellular processes, such as cell metabolism, gene expression, and cellular signal transduction (Cohen, 2002; Olsen et al., 2006, 2010). Abnormal regulation between kinases and substrates may cause serious diseases, especially rheumatoid arthritis (Chen et al., 2017) and diabetes (Cohen, 2001; Lan et al., 2018). Therefore, identifying interactions between substrates and kinases is helpful to understanding the mechanism of cellular process and providing a fundamental basis for the drug-target researches (Gan et al., 2019).
Several biological methods are developed to infer phosphorylation sites and corresponding kinases. It can be classified into two categories: low-throughput (Lin et al., 2003; Salinas et al., 2004; Aponte et al., 2009) and high-throughput technique (Villen et al., 2007; Han et al., 2010; Lin et al., 2010). However, these types of experimental methods are costly and time consuming.
To overcome these limitations, many computational methods have been proposed to identify kinase–substrate interactions. Linding et al. (2007) developed a computational approach to predict site-specific kinase–substrate interactions by integrating motif information and the network context of kinases and phosphoproteins. Dang et al. (2008) presented an algorithm to identify kinase–substrate relationships based on conditional random fields. Zhou et al. (2004) developed a web server, GPS, to predict phosphorylation site by using the substitution matrix and Markov cluster algorithm. Zou et al. (2013) proposed a computational framework, PKIS, to identify kinase–substrate interactions. It used the composition of monomer spectrum encoding strategy to encode local sequence feature and predicted the interactions by using support vector machine. Patrick et al. (2014) developed a Bayesian network model that integrates cellular context to predict kinase–substrate interactions. Fan et al. (2014) proposed a computational method for kinase-specific phosphorylation sites prediction based on functional information and random forest. Li et al. (2015b) presented a kernel-based method to address the kinase identification problem by using supervised Laplacian regularized least squares. Song et al. (2017) developed a bioinformatics tool to infer kinase-specific substrates and their associated phosphorylation sites by combining protein sequence and functional features.
In addition, some methods use the biological network information to improve the performance. Song et al. (2012) developed a web server, iGPS, which is extended from GPS algorithm by integrating protein–protein interaction (PPI) network information. Damle and Mohanty (2014) proposed a computational method, PhosNetConstruct, to identify kinase–substrate relationships by analyzing domain-specific phosphorylation network. Li et al. (2015a) proposed a network-based method for kinase–substrate interactions prediction based on sequence similarity. Moreover, Qin et al. (2016) presented a computational method for inferring the interactions between kinases and substrates based on protein domains network. These computational methods for identifying kinase–substrate interactions have achieved great successes. However, phosphorylation is a complex biological process which is usually involved in various biological mechanisms. In addition, these machine learning-based algorithms require a large amount of negative samples that are hard to obtain from biological data. Moreover, some methods only use local information instead of global information, which may result in false positive (FP).
In this article, we propose a novel computational method, Predict Kinase-Substrate Interaction by using Bi-random Walk (KSIBW), to predict kinase–substrate interactions based on assumption that similar substrates tend to be related with similar kinases. First, the reliability of PPI network is improved based on local topological feature and biological feature. Then, the similarities of kinase–kinase and substrate–substrate are calculated by using short path method, respectively. In addition, these similarities are adjusted based on the assumption that the similarities of kinase–kinase and substrate–substrate are more reliable if they are in the same cluster. Finally, the bi-random walk algorithm is employed to predict potential kinase–substrate interactions. The experimental results show that our method outperforms other state-of-the-art algorithms in performance.
2. Materials and Methods
2.1. Data resources
In this article, the human kinase–substrate interactions are obtained from the Phospho.ELM 9.0 database (Dinkel et al., 2010). After removing the redundant data, 216 kinases, 724 substrates, and 1256 kinase–substrate interactions are collected in final. The human PPI data are obtained from InWeb_IM database (Li et al., 2017), which were collected from eight source databases, including DIP (Xenarios et al., 2002), BIND (Bader et al., 2003), WikiPathways (Kelder et al., 2011), IntAct (Orchard et al., 2013), Reactome (Croft et al., 2013), BioGRID (Stark et al., 2006), NetPath (Kandasamy et al., 2010), and MatrixDB (Launay et al., 2014). It contains 14,684 human proteins and 625,641 interactions. In InWeb_IM, each PPI contains confidence score (CF), which is calculated based on the reproducibility of the interaction data between different publications.
2.2. Kinase–kinase and substrate–substrate similarity measure
To enhance the reliable of PPI network, the new edge clustering coefficient (NECC; Ma et al., 2017) is used to weight the PPI network. The PPI network can be described as an undirected graph G(V,E); each node v
where CF(u,v) denotes the CF of edge (u,v) that obtained from InWeb_IM (Li et al., 2017). The parameter
To calculate the similarity between two proteins, we find the shortest path between the two proteins. Then the similarity is calculated as follows:
where
2.3. Clustering kinase and substrate
Based on the assumption that two kinases or substrates are more similar if they belong to the same cluster, we further improve the kinase–kinase similarity and substrate–substrate similarity by clustering kinase–kinase similarity network and substrate–substrate similarity network. The ClusterONE is utilized to cluster the kinase similarity network K (Nepusz et al., 2012) and improve the similarity between kinases that belong to the same cluster. The similarities of kinase–kinase within same cluster are adjusted based on assumption that kinases belonging to the same cluster tend to behave more similarly. Assuming the two kinases ki and kj are in the same cluster C, the similarity between ki and kj is reinforced as
where
2.4. Construction of kinase and substrate heterogeneous network
Based on these two similarity matrices, the kinase similarity network and the substrate similarity network are constructed. For kinase similarity network K, ki and kj represent two different kinases. If the similarity between ki and kj is 0, then there is no edge between this two kinases. Otherwise, there is an edge connection between these two kinases, and the weight of the edge is the similarity value of the two kinases. The substrate similarity network S is similar to the kinase similarity network.
Let I denote the kinase–substrate association network. eij denotes the edge of I and the initial value of eij is set to 1 if there is a known interaction between kinase ki and substrate sj; otherwise 0. Based on the association network, the kinase–substrate heterogeneous network is constructed by conjoining kinase similarity network and substrate similarity network. An example of kinase–substrate heterogeneous network is shown in Figure 1.
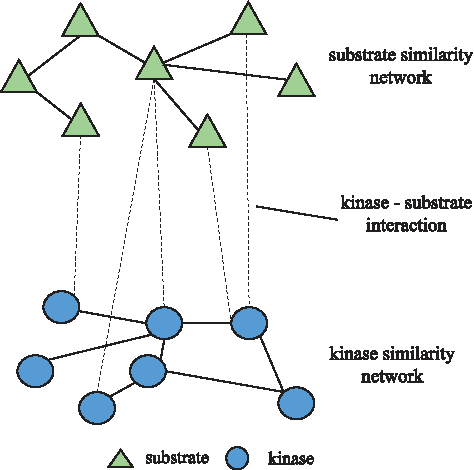
Illustration of the kinase–substrate heterogeneous network. The triangle and the circle represent the substrate and the kinase, respectively. The solid line shows the similarity between the two proteins. The dotted line shows the kinase–substrate interactions. Two similarity networks are bridged by known kinase–substrate interactions.
2.5. Predicting kinase–substrate interactions based on bi-random walk
Bi-random walk is an extension of the random walk, which is widely used in disease gene identification (Lan et al., 2015), drug repositioning (Luo et al., 2016), and phenome-genome association prediction (Xie et al., 2015).
The kinase similarity matrix and substrate similarity matrix are normalized by using Laplace normalization, respectively. The normalized kinase similarity matrix Sn is calculated as follows:
where Ds represents the diagonal matrix of the substrate similarity matrix S and Ds(i,i) is the sum of the ith row of S.
The kinase-normalized similarity matrix Kn is calculated as follows:
where Dk represents the diagonal matrix of the kinase similarity matrix K and Dk(i,i) is the sum of the ith row of K.
Different from the previous normalized procedure, the normalization matrix
After getting normalized matrices Sn, Kn and In, the bi-random walk is employed to identify kinase–substrate interactions by walking on the kinase similarity network and substrate similarity network simultaneously. Considering that different networks may have different topology structures, the optimal number of steps of walker on these two networks may be inconsistent. Thus, we limit the number of walking steps on two different networks by setting two parameters l and r where they represent the maximum number of random walks on the substrate network and kinase network, respectively. The bi-random walk procedure is formalized as follows:
Left walk in the substrate similarity network:
Right walk in the kinase similarity network:
The left and right predicted results are integrated to acquire the final output:
where
3. Experiments and Results
3.1. Evaluation metrics
In this article, 10-fold cross-validation and de novo test are utilized to evaluate the performance of different algorithms. In the 10-fold cross-validation, known kinase–substrate interactions are randomly divided into 10 subsets. In each cross-validation trial, nine subsets are used as the training set and the remaining one subset is treated as the test set. After completing the test on the data set, the predicted scoring matrix is generated. Then we rank the unknown kinase–substrate interactions and test set based on predicted scores. For each threshold, the corresponding predicted result of test set is considered true positive (TP) if the predicted score is greater than the threshold. Otherwise, it is considered as false negative. For the unknown kinase–substrate interaction, it is treated as FP if the predicted score is greater than the threshold and as true negative (TN) if the predicted value is less than the threshold. By choosing various thresholds, we calculate different true positive rate (TPR) and false positive rate (FPR). The TPR and FPR are calculated as follows:
The receiving operating characteristic (ROC) curve is drawn based on the previously calculated TPR and FPR. Then the area under curve (AUC) value is calculated to evaluate the performance of different algorithms.
3.2. Comparison with network-based method
To evaluate the performance of KSIBW, we compare it with Hetesim-SEQ (Li et al., 2015b) algorithm. Similar to KSIBW, Hetesim-SEQ is another network-based method of predicting kinase–substrate interactions. For both KSIBW and Hetesim-SEQ, we use the same data set that obtained from Phospho.ELM and 10-fold cross-validation is used for performance evaluation. The experimental results of KSIBW and Hetesim-SEQ is shown in Figure 2. KSIBW achieves the AUC value of 0.842, which is higher than Hetesim-SEQ (AUC = 0.802). It shows that KSIBW performs better than Hetesim-SEQ.
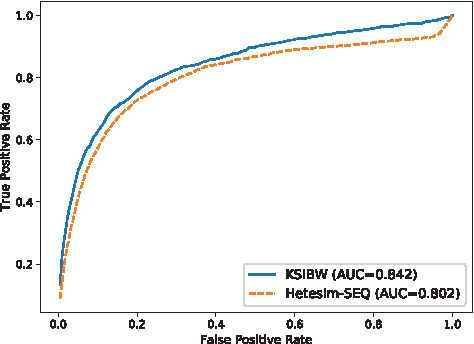
The ROC curves for predicting kinase–substrate interactions with different methods.
3.3. Comparison with different predictors by de novo test
To evaluate the power of our method for predicting new kinase–substrate interactions, we perform de novo test experiments. In the de novo test, we delete all known kinase–substrate interactions of kinase i in each time. The rest of kinase–substrate interactions are treated as training set. We compare KSIBW with four state-of-the-art methods of kinase–substrate interactions, including GPS (Zhou et al., 2004), iGPS (Song et al., 2012), NetworKIN (Linding et al., 2007), and PhosphoPICK (Patrick et al., 2014). Since these methods only provide web server, we submit the data set to the corresponding web server for testing. We take six kinase groups, including Atypical, CAMK, CMGC, Other, STE, and TK, as examples to illustrate the predictive performance of different methods. Figure 3 shows the ROC curves of different methods in different kinase groups. It can be discovered from Figure 3, the KSIBW performs better than the other four algorithms on different kinase groups. For example, for Atypical group, KSIBW achieves the AUC value of 0.813, which is higher than GPS (AUC = 0.469), iGPS (AUC = 0.575), NetworkKIN (AUC = 0.689), and PhosphoPICK (AUC = 0.471).
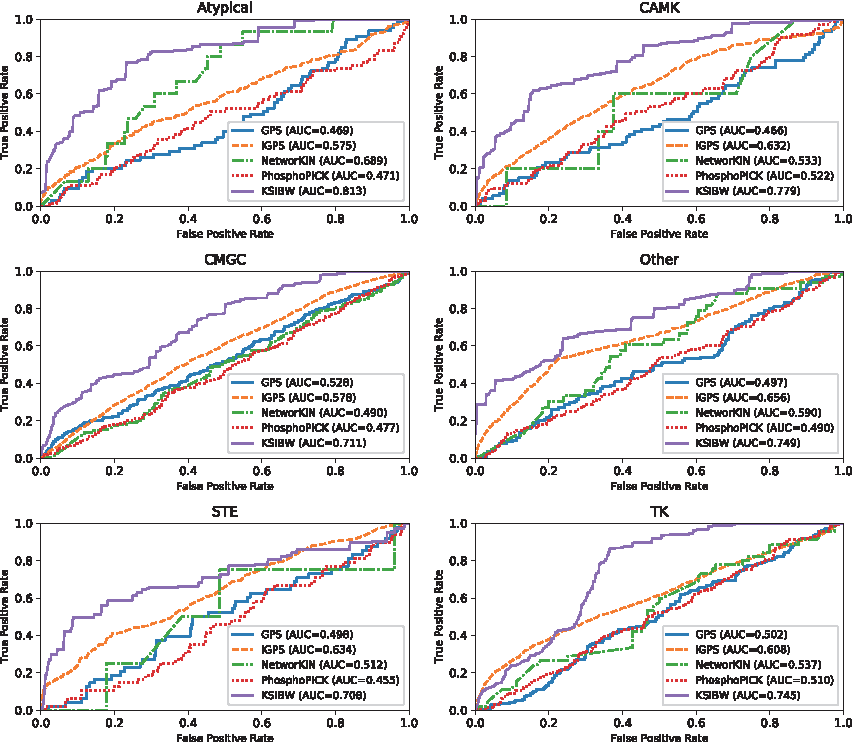
The ROC curves for kinase group Atypical, CAMK, CMGC, Other, STE, and TK with different methods.
3.4. Effect of PPI weight parameter α
To enhance the reliable of PPI network, the NECC and CF are calculated to weight the PPI network. These two measures are integrated to weight the edge between two proteins in the PPI network. The parameter α is set to trade off the NECC and CF between two proteins. To evaluate the effect of different α values on the performance of the algorithm, we set the value of α from 0.1 to 0.9 and calculate the corresponding AUC score. As shown in Figure 4, the AUC achieves the highest value (0.836) when α is 0.9. It should be noted that we do not cluster the similarity networks when testing the effect of α.
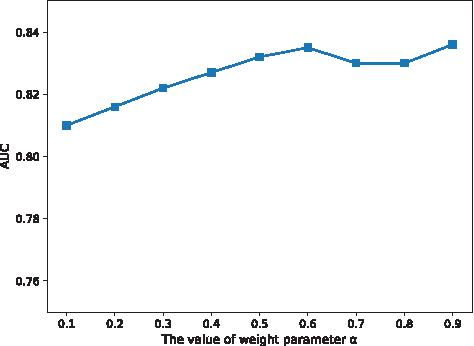
The performance of KSIBW at different values of α.
3.5. Effect of the similarity reinforcing factor γ
The parameter
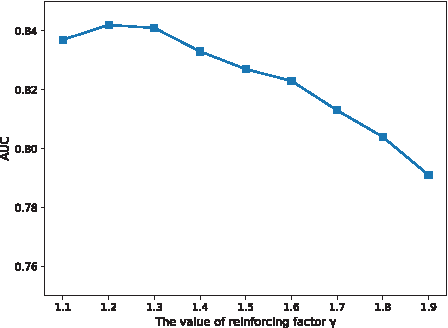
The performance of KSIBW at different values of γ.
3.6. Case studies
To further validate the ability to predict unknown kinase–substrate interactions, the case study is conducted. All known kinase–substrate interactions are used as a training set and the unknown kinase–substrate interactions are used as the test set. We employ KSIBW to predict potential kinase–substrate interactions and acquire the prediction score of all kinase–substrate pair in the test set.
We take TP53 as an example to illustrate the ability of KSIBW to detect unknown kinase–substrate interactions. TP53 is a transcription factor that controls the initiation of the cell cycle. It has been found that TP53 has close association with many human cancers. It plays many roles in cell cycle, apoptosis, genomic stability, inhibition of angiogenesis, and so on. We analyze the top 10 predicted results of the TP53. The detailed information is listed in Table 1. By checking the PhosphoNET database, it has been found that three of the prediction results are recorded by PhosphoNET. For example, the serine site in position 20 of substrate TP53 is catalyzed by kinase PLK3, ATR phosphorylates TP53 at serine site in position 15, and TP53 associates with kinase CDK2 through serine site in position 26. In addition, although some of the predicted kinase–substrate interactions are not presented in PhosphoNET, it has been validated in published literatures. For example, TP53 has been found to be regulated by FLT3 (Irish et al., 2007). JAK2 has been verified that negatively regulates TP53 in myeloproliferative neoplasms (Nakatake et al., 2012). In addition, some new interesting kinase–substrate interactions are also discovered from the experimental results. It deserves for biologists to validate by using biological experiments.
Top 10 Prediction Results of Tp35
4. Conclusion
Protein phosphorylation is an important post-translational modification. It plays an important role in cell metabolism, gene expression, and cellular signal transduction. Predicting the relationships between substrates and its specific kinases can facilitate to understand the mechanism of cellular processes. Owing to the time-consuming and laborious experimental method, many computational methods have been developed to identify kinase–substrate interactions. However, most of those computational methods are usually focused on utilizing protein local sequence information, which are not sufficient for accurate prediction.
In this article, we propose a computational method to predict kinase–substrate interactions based on bi-random walk. First, the reliable of PPI network is improved based on local topological feature and biological feature. Then, the similarities of kinase–kinase and substrate–substrate are calculated by using short path method, respectively. In addition, the similarities are adjusted based on the assumption that the similarities of kinase–kinase and substrate–substrate are more reliable if they are in the same cluster. Further, the bi-random walk algorithm is employed to predict potential kinase–substrate interactions. We evaluate our method in terms of 10-fold cross-validation and de novo prediction. The experimental results show that our algorithm achieves higher AUC than other state-of-the-art algorithms. Furthermore, the case study is conducted and the results show the effectiveness of our method for potential kinase–substrate interactions prediction.
Footnotes
Acknowledgments
This study is supported in part by the National Natural Science Foundation of China under Grant Nos. 61702122, 61751314, and 31560317; Natural Science Foundation of Guangxi 2017GXNSFDA198033 and AB17195055; Director Open Fund of Qinzhou City Key Laboratory of Advanced Technology of Internet of Things IOT2017A04; Doctor foundation of Guangxi University XBZ180479.
Author Disclosure Statement
The authors declare that no competing financial interests exist.