
Abstract
Abstract
The explosive growth of large-scale biological data enables network-based drug repositioning to be an important way of drug discovery, which can reduce the time and cost of drug discovery efficiently. Many existing approaches always construct drug–disease association network only based on some similarity measuring data for drug or disease, which ignore the impacts of different similarity measuring on predicting performance. In this study, we develop a new computational approach named BiRWDDA, which fused multiple similarity measures and bi-random walk to discover potential associations between drugs and diseases. First, multiple drug–drug similarity and disease–disease similarity are measured. Next, the information entropy of similarities measured based on different data are calculated to select proper similarities of drugs and diseases. Subsequently, improved drug–drug similarity and disease–disease similarity can be obtained by fusing similarities selected. Then, a logistic function is adopted to adjust the improved drug similarity and disease similarity. What is more, a heterogeneous network can be conducted by connecting the drug similarity network and the disease similarity network through known drug–disease associations. Finally, a bi-random walk algorithm is implemented on the heterogeneous network to predict potential drug–disease associations. Experimental results demonstrate that BiRWDDA outperforms the other state-of-the-art methods with average AUC of 0.930. Case studies for five selected drugs further verify the favorable prediction performance.
1. Introduction
Traditional drug discovery is a costly, time-consuming, risky, and ineffective process (Pammolli et al., 2011). Relevant surveys show that it always takes about 10–15 years and costs >$800 million to bring a new drug to market (Dudley et al., 2011). In the past decade, although the total worldwide cost of drug R&D has risen up to 141 billion, the number of drug approvals per year remains low (Schuhmacher et al., 2016). For the issue, drug repositioning or drug repurposing that refers to find new uses for existing drugs can provide a better risk-versus-reward trade-off and has attracted increasing interests from the research community and pharmaceutical industry (Hurle et al., 2013). So far, some successful repositioned drugs have generated historically high revenues for their patent holders or companies, such as Sildenafil, thalidomide, and raloxifene (Ashburn and Thor, 2004).
Essentially, the objective of drug repositioning is to identify the potential treatment of existing drugs. Currently, most existed repositioned drugs are the consequence of serendipitous observations of unexpected efficacy and side effects of drugs in development or on the market (Lee et al., 2012). To accelerate the drug development process, it needs to develop rational and systematic methods to discover new uses of old drugs on a large scale (Liu et al., 2016).
Generally speaking, existing computational drug repositioning methods can be classified into the following categories: machine learning based, text mining based, and network based (Li et al., 2015). Most machine learning-based methods take randomly generated associations between biomedical entities as negative samples, in which some unreliable negative samples are included and cause biased decision boundary (Cheng et al., 2017). The text mining approaches typically depend on occurrence and co-occurrence statistics of terms to infer associations between biomedical entities (Jelier et al., 2008). For instance, Li and Lu (2012) developed a text mining model to systematically identify PGx relevant relationships between genes, drugs, and diseases from trial records in ClinicalTrials.gov. Owing to name ambiguity between entity types and limited accuracy of text mining techniques, text mining approaches could not obtain desirable performance.
With the increasing accumulation of the topological and structural properties of complex biomedical networks, some network-based approaches have been developed to find new indications for existing drugs (Chen et al., 2015). For example, Chiang and Butte (2009) developed a guilt-by-association method, which measured the relationship between diseases to predict potential drug–disease association. Li and Lu (2013) developed a computational method to discover new uses of existing drugs based on causal inference in a layered drug-target-pathway-gene-disease network. Yu et al. (2015) constructed a tripartite network consisting of drugs, protein complexes and disease, and inferred the weighted relationships between drugs and diseases. Based on the observation that similar drugs are indicated for similar diseases, Gottlieb et al. (2011) utilized multiple drug–drug and disease–disease similarity measures for the prediction task. Napolitano et al. (2013) combined the drug similarities (e.g., target protein similarity and chemical structure similarity) into a single information layer used to train a multiclass SVM classifier. Martínez et al. (2015) have developed DrugNet, a network-based prioritization method, which integrated drugs, disease, and targets to perform disease–drug and drug–disease prioritization. It is conceivable that these methods can help to improve the prediction performance by fusing multiple related sources (Zhang et al., 2017).
However, previous studies seldom utilized the known drug–disease association information of data set to improve similarity measures. Luo et al. (2016) proposed a novel computational method named MBiRW, which utilizes some comprehensive similarity measures and bi-random walk algorithm to predict potential indications for existing drugs.
In this study, we propose a novel computational drug repositioning method named BiRWDDA, which fused multiple similarity measures and utilizes bi-random walk algorithm to find potential drug–disease associations. First, based on different available biological data, BiRWDDA calculates multiple drug–drug similarity and disease–disease similarity, separately. Next, the information entropy is calculated for different drug similarity and disease similarity to select a set of more informative similarity set. Subsequently, to obtain the improved drug–drug similarity and disease–disease similarity we construct similarity fusion based on the aforementioned similarity selection. Then BiRWDDA adopts a logistic function to adjust the improved drug similarity and disease similarity. Finally, bi-random walk algorithm is adopted on the heterogeneous network to predict new drug–disease associations. Furthermore, we utilize 10-fold cross validation to evaluate the performance of BiRWDDA. The experiment results show that the proposed model obtains superior performance in predicting novel indications for existing drugs.
2. Materials and Methods
In this section, a novel multisimilarity fusion drug repositioning method using bi-random walk algorithm was used to predict new indications for approved drugs. First, we introduce the data set used in this article. Second, we compute multiple similarity measures and then implement similarity selection to get an optimized combination of similarity measures for drugs and diseases, respectively. Next, a heterogeneous network is constructed by connecting the drug similarity network and the disease similarity network through known drug–disease associations. Finally, bi-random walk algorithm is implemented on the heterogeneous network to predict potential drug–disease associations. Figure 1 shows the flowchart of BiRWDDA.
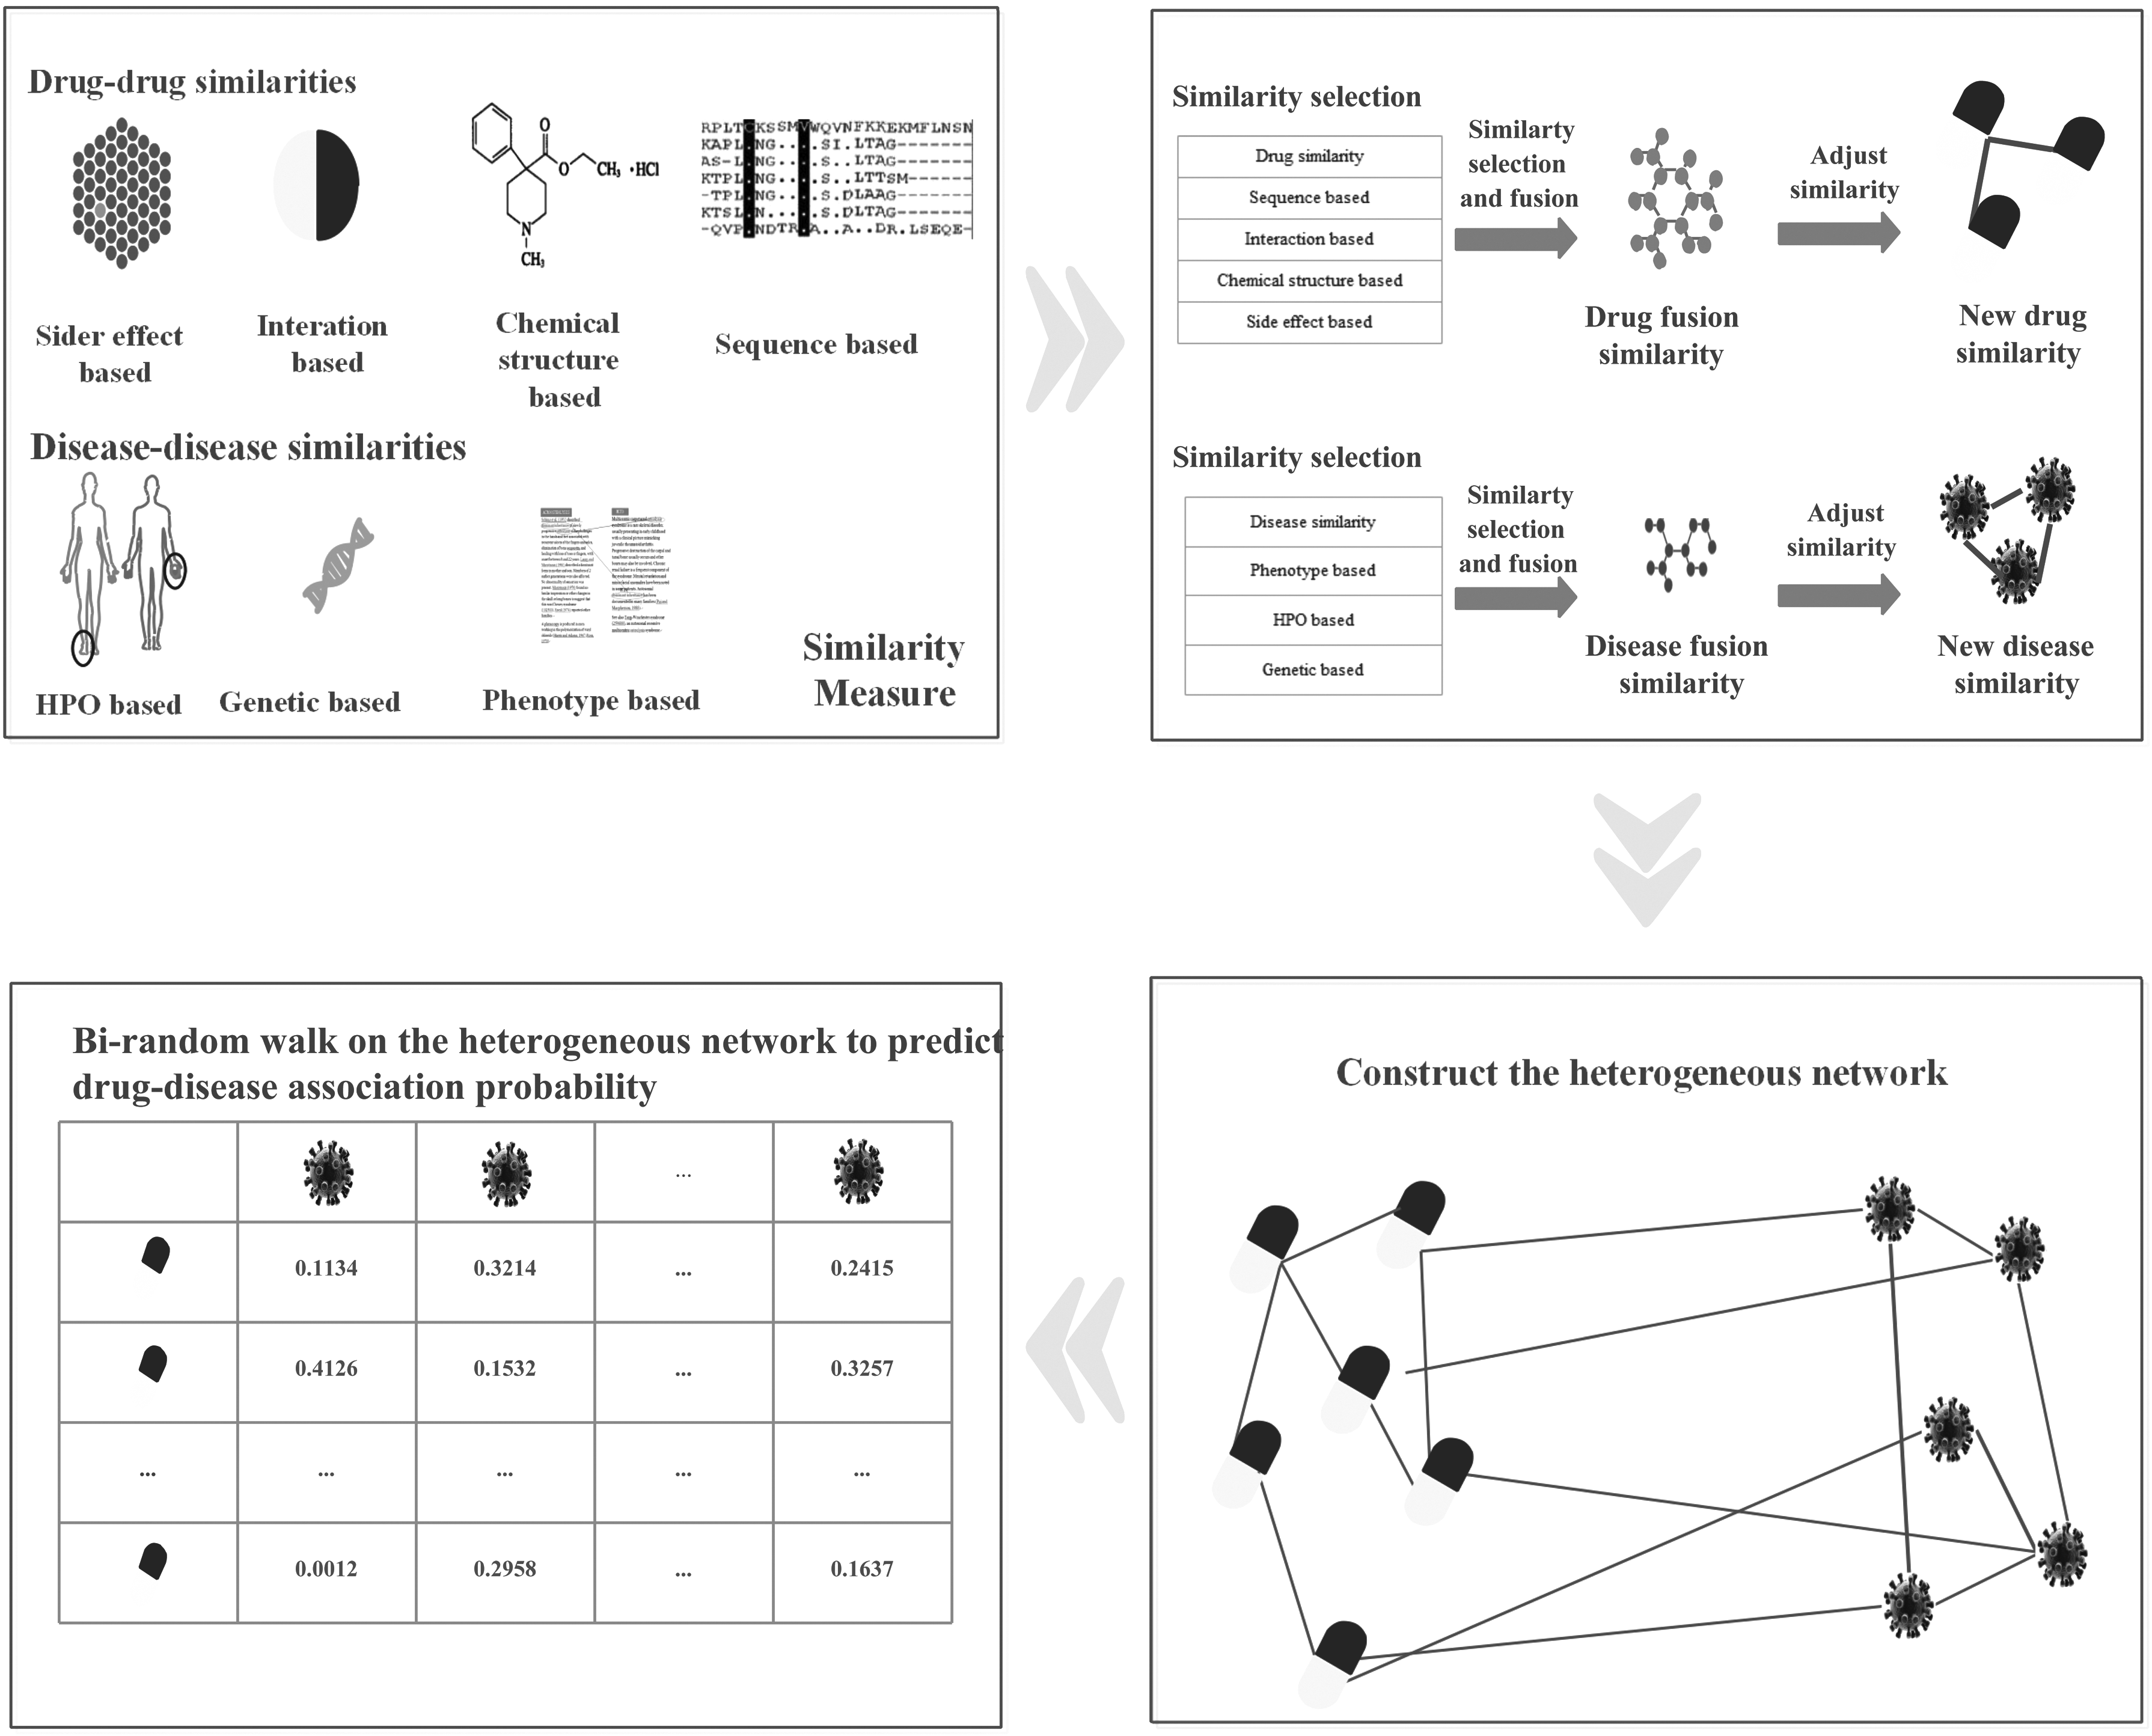
The flowchart of BiRWDDA.
2.1. Data set
The gold standard data sets used in this work is obtained from Gottlieb et al. (2011), which is collected from multiple data sources. This data set includes 1933 known interactions between 593 drugs and 313 diseases. Drugs are collected from DrugBank (Wishart et al., 2007), and diseases are registered in the Online Mendelian in Man (OMIM) database (Hamosh et al., 2005). Figure 2 demonstrates the statistics of this data set in detail.

Statistics of drug–disease incidence matrix.
2.2. Similarity measures
In this section, we present the process of improved similarity measure. First, we define and compute four drug–drug similarity measures and three disease–disease similarity measures based on some drug-related properties and disease-related properties, separately; Then, informative similarity measures can be selected based on information entropy and fused into new drug similarity and disease similarity; Finally, we adjust similarity values by applying a logical function to obtain improved similarity for drug and disease, respectively.
2.2.1. Drug similarity measures
In this section, four drug–drug similarity measures are introduced as follows:
Sequence based: The protein sequence information of the drugs is obtained from the UniProt database (Apweiler et al., 2004), based on a Smith–Waterman sequence alignment score (Smith et al., 1985) between the corresponding drug-related genes. After the normalization suggested in Bleakley and Yamanishi (2009), we divide the Smith–Waterman score by the geometric mean of the scores obtained from aligning each sequence against itself. For sequence s and
where Interaction based: Drug interaction refers to the compound effect of the patient taking two or more drugs at the same time or within a certain period, which can enhance the efficacy or reduce the side effects and can also weaken the efficacy or cause the undue poison side effect. Therefore, the interaction between drugs is of great significance in the process of drug repositioning. Drug interaction information can be extracted from the DrugBank. Then the Jaccard score is used to calculate the similarity of drug interactions, as follows:
where Ii and Chemical structure based: The canonical SMILES (Weininger, 1988) of the drug are obtained from DrugBank. The Chemical Development Kit (Steinbeck et al., 2006) is used to compute the similarity between two drugs as the Tanimoto score of their 2D chemical fingerprints. Side effect based: Drug side effects are obtained from SIDER (Kuhn et al., 2010). We augmented this list by side effect predictions for drugs that are not included in SIDER based on their chemical properties (Atias and Sharan, 2011). We define the similarity of two drugs in terms of the Jaccard score between known side effects of the drug or between the top 10 predicted side effects in an unknown situation.
2.2.2. Disease similarity measures
In this section, three disease–disease similarity measures are introduced as follows:
Phenotype based: Disease phenotypes similarity Semantic phenotypic similarity: Semantic phenotypic similarity information of the diseases is obtained from the OMIM database. The semantic similarity score Genetic based: The genetic signatures of the diseases are collected from gene expression experiments, the Jaccard score is used between each pair of signatures, considering the direction of the response of each gene.
2.3. Similarity selection
It may introduce noise into the data if we combine all similarity information. To choose a more robust set of similarities, we utilize information entropy to select similarity; the procedure goes as follows:
The average entropy of each similarity measure is calculated, which decides how much information each similarity takes. For a similarity matrix M for drug or disease, we calculate entropy Ei for each row i as:
where, To get the final average entropy value, we average the entropy values of all matrix rows, which describe how informative a similarity is.
The smaller the average entropy means less random information is introduced in the similarity measure.
We calculate the information entropy of four drug–drug similarity measures and three disease–disease similarity measures.
According to the results shown in Table 1, comparing with other similarity measure, drug sequence based and drug interaction based have smaller information entropy. For similarity measure, smaller information entropy means more informative than they can provide. Likewise, for disease similarity measure, we can see from Table 2 that phenotype- and semantic-based measures are more informative. As a result, these similarity measures with smaller information entropy are selected to conduct the following similarity fusion.
Information Entropy of Different Drug Similarity Measure
Information Entropy of Different Disease Similarity Measure
2.4. Similarity fusion
Based on similarity selection, given the selected similarity measures obtained previously for drugs and diseases, respectively, the purpose of the similarity fusion is to combine multiple similarity measures into one similarity measure that captures the information from different similarities. The smaller the average entropy means less random information is introduced in the similarity measure. Thus, we computed the fused similarity measure, which is described as follows:

In particular,
2.5. Adjusting the similarity matrices
According to the aforementioned fusion similarity for drugs and diseases. We execute the correlation analysis on drug similarity and disease similarity by taking into account known drug–disease association's information of the gold standard data set.
Drug pairs with similarity values within the range of [0, 0.3] have an insignificant probability of treating common diseases, and drug pairs with similarity values within the scope of [0.6, 1] have a significant probability of treating common disease. Then for disease pairs with similarity values within the range of [0, 0.3] have an insignificant probability of sharing drugs, and disease pairs with similarity values within the scope of [0.6, 1] have a significant probability of sharing drugs. The evidence is shown in Supplementary Figure S1. In this study, we adjust similarity by applying a logistic function (Vanunu et al., 2010), as follows:
where
2.6. Construction of the heterogeneous network
Based on the drug similarity and disease similarity calculated earlier, both the drug similarity network and the disease similarity network can be constructed. In the drug similarity network, let
A drug–disease association network is a heterogeneous network composed of a drug similarity network, a disease network, and the drug–disease association network modeled by a bipartite graph
2.7. The BiRWDDA method
In this study, we use bi-random walk algorithm on the heterogeneous network to predict drug–disease association.
The drug similarity network and the disease similarity network contain diverse topologies and structures; therefore, the optimal number of random walk steps may be disparate on the two networks. To solve this problem, we restrict the number of random walk steps on the two network by setting two parameters l and r as the numbers of maximal iterations. The iterative process is written as follows:
Random walk on the drug similarity network:
Random walk on the disease similarity network:
where
3. Experiments and Results
In this section, we use the golden standard data sets to evaluate the prediction ability of our BiRWDDA model. First, we introduce evaluation metrics used in this article. Then, we compare BiRWDDA with other several state-of-the-art models. Next, we conduct case studies to verify the ability of BiRWDDA in identifying new indications.
3.1. Evaluation metrics
To test the prediction ability of BiRWDDA, we implement 10-fold cross validation on the gold standard data sets to compute the association probabilities of drug–disease pairs. All known drug–disease pairs in the golden data sets are randomly divided into 10 equal subsets. In each round of 10-fold cross validation, each subset is held out in turn as the test set, whereas the remaining data are merged with the training set. After performing BiRWDDA, each drug–disease pairs is assigned a predicted score. In terms of the predicted score, for each drug, the test drug–disease pairs and the candidate associations (all uncertain drug–disease pairs until now) are sorted in descending order. For a given rank threshold, true positive rate (TPR), false positive rate (FPR), Precision and Recall can be obtained. TPR is the proportion of all known drug–disease pairs are correctly predicted, FPR is the proportion of all unconfirmed drug–disease pairs that are predicted, Precision is the proportion of all known drug–disease pairs that appear in the ranked list based on a given threshold, Recall is the same as TPR. We further computed various TPR, PPR, Precision, and Recall with different thresholds to construct receiver operating characteristic (ROC) curve and the Precision–Recall curve. The AUC (the area under of ROC curves) and precision are utilized to evaluate the performance of the prediction models.
To reduce the random set division bias, 10-fold cross validation is repeated 10 times by randomly dividing the sets in each time.
3.2. Effect of parameters
There are three parameters in BiRWDDA, the parameter
3.3. Comparison with other methods
In this section, to evaluate the performance of the proposed model, we compare the prediction performance of BiRWDDA model with some other state-of-the-art methods: MBiRW (Luo et al., 2016), HGBI (Wang et al., 2013). MBiRW uses comprehensive similarity and bi-random walk on the heterogeneous network to predict potential drug–disease associations. HGBI is based on the guilt-by-association principle and an intuitive interpretation of information flow on the heterogeneous graph.
Especially, the parameter setting for each method is set to its default setting or best parameter values, the parameters (λ, l, r) are set to (0.2, 2, 2) for BiRWDDA. MBiRW is set to its default setting, the parameter
The evaluation results of all methods according to ROC curves and PR curves are reported in Figure 3. It can be found that BiRWDDA achieves the highest AUC value of 0.930, whereas MBiRW and HGBI obtain inferior results of 0.919 and 0.814, respectively. In terms of PR curves, we can see that BiRWDDA achieves the best precision, whereas HGBI obtains inferior precision.

Prediction results of different methods in identifying potential drug–disease associations.
3.3. Comparison with the different data source
In our study, multiple data sources include DDI (drug interaction), SEQ (protein sequence), HP (phenotype), and PHE (semantic phenotypic) are measured and integrated to improve the performance of prediction. To evaluate the impact of different integration on the algorithm, we conduct 10-fold cross validation on these data sets. Figure 4 shows the evaluation result. We can see from Figure 4 that BiRWDDA achieves the best performance (AUC = 0.930), which is based on the principle that it is beneficial to building a robust prediction method with high efficiency by fusing multiple related sources.

Prediction results of different data source in identifying potential drug–disease associations.
4. Case Studies
After confirming the performance of BiRWDDA in terms of 10-fold cross validation, to further validate the capability of our method in predicting new drug–disease indications, all the known drug–disease pairs in the gold standard data set are used as the training set, and the remaining unknown drug–disease pairs are considered to be the candidate associations. By applying BiRWDDA, we can get the prediction scores for all candidate drug–disease associations. For a specific drug, all the candidate diseases are ranked according to their prediction scores, and we collect the top 10 predicted diseases as prediction results. For all drugs, the prediction results are listed in Supplementary Table S2.
We conduct case studies for the predicted top-ranked diseases in terms of public biological databases KEGG (Kanehisa et al., 2013) and current clinical trials to verify the prediction results are true or not. In KEGG database, some newly verified drug–disease pairs provide a foundation for our validation. As an example, we choose several drugs and corresponding top five candidate diseases, as shown in Table 3. We find that some novel drug–disease pairs have been confirmed in KEGG database or clinical trials on web ClinicalTrials.gov. For example, Paclitaxel has been predicted potential therapy for Prostate cancer and TGCT (testicular germ cell tumor). Risperidone has been predicted potential therapy for OCD (obsessive-compulsive disorder) and ADHD (attention-deficit/hyperactivity disorder). Doxorubicin has been predicted potential therapy for small cell cancer of the lung, CRC (colorectal cancer), RCC (renal cell carcinoma, nonpapillary). Those have been confirmed in clinical trials. Prednisone has been predicted potential therapy for asthma bronchial, dermatitis atopic, and Crohn's disease. Dexamethasone has been predicted as a potential therapy for prostate cancer and TGCT. They have been verified in clinical trials or KEGG database. These successful case studies show that our proposed method has a strong ability in predicting new drug–disease associations.
Case Studies About Five Chosen Drugs: Paclitaxel, Prednisone, Risperidone, Doxorubicin, and Dexamethasone
For each drug, the top five ranked predictions are listed in the table.
5. Conclusion
Drug repositioning is a high-efficiency method to discover new indications for a given drug. In this study, we propose a novel drug repositioning approach named BiRWDDA to predict potential drug–disease associations. The main idea of our model is that we have designed novel similarity measures for drugs and diseases by fusing multisource data, and BiRW algorithm is adopted to perform drug repositioning. First, we compute multiple drug–drug similarity and disease–disease similarity and then combine similarity for drug and disease, respectively. Before applying the combined similarity method, BiRWDDA utilizes information entropy to select similarity because of combining all similarity types may introduce noise in the data. Subsequently, BiRWDDA adjusts similarity by a logistic function to a comprehensive similarity. Next, drug similarity network and disease similarity network are constructed and they are incorporated into a heterogeneous network through known drug–disease associations. Finally, BiRWDDA adopts BiRW algorithm to identify new indications for existing drugs. In 10-fold cross validation, the result shows that BiRWDDA is feasible and effective. Compared with other several state-of-the-art models, the proposed method can effectively improve prediction performance. Case studies further demonstrate that it is reliable in identifying novel indications for existing drugs.
Despite we have confirmed its power according to cross validation and case studies, there are still some limitations. First, the gold standard data set is incomplete, so predictive performance will be limited. It can be solved by increasing drug–disease association discovered. In addition, we plan to integrate more reliable data (such as target data related to drugs and diseases) to construct a comprehensive heterogeneous network in future studies.
Footnotes
Acknowledgment
This study was supported in part by the National Natural Science Foundation of China (nos. 61802113, 61802114, and 61602156).
Authors' Contributions
C.-K.Y. and W.-X.W. conceived and designed the approach. W.-X.W. performed the experiments. C.-K.Y. and W.-X.W. analyzed the data. C.-K.Y., W.-X.W., J.-L.W., and G.Z. wrote the article. All authors read and approved the final article.
Author Disclosure Statement
The authors declare there are no competing financial interests.
References
Supplementary Material
Please find the following supplemental material available below.
For Open Access articles published under a Creative Commons License, all supplemental material carries the same license as the article it is associated with.
For non-Open Access articles published, all supplemental material carries a non-exclusive license, and permission requests for re-use of supplemental material or any part of supplemental material shall be sent directly to the copyright owner as specified in the copyright notice associated with the article.