
Abstract
Biomarkers involved in the progression of Barrett's esophagus (BE) have not been extensively studied. We aimed to identify novel molecular markers for the early diagnosis of BE. The expression profiles of GSE100843 including BE segment and normal squamous mucosa samples before and after vitamin D3 supplementation were downloaded from Gene Expression Omnibus. Differentially expressed genes (DEGs) were identified using the limma package. Principal component analysis was performed using Minitab, and DEGs in the top three principal components were clustered into different gene sets by the mclust package. Pathways and functions enriched by these gene sets were evaluated by deregulation score analysis. Key genes associated with BE were identified by coexpression analysis and a genetic algorithm. Using the xgboost package, an XGBoost classifier specific for BE was further constructed based on the key genes. A total of 2598 DEGs were identified, which were further clustered into nine gene sets. According to the deregulation scores of pathways and functions enriched by these gene sets, nine functional and pathway terms were significantly deregulated in BE. Among the DEGs, CREB3L1, HNF1B, and IL35 were genes with high fitness levels and connectivity degrees, predicting that they were key genes associated with BE. The XGBoost classifier constructed using the key genes was efficient and robust in BE prediction. The accuracies for prediction were 93% and 87% for training and validation datasets, respectively. Key genes may serve as novel biomarkers of BE, and the XGBoost classifier may contribute to the diagnosis of BE in future clinical practice.
Introduction
Barrett's esophagus (BE), a condition where normal esophageal squamous mucosa is replaced by metaplastic columnar mucosa, may progressively develop to intramucosal and then invasive carcinoma (Spechler and Souza, 2014; Kaz et al., 2015). BE is a premalignant lesion to esophageal adenocarcinoma (EAC), and the risk of patients with BE to progress to EAC increases >11 times than that of the general population (Hvid-Jensen et al., 2011). Identifying BE patients at high risk of malignant transformation is important for the prevention of EAC (Yang et al., 2009). Although the increasing application of endoscopic imaging has contributed greatly to the diagnosis of BE (Almond and Barr, 2012), this method has a high misdiagnosis rate and is not feasible for early screening.
Given the limitations of endoscopic imaging, genomic analysis may detect molecular alterations that associate with the development of BE to improve the diagnosis of BE (Kaz et al., 2015). Several microarray studies have investigated molecular variations in BE (Streppel et al., 2014; Zhang et al., 2018b). The studies have shown that protein kinase C alpha (PRKCA), cadherin 17 (CDH17), and epiregulin are involved in the development of BE (Zhang et al., 2018b). In addition, BE is thought to progress to EAC through stages of dysplasia, in which the degree of dysplasia is one of the common predictors for EAC in the setting of BE (Shaheen, 2005).
It has been demonstrated that 80% and 90% of BE with high-grade dysplasia show increased expression of nuclear factor-kappa B P65 subunit (RELA) and nuclear factor-kappa B subunit 1 (NFκB-1), respectively, and all cases of EAC present increased expression of those two molecules (El Jamal et al., 2016). The upregulated caudal-related homeobox gene 2 (CDX2) and downregulated pituitary homeobox 1 (PITX1) are detected in BE tissues, and their expression levels are further elevated or reduced in dysplasia and EAC tissues (Lord et al., 2005). Moreover, the dysfunction of poly(ADP-ribose) polymerase (PARP1) in esophageal epithelial cells increases the levels of reactive oxygen species and oxidative DNA damage, which are common risk factors for BE and EAC (Zhang et al., 2018a). However, the pathogenesis of BE is poorly understood, and biomarkers involved in the progression of BE have not been extensively studied. Therefore, novel molecular markers specific for the development of BE are needed for diagnostic and therapeutic applications.
Recently, Cummings et al. (2017) exploit the GSE100843 dataset to assess the effect of vitamin D3 (cholecalciferol) supplementation on BE, and no significant alterations in gene expression profiles of GSE100843 dataset were observed in response to vitamin D3 supplementation. However, Cummings et al. (2017) failed to conduct follow-up investigations for identification of molecular alterations in BE by comparing the expression profiles of BE segment and normal squamous mucosa samples.
To identify novel molecular markers specific for BE, we reanalyzed the GSE100843 dataset (Cummings et al., 2017). Differentially expressed genes (DEGs) were identified by expression profile analysis. Subsequently, key genes associated with BE were identified by an optimized bioinformatic strategy, which combined principal component analysis (PCA), clustering analysis, pathway deregulation score analysis, coexpression analysis, and a genetic algorithm. The BE-specific XGBoost model was constructed based on the key genes. The key genes and the XGBoost model may contribute to the development of novel and efficient diagnostic tools and therapies for BE in clinical practice.
Methods
Data source and preprocessing
The expression profile of BE under accession number GSE100843 (Cummings et al., 2017) was downloaded from the GEO database (https://www.ncbi.nlm.nih.gov/geo; Barrett et al., 2013). The dataset was obtained from a clinical trial study approved by the Institutional Review Board at the coordinating center of University Hospitals Cleveland Medical Center, Cleveland Clinic, and Louis Stokes Cleveland Veterans Affairs Medical Center (Cummings et al., 2017). Patients with long-segment (≥3 cm) or short-segment (<3 cm) BE showing distal esophageal intestinal metaplasia were included (Cummings et al., 2017). Exclusion criteria included EAC, previous ablation therapy, pregnancy, age <18 years, Child's B cirrhosis, chronic kidney disease, history of allergic reaction to study drugs, and hypercalcemia (Cummings et al., 2017). Written informed consent was obtained from all subjects included in the clinical trial (Cummings et al., 2017).
RNA was isolated from frozen BE and normal squamous mucosal specimens, and subjected to microarray expression analysis using the Affymetrix platform (Cummings et al., 2017). A total of 76 samples were included in the dataset, including 40 BE segments (20 segments before vitamin D supplementation and 20 segments after vitamin D supplementation) and 36 normal squamous mucosa samples (18 samples before vitamin D supplementation and 18 samples after vitamin D supplementation). The dataset contained 32,321 probes, and all the expression values were adjusted by the Z-test (Cheadle et al., 2003). The probes were converted to gene symbols according to annotation information. For genes mapped with multiple probes, their expression values were defined as the mean expression values of corresponding probes.
Screening of DEGs
The DEGs between BE samples and normal samples were screened using the R package limma (version 3.32.5, http://bioconductor.org/packages/release/bioc/html/limma.html; Diboun et al., 2006). p Value <0.01 and log2FC (fold change) < −1.4 (below 5th percentile) or >1.24 (above 95th percentile) were set as the selection criteria for DEGs.
Analysis of the impact of vitamin D supplementation for BE
To analyze whether vitamin D supplementation could alter the gene expression profiles of BE, DEGs between BE segment samples before (n = 20) and after (n = 20) vitamin D supplementation were identified using limma software with the aforementioned selection criteria.
Clustering analysis
Based on the expression values of the DEGs, all the samples were subjected to hierarchical clustering analysis using the R package pheatmap (version 1.0.8, https://cran.r-project.org/package=pheatmap; Gu et al., 2012). The clustering result was visualized as a heatmap.
DEGs were also clustered to reveal their functional relations. To cluster DEGs into appropriate gene sets, PCA (Alizadeh Behbahani et al., 2017) was first performed, and the top three principal components (PCs) were identified by the Minitab version 17 software. Based on the top three PCs, DEGs were clustered into different gene sets using the mclust algorithm (https://cran.r-project.org/web/packages/mclust/; Scrucca et al., 2016). The optimal number of gene sets was evaluated by the Bayesian information criterion (Katsikatsou and Moustaki, 2016).
Functional annotation
Functional annotation for each gene set was performed using the DAVID online tool (version 6.7, https://david.ncifcrf.gov/; Huang et al., 2007). p Value <0.05 was set as the significant threshold for gene ontology (GO), biological processes (BPs), and Kyoto Encyclopedia of Genes and Genomes (KEGG) pathways.
The deregulation score can be used to define the level of a function or a pathway deviated from the normal state. Euclidean distance (Lumijarvi et al., 2004)-based deregulation score is defined as follows:
where A(P) is the deregulation score of the functional term P, m and n are the number of upregulated and downregulated DEGs in the functional term P, respectively, Xi and Xj represent the expression values of genes i and j, respectively, and μi and μi represent the mean expression values of genes i and j in normal squamous mucosa samples, respectively. Deregulation scores of functional terms were calculated for each sample. A(P) = 0 indicated a balance between up- and downregulated genes in the corresponding functional term, whereas A(P) > 0 and <0 represented an advantage of upregulated and downregulated genes, respectively. For terms enriched by multiple gene sets, the deregulation scores of the same term were further averaged. Deregulation scores were adjusted by the Z-test for normal squamous mucosa samples. Using the Wilcox test (Kim, 2015), the scores were compared between BE samples and normal samples for each functional term. p Value <0.05 was set as the selection criterion for BE-associated functional terms. The genes enriched in these functional terms were combined and considered to be the feature genes of BE.
Pearson's correlation coefficients (Pearson, 2006) between DEGs were calculated based on their expression values. DEG pairs with higher coefficients (>95th quantile) were considered to be coexpression pairs and were used to construct a coexpression network. The connectivity degree of each node in the network was further analyzed. Nodes with higher connectivity degrees were considered to be hub nodes.
Selection of optimal subset of feature genes
A genetic algorithm (Scrucca et al., 2013) that simulates the biological evolution process to solve optimization problems was used to select the optimal combination of feature genes. All the feature genes were first randomly combined to obtain initial feature chains, the length of which was set as half the number of feature genes. A pair of feature chains was crossed to produce a new generation of feature chains, which contained all the feature information from the parent chains. The fitness levels (prediction accuracies) of the new chains were calculated, and those with the top fitness levels were selected for the next iteration of the algorithm. The procedure was terminated when the iteration number reached the maximum (100), or a satisfactory fitness level was achieved. Then, the length of the initial feature chains was gradually reduced, and the above procedure was repeated until the optimal combination of feature genes was obtained.
Construction of XGBoost model
The R package xgboost (https://cran.r-project.org/web/packages/xgboost/index.html) was used for the construction of the XGBoost classifier, and the expression values of the optimal subset of feature genes were used as eigenvalues for the training of the XGBoost model (Torlay et al., 2017). The samples were randomly divided into two groups (training dataset and validation dataset). The initialization parameters booster, learning_rate, n_estimators, and max_depth were set as gbtree, 0.1, 1000, and 5, respectively. Other initialization parameters were set as defaults. Using the gridsearch algorithm form, the Python package scikit-learn (http://scikit-learn.org/stable/; Pedregosa et al., 2013), parameters including learning_rate, n_estimators, subsample, and colsample_bytree were optimized during the training process. Finally, the prediction efficiency was evaluated by receiver operating characteristic (ROC) curve.
Results
DEGs and clustering analysis
A total of 2598 DEGs (1299 upregulated and 1299 downregulated) were identified between BE samples and normal samples. Unsupervised hierarchical clustering analysis based on the expression value of DEGs was performed to confirm the specificity of DEGs. As expected, BE samples and normal samples could be clearly grouped into two different clusters, which showed distinct expression profiles (Fig. 1A). Furthermore, the expression pattern of DEGs in BE samples was much more nonhomogeneous than that found in normal samples (Fig. 1A).
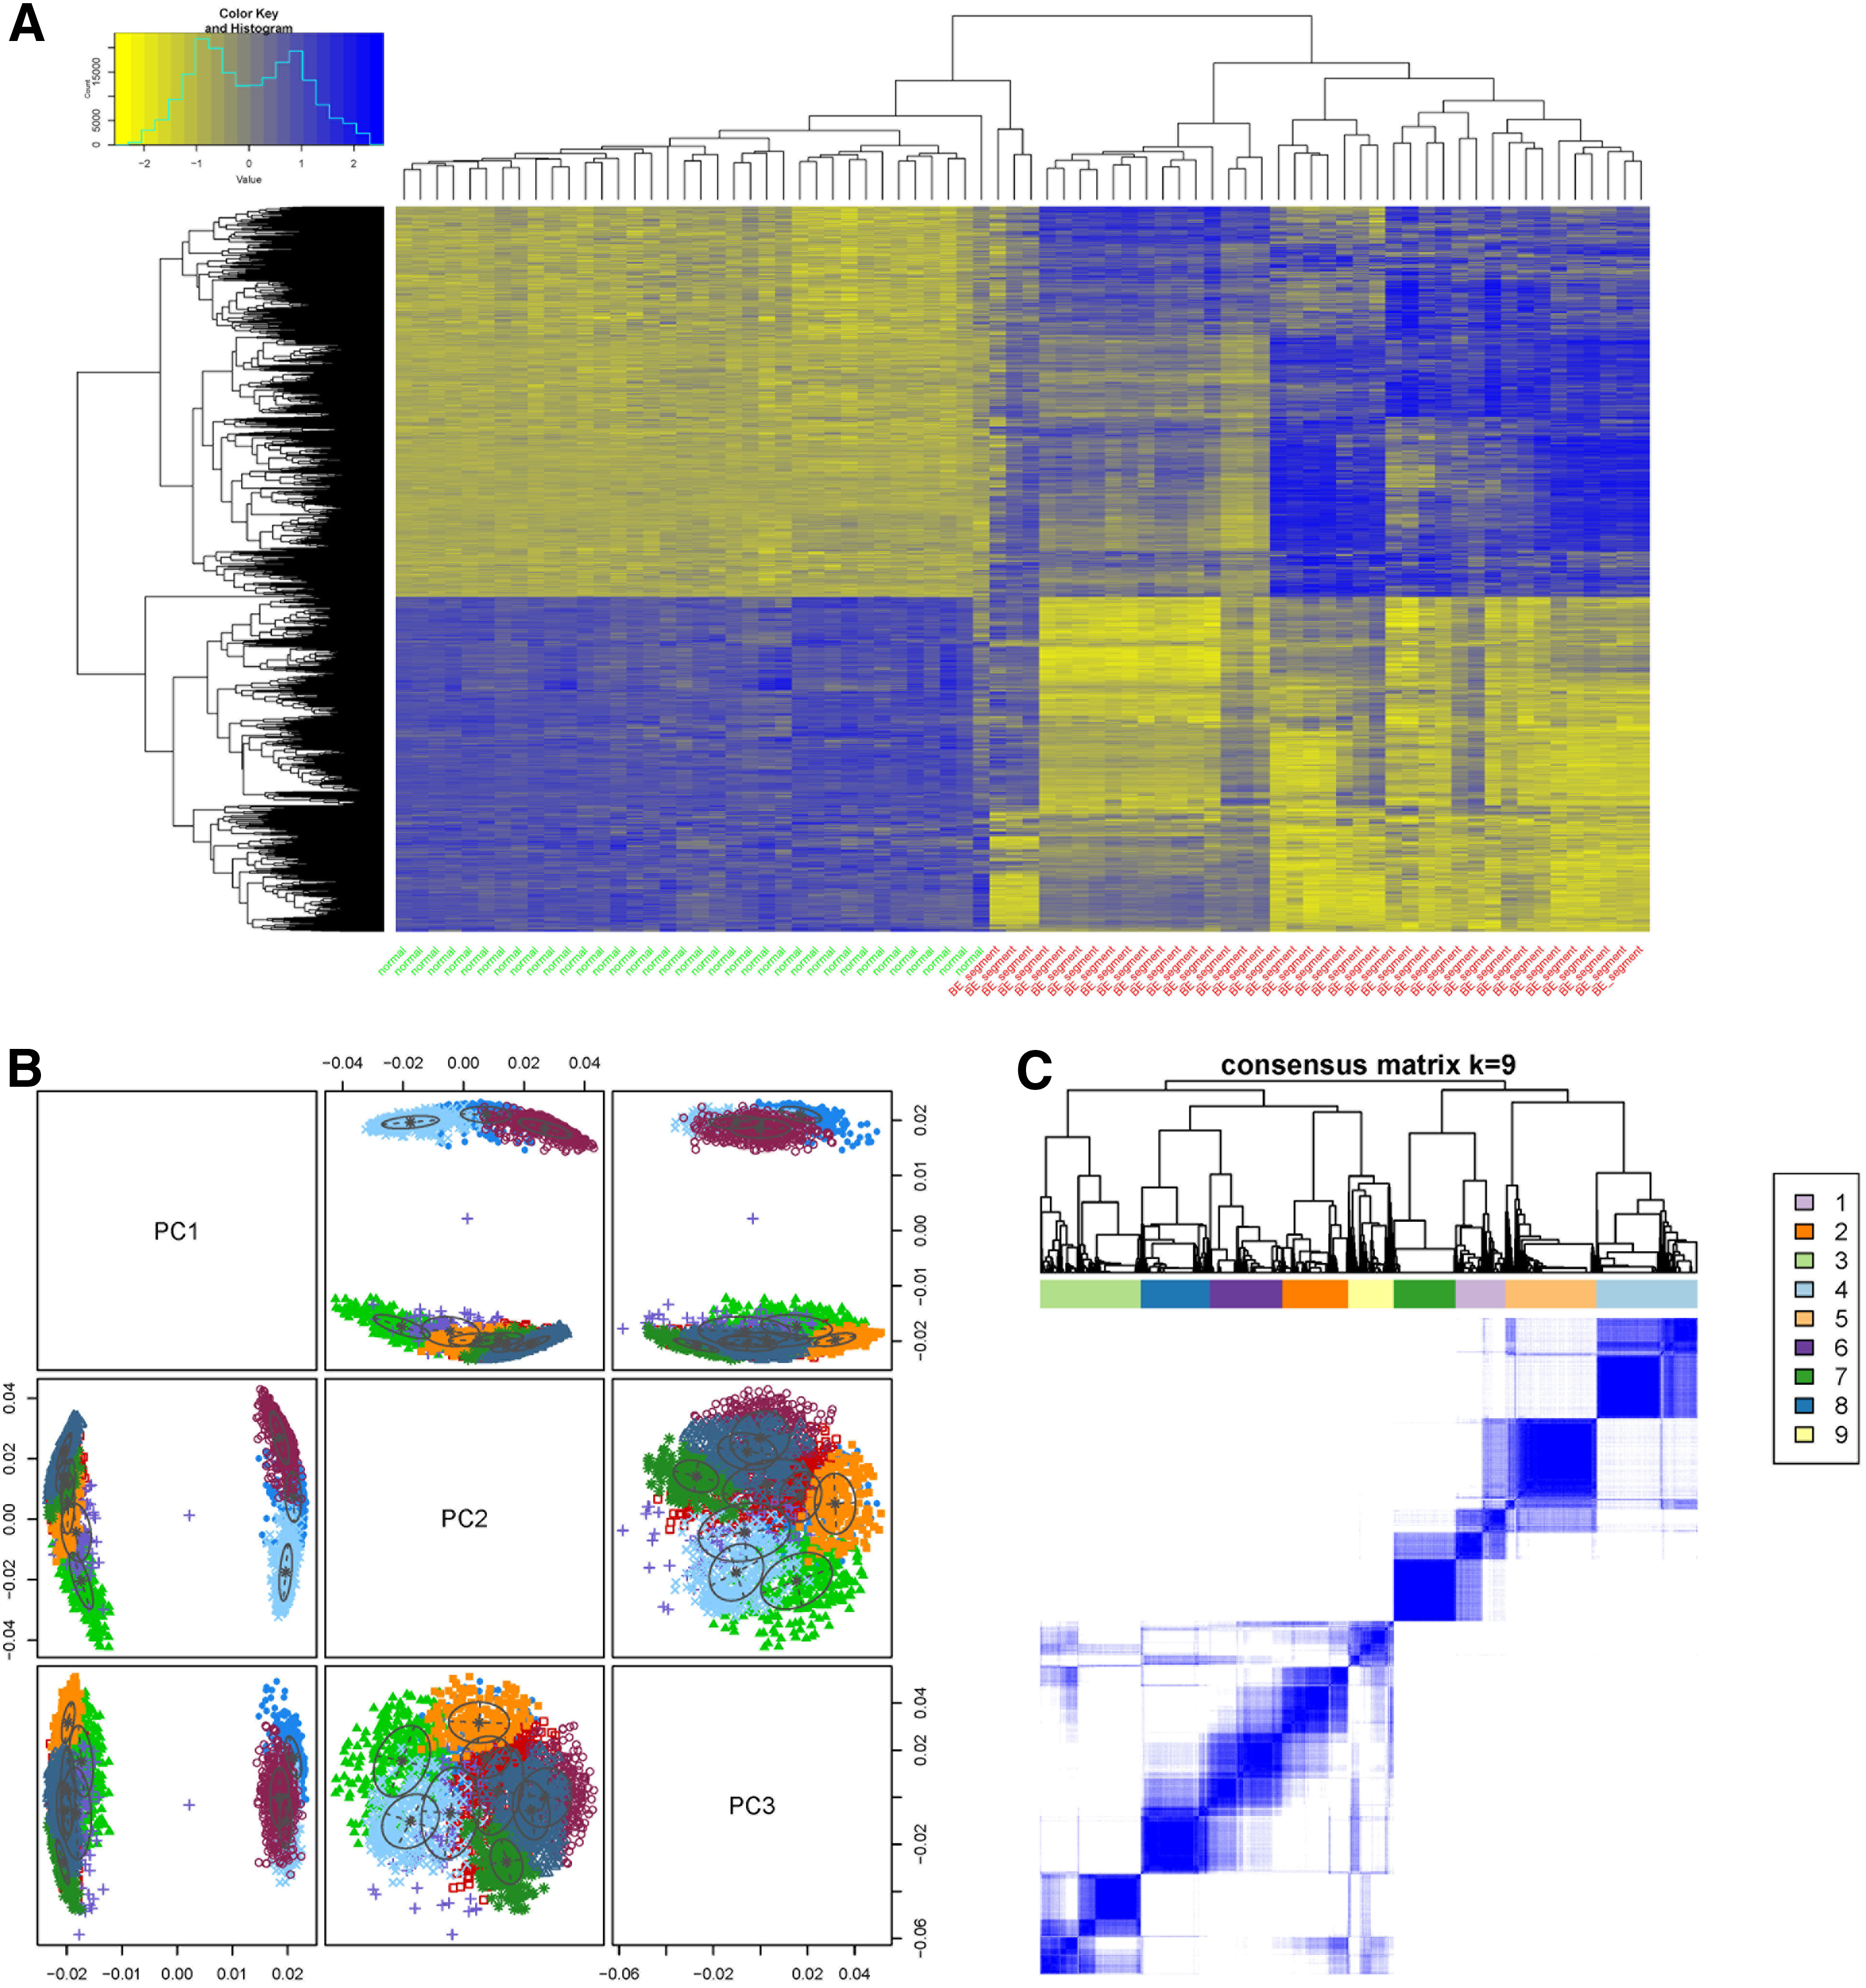
Clustering analysis of DEGs.
To reveal functional relationships among DEGs, the top three PCs were identified by PCA and were used for clustering analysis. In total, nine gene sets were identified and designated as gene sets 1–9. The distributions of these gene sets showed significant differences (Fig. 1B). A correlation matrix was also calculated to reveal the correlations between genes in the nine gene sets (Fig. 1C). Strong correlations were found among DEGs within each gene set.
With the same selection criteria, a set of 26 DEGs were identified to be involved in vitamin D supplementation for BE. However, the majority of the genes were not differentially expressed (Fig. 2). In addition, the 26 DEGs were only composed of 1% DEGs identified across BE and normal samples, and analysis of variance showed that the p value was not significant (p = 0.76). Thus, there were no significant changes in gene expression for BE after vitamin D supplementation.
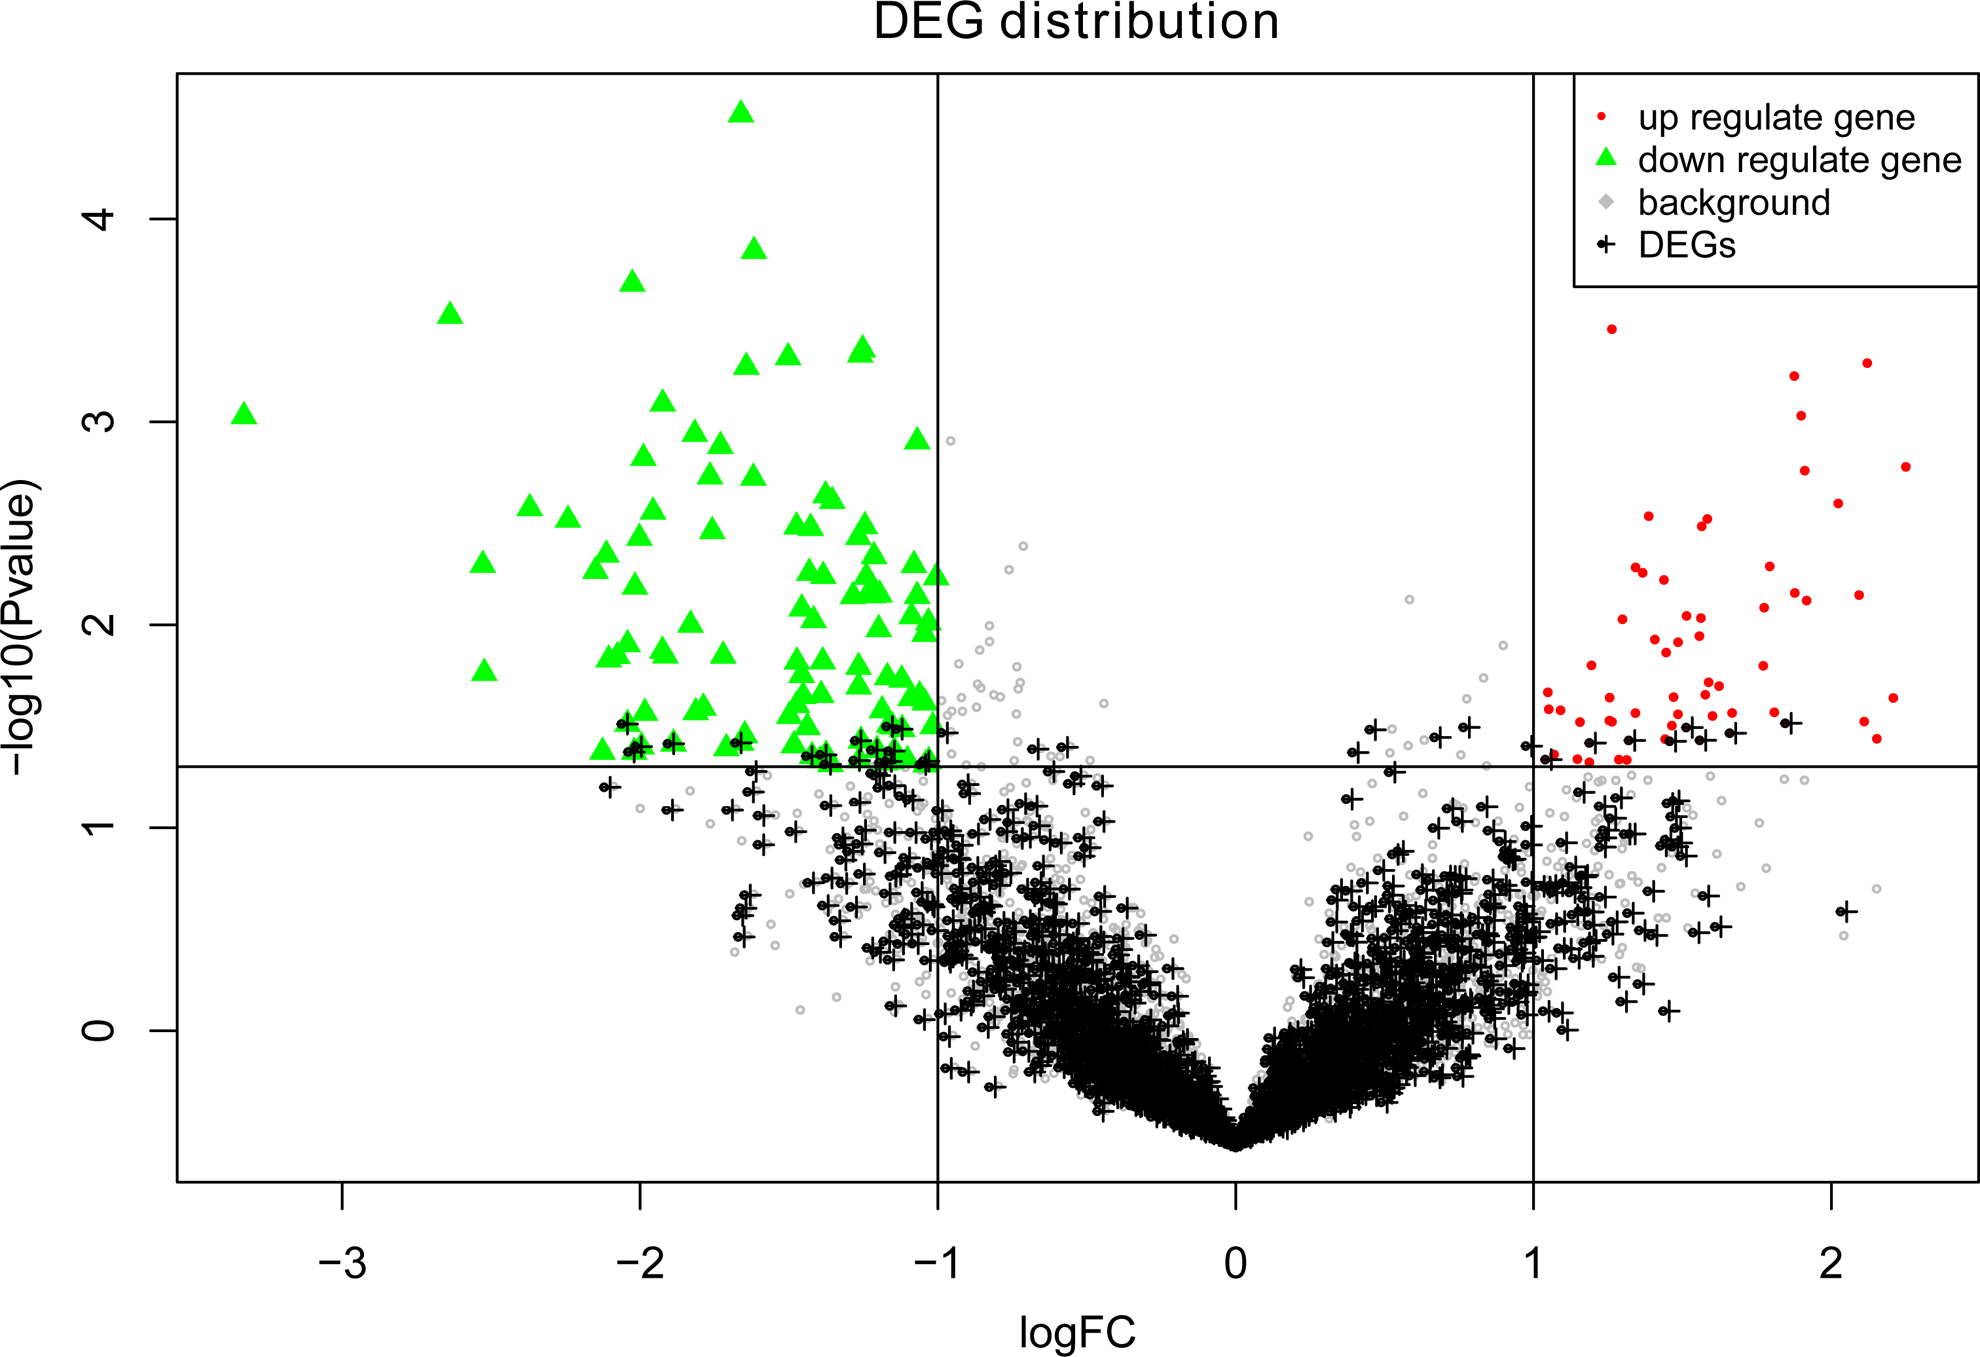
Volcano plot of gene distribution. The x-axis represents the log2(fold change) value and the y-axis represents the −log10(p value). The upregulated and downregulated DEGs identified between BE segment samples before and after vitamin D supplementation are denoted by red dots and green dots, respectively. The gray dots denote non-DEGs, whereas the black dots represent the DEGs identified across BE and normal samples.
GO_BP and KEGG pathway analyses were performed to explore the functions related to each gene set. Multiple GO and KEGG terms were obtained for each gene set, and the most significant two terms were selected to explain the main functions of each gene set (Fig. 3A).
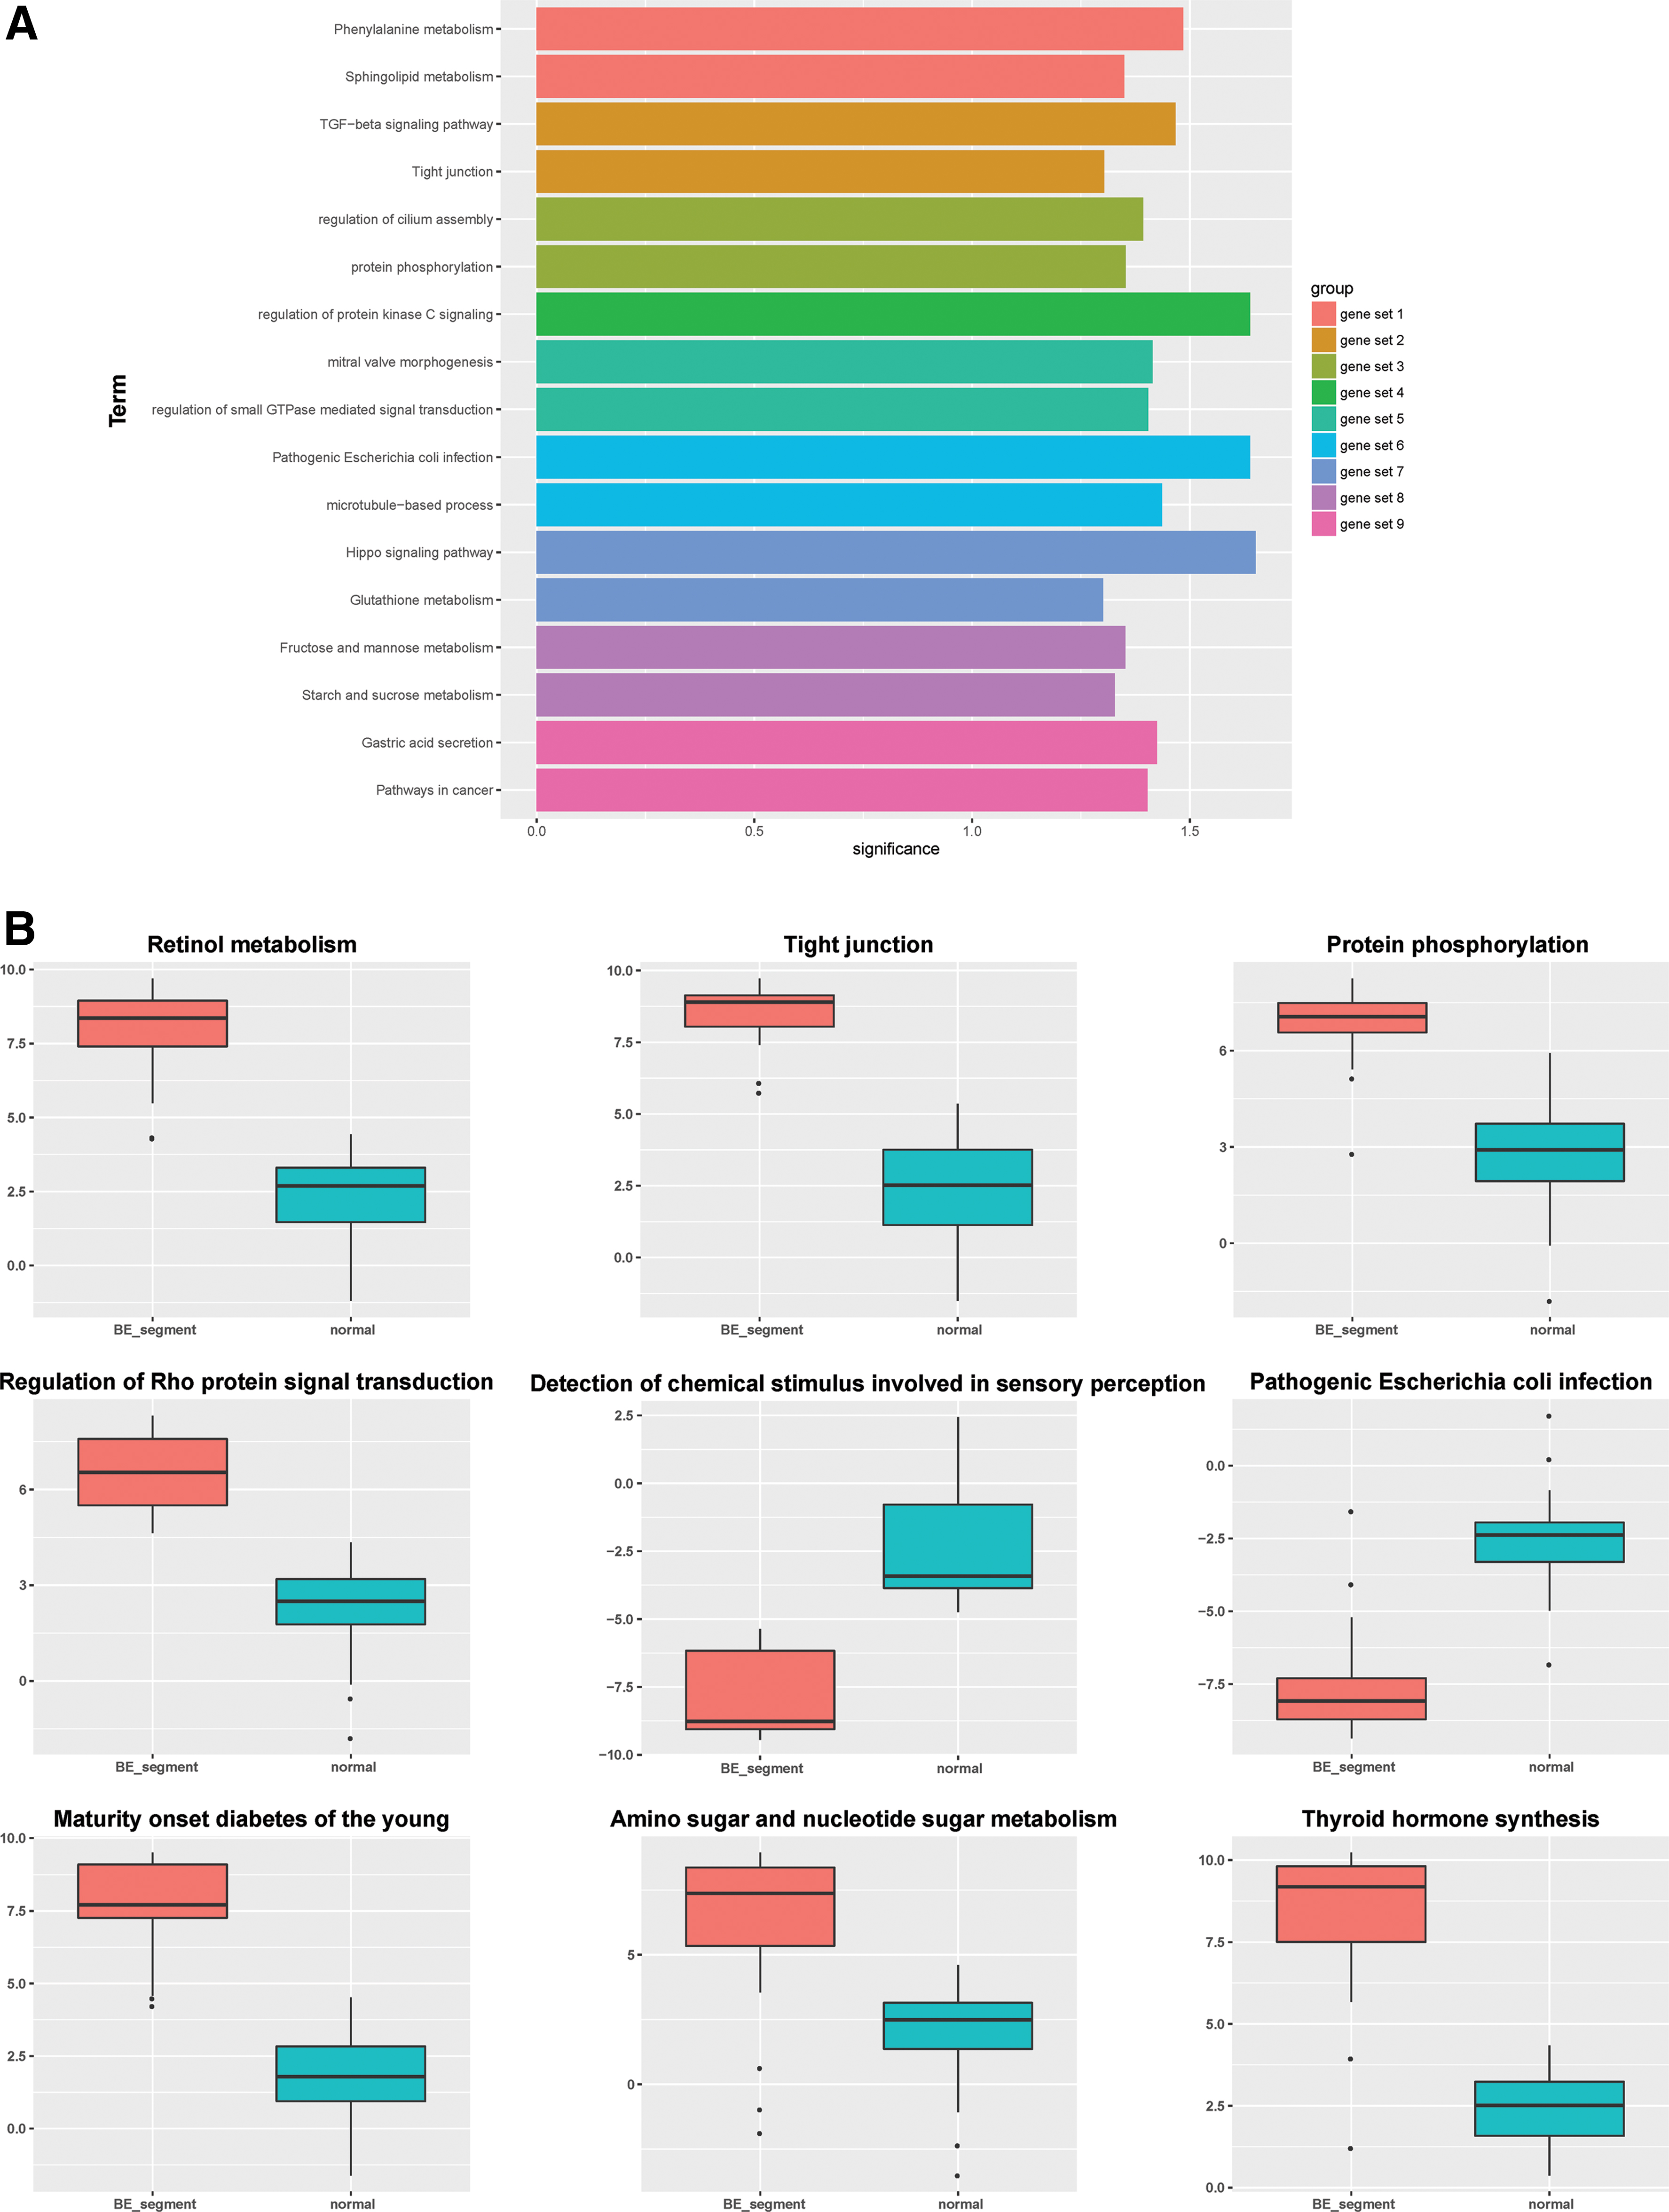
Functional and pathway annotations of the nine gene sets.
To evaluate the functional differences between BE and normal samples at a quantization level, and to identify BE-associated functions, the deregulation scores of the GO and KEGG terms were calculated for each sample. Deregulation scores of a total of 68 terms were obtained. Nine terms displayed significant differences between BE and normal samples (Fig. 3B). Most of the terms including protein phosphorylation and regulation of Rho protein signal transduction were functionally upregulated in BE samples, except for the detection of chemical stimuli involved in sensory perception and pathogenic Escherichia coli infection.
The coexpression pairs with coefficients >0.88 corresponding to 95th quantile were selected as significant coexpression pairs, and a total of 1256 were identified (Fig. 4A). The coexpression network (Fig. 4B) comprised of 481 nodes and 1256 edges. According to the distribution of connectivity degrees (Fig. 4C), nodes with log2(degree) >7.3 were considered to be hub nodes (e.g., CREB3L1, HNF1B, and IL35).
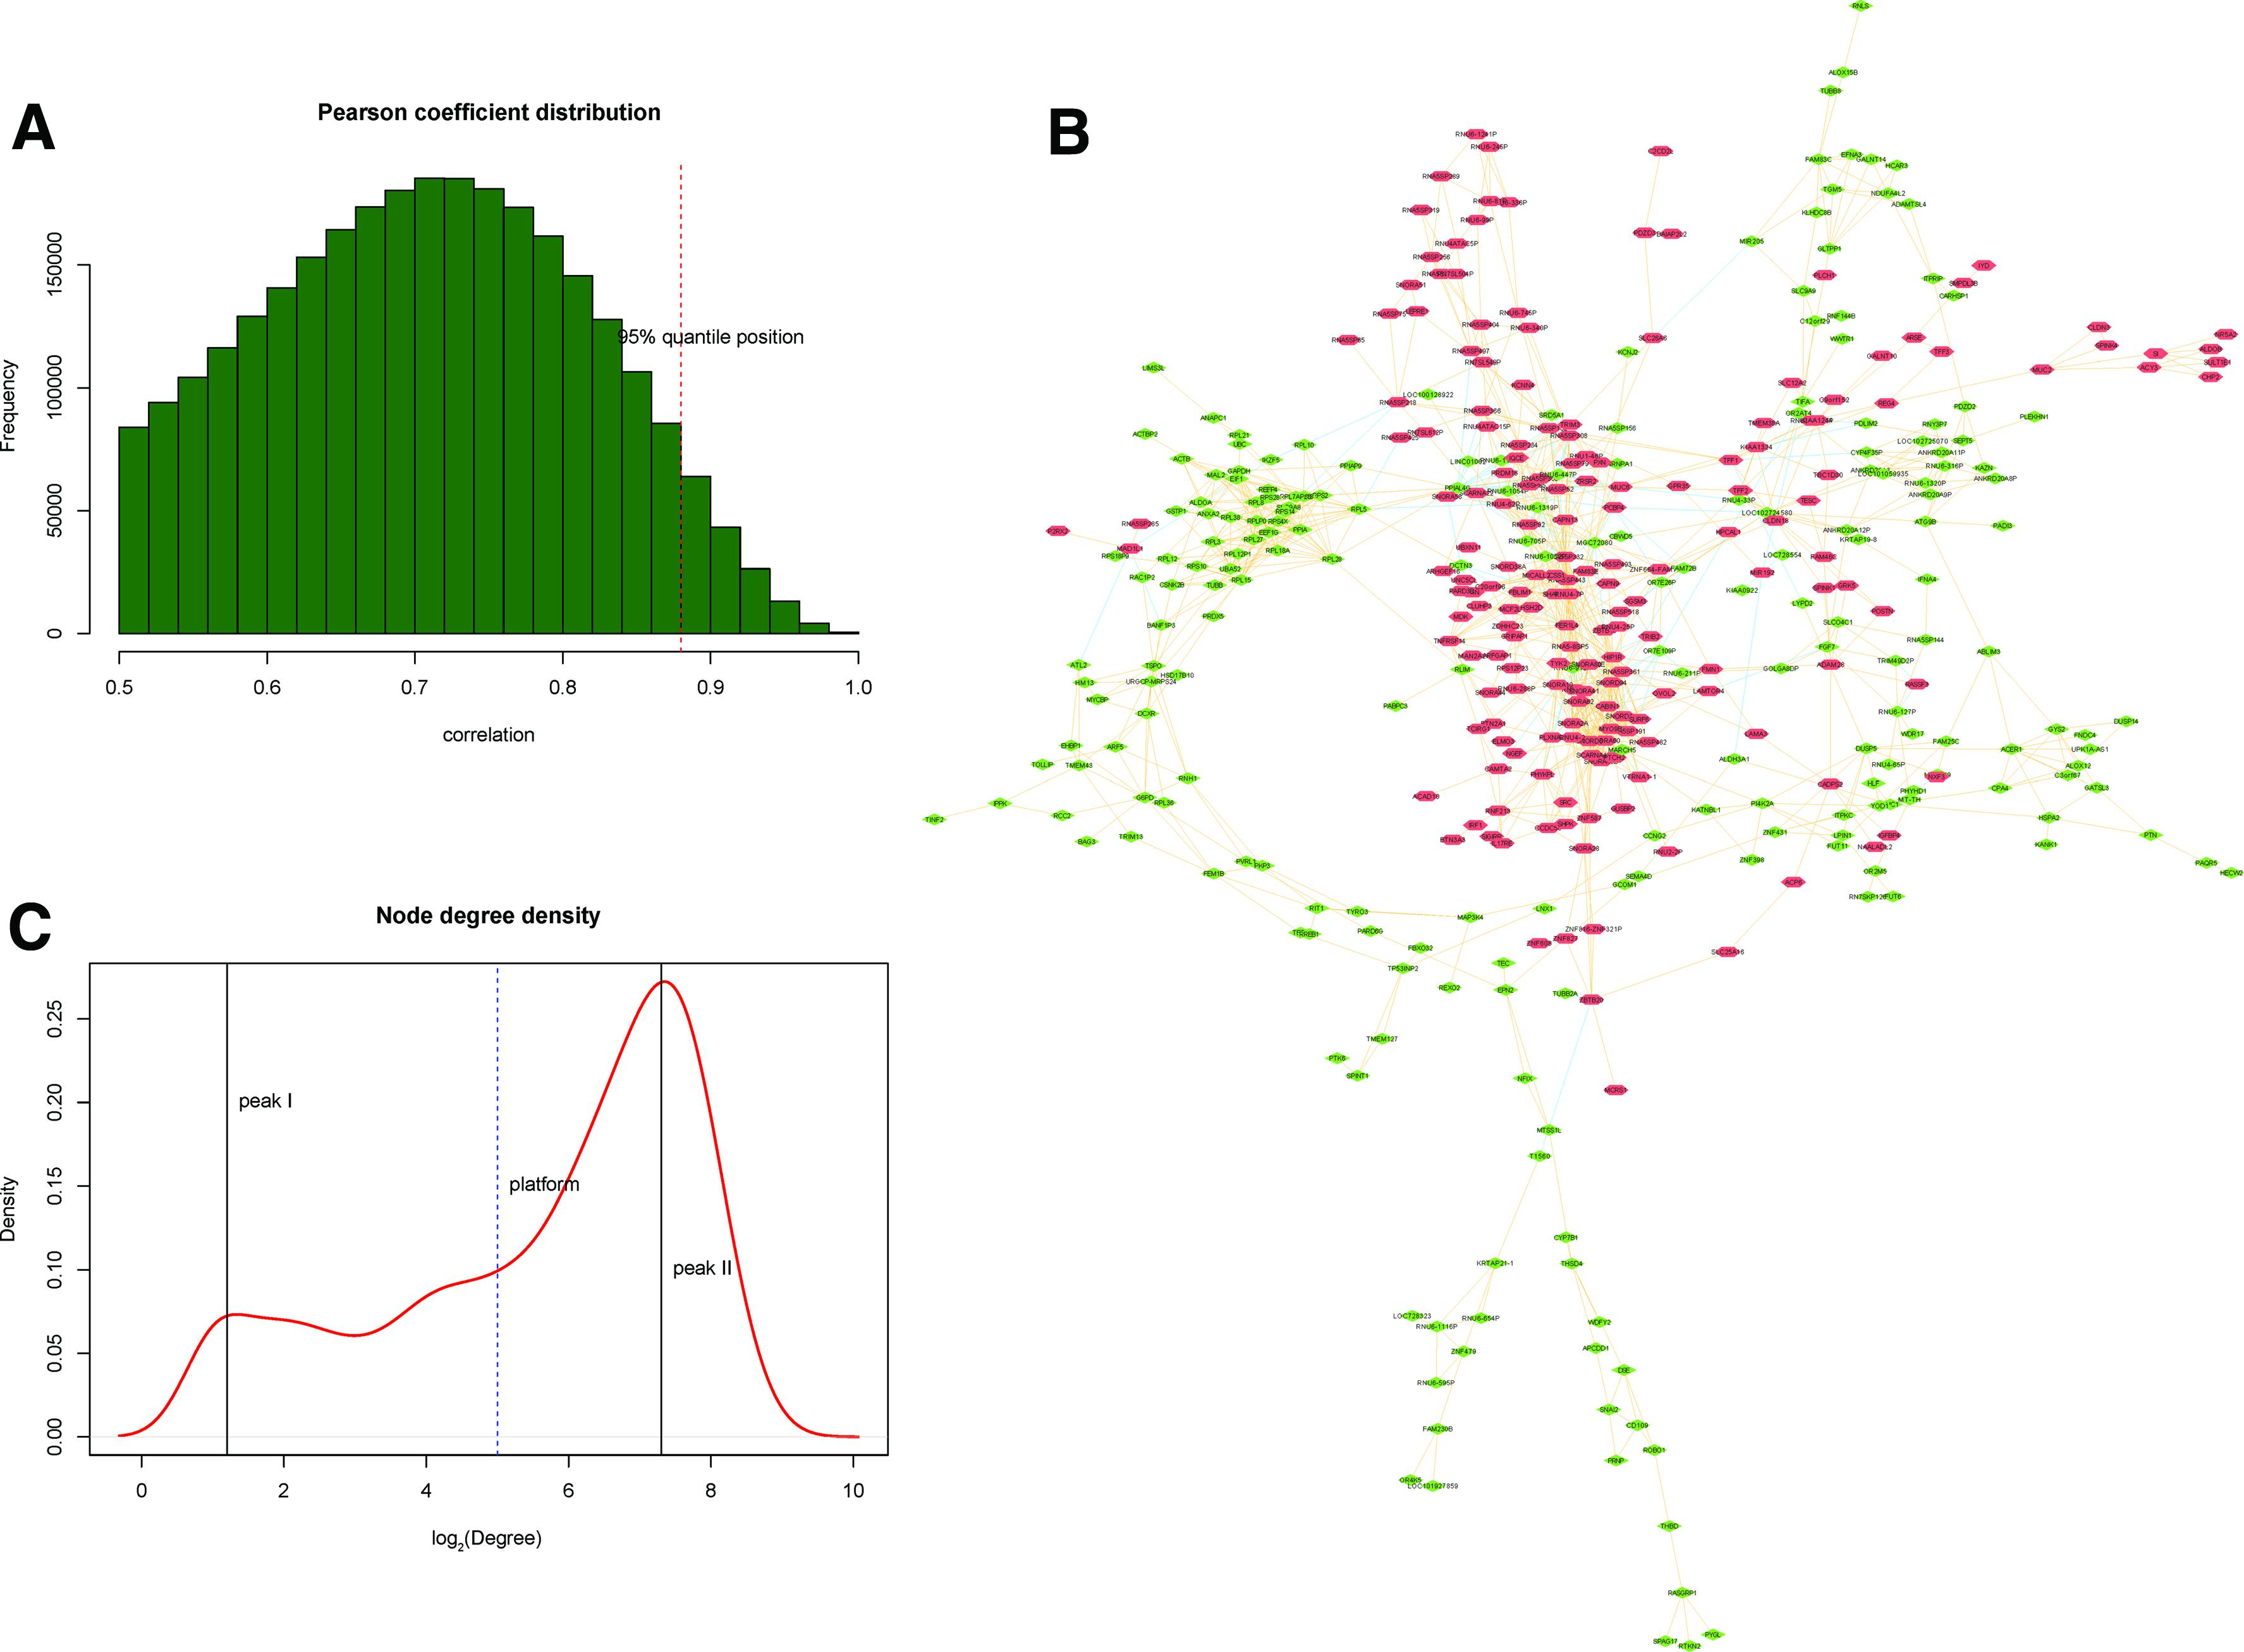
Coexpression analysis of DEGs.
Genes enriched significantly in the GO and KEGG terms were used to select feature genes. The optimal subset of feature genes was obtained when the iteration number reached the maximum (100). As a result, a total of eight feature genes with fitness levels >0.5 were selected by the genetic algorithm (Fig. 5A; Table 1). Among these genes, actin-related protein 2/3 complex subunit 2 (ARPC2), cAMP responsive element binding protein 3-like protein (CREB3L1), hepatocyte nuclear factor-1 beta (HNF1B), and interleukin-35 (IL35) displayed strikingly higher fitness levels (Table 1). Moreover, CREB3L1, HNF1B, and IL35 genes were among the hub nodes of the coexpression network. Therefore, CREB3L1, HNF1B, and IL35 were considered to be key genes associated with BE. Subsequently, the three-dimensional (3D) coordinate system constructed on the basis of the expression values of the three key genes revealed that BE and normal samples could be clearly divided into two groups (Fig. 5B).
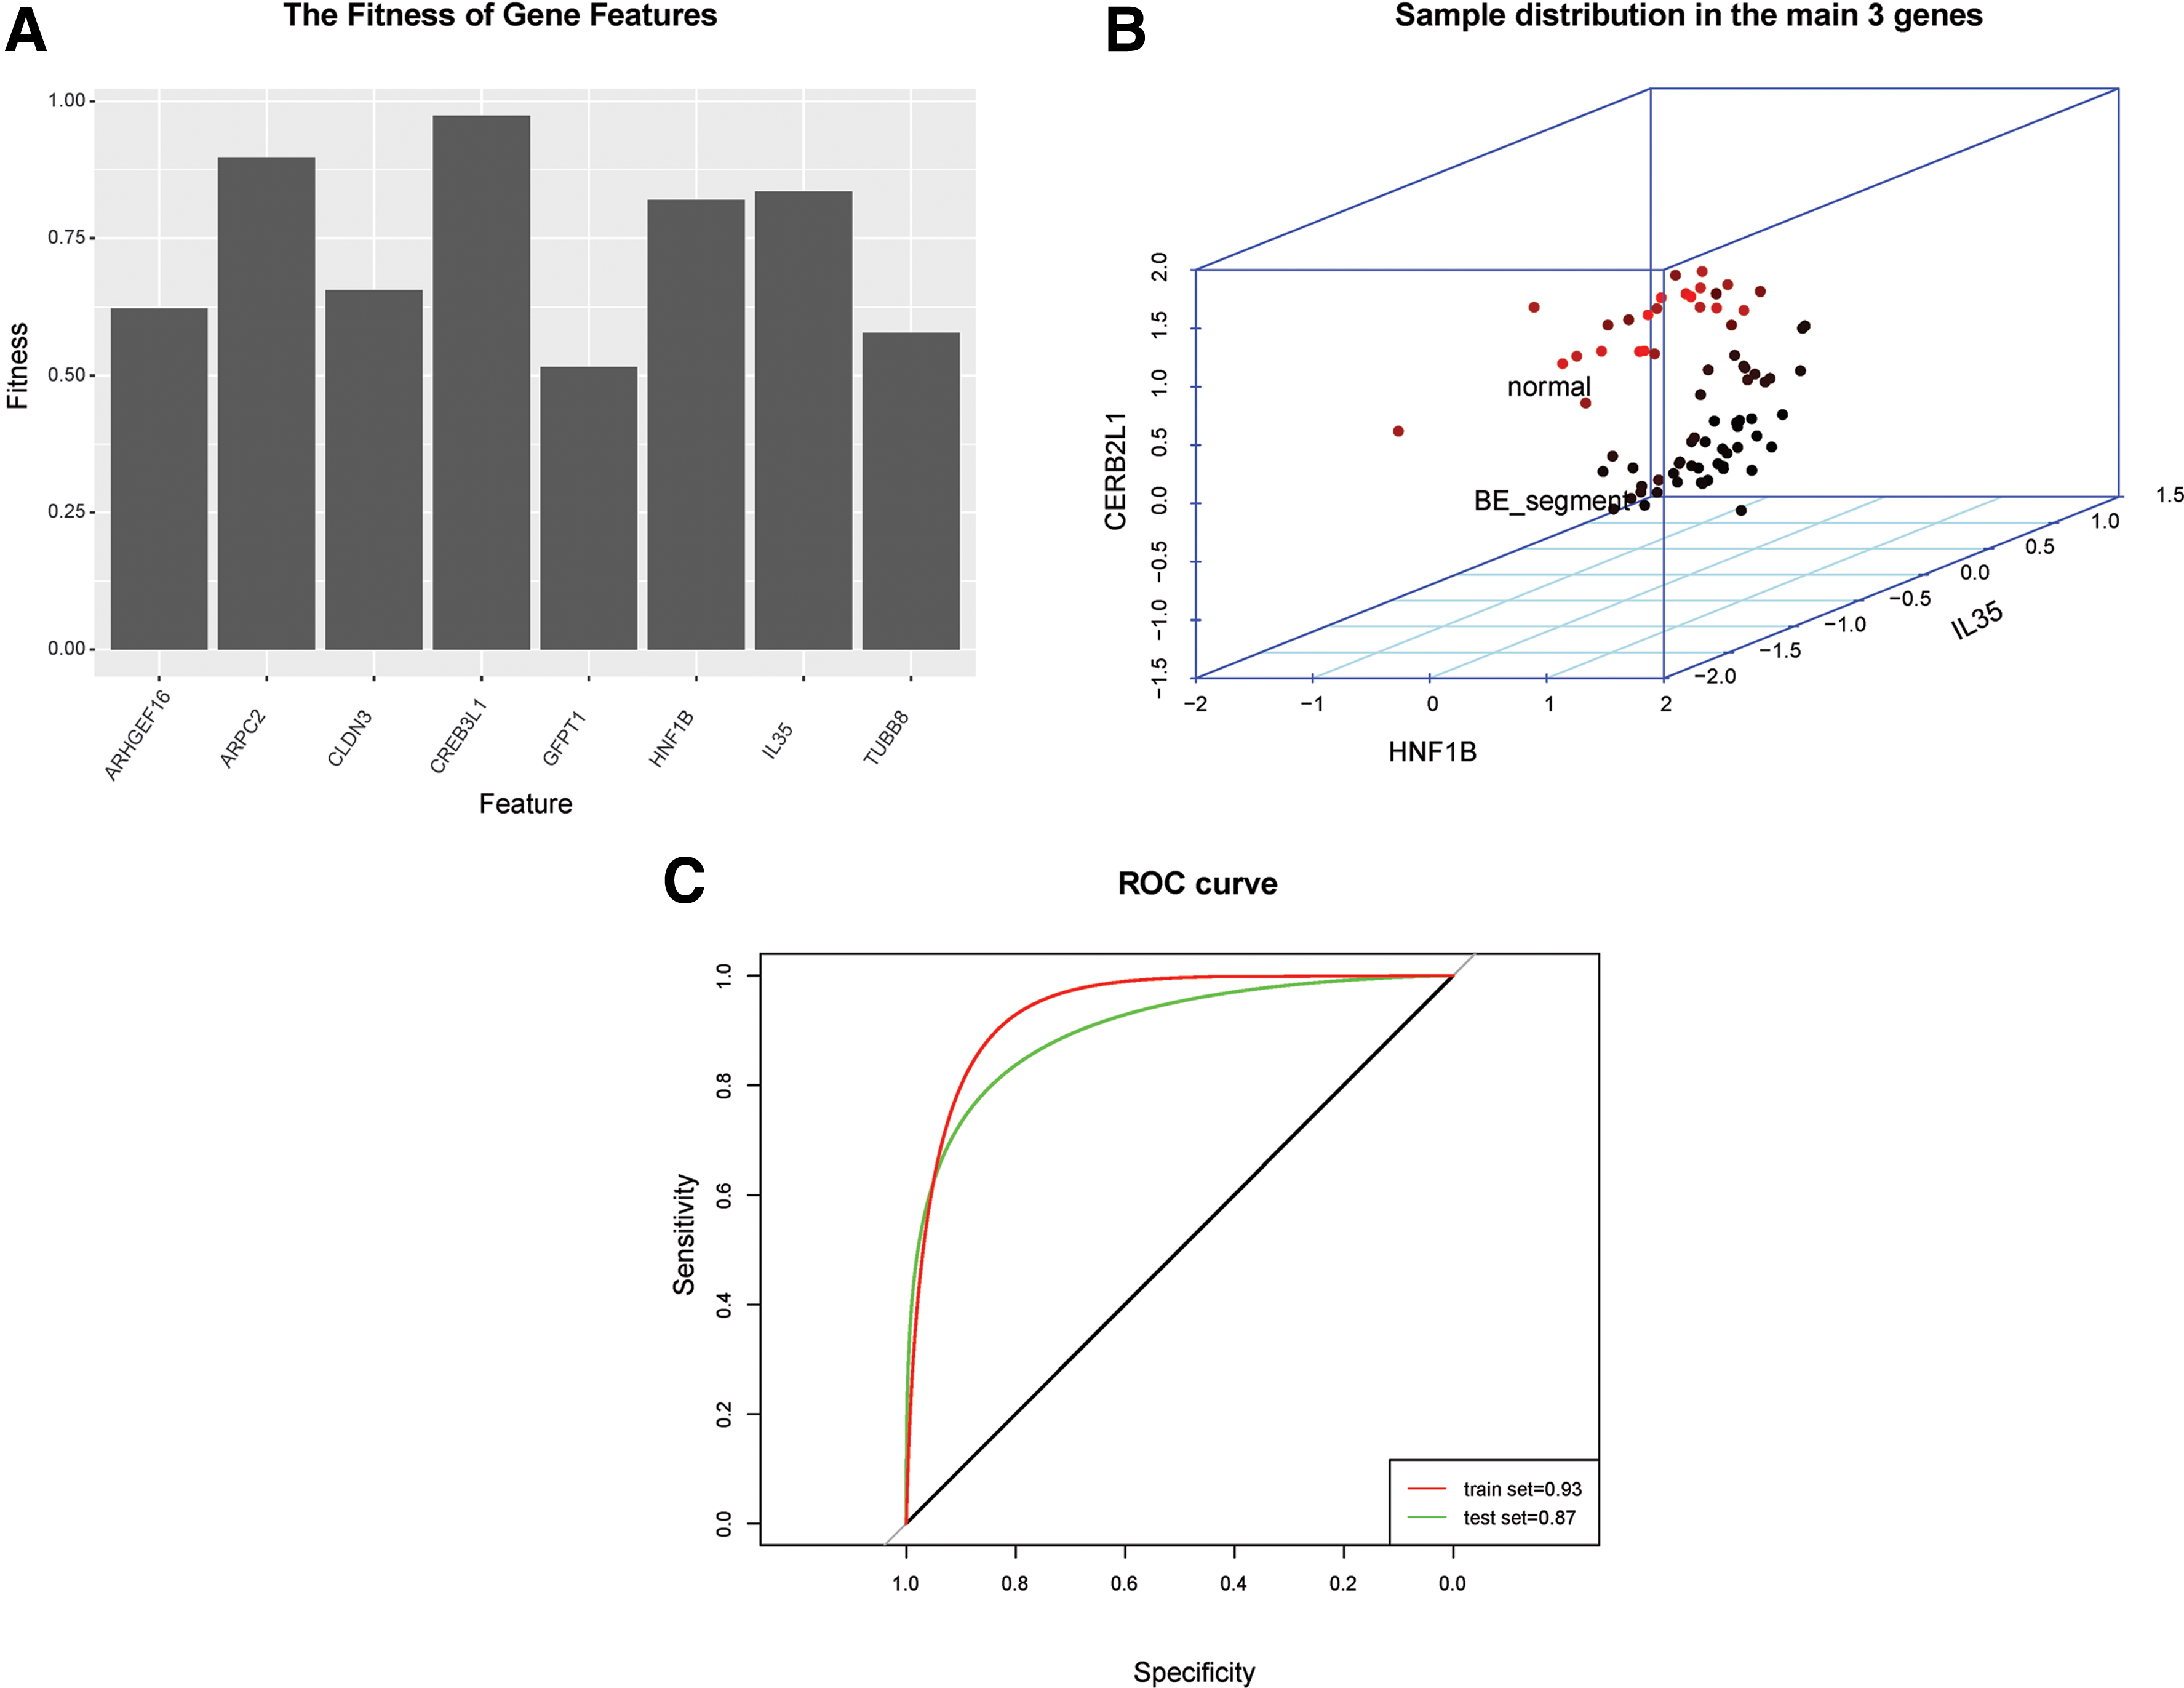
Key genes associated with early esophageal adenocarcinoma.
The Information of Fitness Value and Connectivity Degrees for Feature Genes
The XGBoost classifier was constructed for BE prediction and diagnosis. Three key genes were used as features for XGBoost model training. Parameters were optimized during model training. After parameter optimization, learning rate, n_estimators, subsample, and colsample_bytree were 0.01, 10, 0.8, and 0.8, respectively. According to the ROC curve, the XGBoost classifier was very accurate for both the training (93% accuracy rate) and validation (87% accuracy rate) datasets (Fig. 5C).
Discussion
Early detection and prevention of BE call for efficient and accurate molecular diagnostic tools (Kaz et al., 2015). In this study, we compared the expression profiles of BE segment and normal squamous mucosa samples, and identified eight feature genes associated with BE by XGBoost model prediction. The fitness levels of genes CREB3L1, HNF1B, and IL35 were higher among eight feature genes, and they were also hub nodes in the coexpression network. The key 3 feature genes could clearly divide the BE and normal squamous mucosa samples into two groups, and had a high diagnostic accuracy rate for BE, revealing that they might be valuable markers for BE diagnosis.
The patients in the GSE100843 nonrandomized trial had received vitamin D supplementation. Thus, it was necessary to evaluate whether vitamin D supplementation could impact the gene expression profiles of BE. A significant relationship between dietary vitamin D intake and EAC risk has been described (Mulholland et al., 2011), and vitamin D receptor is strongly expressed in Barrett's mucosa of BE and EAC, and is absent in normal esophageal squamous mucosa (Trowbridge et al., 2012). However, the opposite results are obtained in other studies, in which the change in serum 25-hydroxy (25-OH) vitamin D levels does not appear to influence the progression of dysplasia in BE (Thota et al., 2016), and no associations between circulating 25-OH vitamin D levels and any upper gastrointestinal tract cancer (including EAC) were found (Abnet et al., 2010). In addition, no significant changes in gene expression for BE after vitamin D supplementation are reported in the nonrandomized trial (Cummings et al., 2017), which is consistent with our results.
CAMP responsive element binding protein 3 like 1 (CREB3L1) is a CREB3 family member with bZIP domain existing in the membrane of endoplasmic reticulum (ER), and in response to stress in the ER, the protein encoded by this gene is cleaved and the released cytoplasmic transcription factor domain translocates to the nucleus (Panagopoulos et al., 2007; Denard et al., 2015). The proteolytic activation of CREB3L1 has also been associated with the suppression of cancer cell proliferation (Denard et al., 2012). In addition, it has been reported that the activation of IL-6 and RANTES promoters in H pylori infection requires binding sites of CRE-binding protein (Hong et al., 2005), and H pylori infection is a strong risk factor for the development of BE and esophagitis (Sharifi et al., 2014). Like CREB3L1, HNF1 homeobox B (HNF1B) is a transcription factor and a member of the homeodomain-containing superfamily, which regulates many genes in liver and pancreas (Odom et al., 2004). HNF1B mutation at 17q12 region is detected to be associated with esophageal atresia (Faguerabc et al., 2011). Also, the biliary anomalies are found in diabetes patients with HNF1B carriers (Kettunen et al., 2017). In addition, the differentiation marker of HNF1α is expressed in rat intestinal metaplasia, but not squamous epithelium in all cases (111 cases; Chen et al., 2008; Paces-Fessy et al., 2012).
IL35 is an inhibitory cytokine expressed on the surface of regulatory T and B cells, which mediates the immune inhibitory function (Collison et al., 2010; Shen et al., 2014; Pylayeva-Gupta, 2016). Accordingly, IL35 may also play an oncogenic role by impairing the antitumor immune response (Pylayeva-Gupta, 2016). IL35 is a heterodimeric anti-inflammatory cytokine consisting of IL-12A (p35), and liver fibrosis is observed in IL-12A (p35) deleted dominant-negative transforming growth factor beta receptor T cells (Masanobu et al., 2013). Notably, inflammation is a possible factor in the pathogenesis of BE in achalasia patients, and the levels of Th22, Th17, Th2, regulatory T cells (CD3+/CD4+/CD25hi/IL-35+, CD3+/CD8+/CD28−/IL-35+), regulatory B cells (CD3+/CD19+/CD38hi/IL-35+), and regulatory plasmacytoid dendritic cells are remarkably increased in BE/achalasia group than in achalasia group (Torres-Landa et al., 2016). Although none of the three key genes has previously been reported to be associated with BE, they play roles in H pylori infection, biliary anomalies, or inflammation reactions, which are closely related to BE. Thus, we speculated that they might also play critical roles in the development of BE and might serve as novel molecular markers of BE. However, further experimental investigations are required to reveal their specific roles in BE.
The involvement of the key genes in BE was further supported by their utility in discriminating disease from normal samples. The 3D coordinate system constructed on the basis of the three key genes clearly discriminated the BE segment samples from normal squamous mucosa sample. Moreover, the XGBoost classifier was very efficient in predicting sample types. The prediction accuracies of the classifier were 93% and 87% for the training and validation datasets, respectively.
The key genes associated with BE were identified by an optimized combination of bioinformatic methods, including PCA, clustering analysis, pathway deregulation score analysis, genetic algorithm, and coexpression analysis. The main advantage of our strategy was that it overcame the traditional analysis regarding the identification of biomarkers at the single gene expression level, which reduces the stability of the results and features a high false-positive rate. In this study, the expression and function consistency among DEGs in the biological samples were considered when grouping DEGs into different gene sets by PCA and clustering analysis. In addition, the gene set with functional consistency was selected by calculating pathway deregulation scores to quantify function. Significantly deregulated functions and pathways were identified.
Despite these noteworthy accomplishments, the study had several limitations. The expression pattern of DEGs in normal samples was quite homogeneous, whereas that in BE segment samples was quite nonhomogeneous. A possible explanation was that different BE samples were composed of high/low grades and no dysplasia existed, which would produce distinct expression profiles. In addition, we only analyzed one case of BE origin from distal esophageal intestinal, not from normal mucosa of gastric cardia due to the limited samples of dataset we used. Moreover, we did not validate this explanation. Further studies are required to identify markers for different BE origins, which may be very important for personalized therapy.
Conclusions
We identified CREB3L1, HNF1B, and IL35 as key genes associated with the development of BE, and composed of a BE-specific XGBoost classifier. Their specific roles remain to be revealed. These key genes may serve as novel biomarkers and therapeutic targets for BE in future clinical practice.
Footnotes
Author Disclosure Statement
The authors declare they have no competing financial interests.