




Abstract
Based on matrix completion algorithm, we proposed a simple method to recover the missing regions in the X-ray crystal structures using the corresponding nuclear magnetic resonance (NMR) measurement data for the proteins with both X-ray and NMR experimental data deposited in Protein Data Bank (PDB). By selecting 10 test proteins deposited in PDB and comparing with the standard MODELLER results from the root-mean-square deviation and MolProbity aspects, we validated that our method can provide a better protein structure model, which combines both X-ray crystallographic structure data and NMR data together than MODELLER algorithm. This method is particularly useful for building the initial structures in Molecular Dynamics when studying the protein folding process.
1. Introduction
Knowing protein structure is important for the understanding of protein's function and hence is essential to biology. So far, X-ray diffraction (XRD) method is still the most frequently used method for protein structure determination in Protein Data Bank (PDB) (Berman et al., 2000). However, some residues in the protein crystal structure, especially in disordered regions, could not be deciphered from the X-ray data because X-ray experiments are capable of seeing only stationary atoms (Zhang et al., 2012). In fact, this is the common situation for protein crystal structure (Djinovic-Carugo and Carugo, 2015). However, the disordered region is no less important in biology, and the understanding of disordered protein/region tends to be a hot topic (Berlow et al., 2015; Dolan et al., 2015; Lazar et al., 2016). In contrast, when one studies the protein folding problem using molecular dynamics, it is always much better to use a complete protein chain rather than a truncated chain, due to the long-range interactions in protein. Therefore, it is important to recover the missing regions in protein crystal structures.
A common method to recover the missing parts in protein crystal structures is MODELLER (Šali and Blundell, 1990, 1993; Šali et al., 1990, 1995). The calculation process of MODELLER includes the following steps: first, suitable structural templates in PDB are selected based on protein sequence alignments with the target sequence (Needleman and Wunsch, 1970). With the selected templates, three-dimensional (3D) models are then calculated by optimizing an objective function, which is composed of energy terms and spatial restrictions, and hence can be considered as a score for evaluating the structural rationality. In detail, the objective function is expressed as a probability density function with different constrains, including Cα-Cα distances, main-chain N-O distances, and main-chain and side-chain dihedral angles (Šali and Blundell, 1993). The model with the lowest value of the objective function is the most representative one.
Experimentally, if the protein with missing regions in its crystallographic structure is not too large, the nuclear magnetic resonance (NMR) can be used as an alternative method to get the structure. By studying the Nuclear Overhauser Effect Spectroscopy (NOESY), one can give the pairwise distances between hydrogen atoms that are not far away from each other and hence obtain the tertiary structure using some reconstruction algorithms such as Dynamics Algorithm for NMR Applications (DYANA) (Güntert et al., 1997), Combined Assignment and Dynamics Algorithm for NMR Applications (CYANA) (Güntert, 2004), and the internal NIH version of XPLOR (XPLOR-NIH) (Schwieters et al., 2003, 2006). As a result, the structure obtained from NMR heavily depends on the reconstruction algorithm and is not as accurate as the high-resolution XRD method in general. In contrast, we note that the experimental conditions for performing the NMR and XRD are different, which is another reason that the structural deviation between NMR and XRD is not small.
In this work, we focus on recovering the missing flexible regions in the crystallographic structure for those proteins with both XRD structures and NMR NOESY data deposited in PDB. Different from the general method MODELLER, our method uses the distance information measured in NMR experiment for the specific protein rather than generally selecting structural templates from PDB. By embedding the NMR pairwise distance measurements into the high-resolution XRD structures using Euclidean distance matrix completion method (Havel, 1991; Moré and Wu, 1999; Grooms et al., 2009; Li et al., 2017, 2019), our aim is to generate more reliable models based on both NMR and XRD measurements. Hence, our method is a complementary method to MODELLER for the proteins with both NMR and XRD experiments. See the first reference in the References section for code for our method on github.
2. Methods
As we already know, the protein structure can be represented as a Euclidean distance matrix (EDM) in which each element stands for the distance between the corresponding atoms in protein structures. When there are missing regions in the protein structure, the corresponding columns/rows are empty. Matrix completion (MC) (Candès and Tao, 2010; Candès and Plan, 2011) is used to transform an incomplete distance matrix into a complete one by minimizing the rank or nuclear norm of a matrix. However, for an EDM with completely empty columns/rows we mentioned above, it is impossible to recover it exactly since solving MC problems needs not only a certain sampling number but also uniform sampling (Candès and Tao, 2010). To this end, we need to add distance elements in the columns/rows corresponding to the missing regions. There are three types of distances that can be taken as preknown distances: (1) The NOESY data measured in NMR experiment relevant to the missing regions; (2) The covalent bonds and coplanar atom distances in the missing regions; (3) Since the number of distances of the above two types is still too few to satisfy the MC condition, we utilize the triangle inequality upper limits to generate all the rest distance elements in the missing regions and sample from them uniformly as preknown distances. After the three types of distances are added to the EDM, we get a qualified incomplete matrix for MC.
When the MC is applied to the low-rank matrix, it is usually solved by minimizing the rank of the target matrix. However, this problem is not solvable easily because the rank minimization problem is nonconvex. To ameliorate this situation, rank minimization tends to be replaced by nuclear norm minimization, where the nuclear norm is equal to the sum of singular values of the matrix. In this article, the MC process is performed by a Scaled variant of Alternating Steepest Descent (ScaledASD) algorithm, which is a low-rank MC algorithm applied into image processing successfully (Tanner and Wei, 2016). ScaledASD algorithm circumvents the high computational cost of the singular value decomposition in nuclear norm minimization using a simple decomposition model. More specifically, we suppose that the target matrix is
However, because of the errors of experimental data and the triangle inequality estimation, a raw structure obtained from MC tends to bring some distance violations inevitably. We adopt two kinds of the postprocessing procedures described in Alipanahi (2013), including using optimization method Broyden-Fletcher-Goldfarb-Shanno (Lewis and Overton, 2013) to minimize distance violations and chirality refinements (Alipanahi et al., 2013) on the whole protein chain. In the end, we perform energy minimization (EM) to make the structures more energetically favored (Lindorff-Larsen et al., 2010). However, we noticed that there was a severe problem in the above procedures: The “precise” regions in the X-ray crystallographic structure also get deformed, which is not what we want.
To solve this problem, we make the following refinements: first, we extract the missing regions together with their nearest neighboring peptide planes from the results obtained above; then we combine the extracted segments with the known regions in X-ray crystallographic structure through appropriate translation and rotation operations so that the nearest peptide planes neighboring the missing regions are best overlapped. In the end, we add very strong restraints on each atom in the XRD known regions and perform EM only on structures in the missing regions. The overall workflow for recovering the missing regions in XRD protein structures is shown in Figure 1.
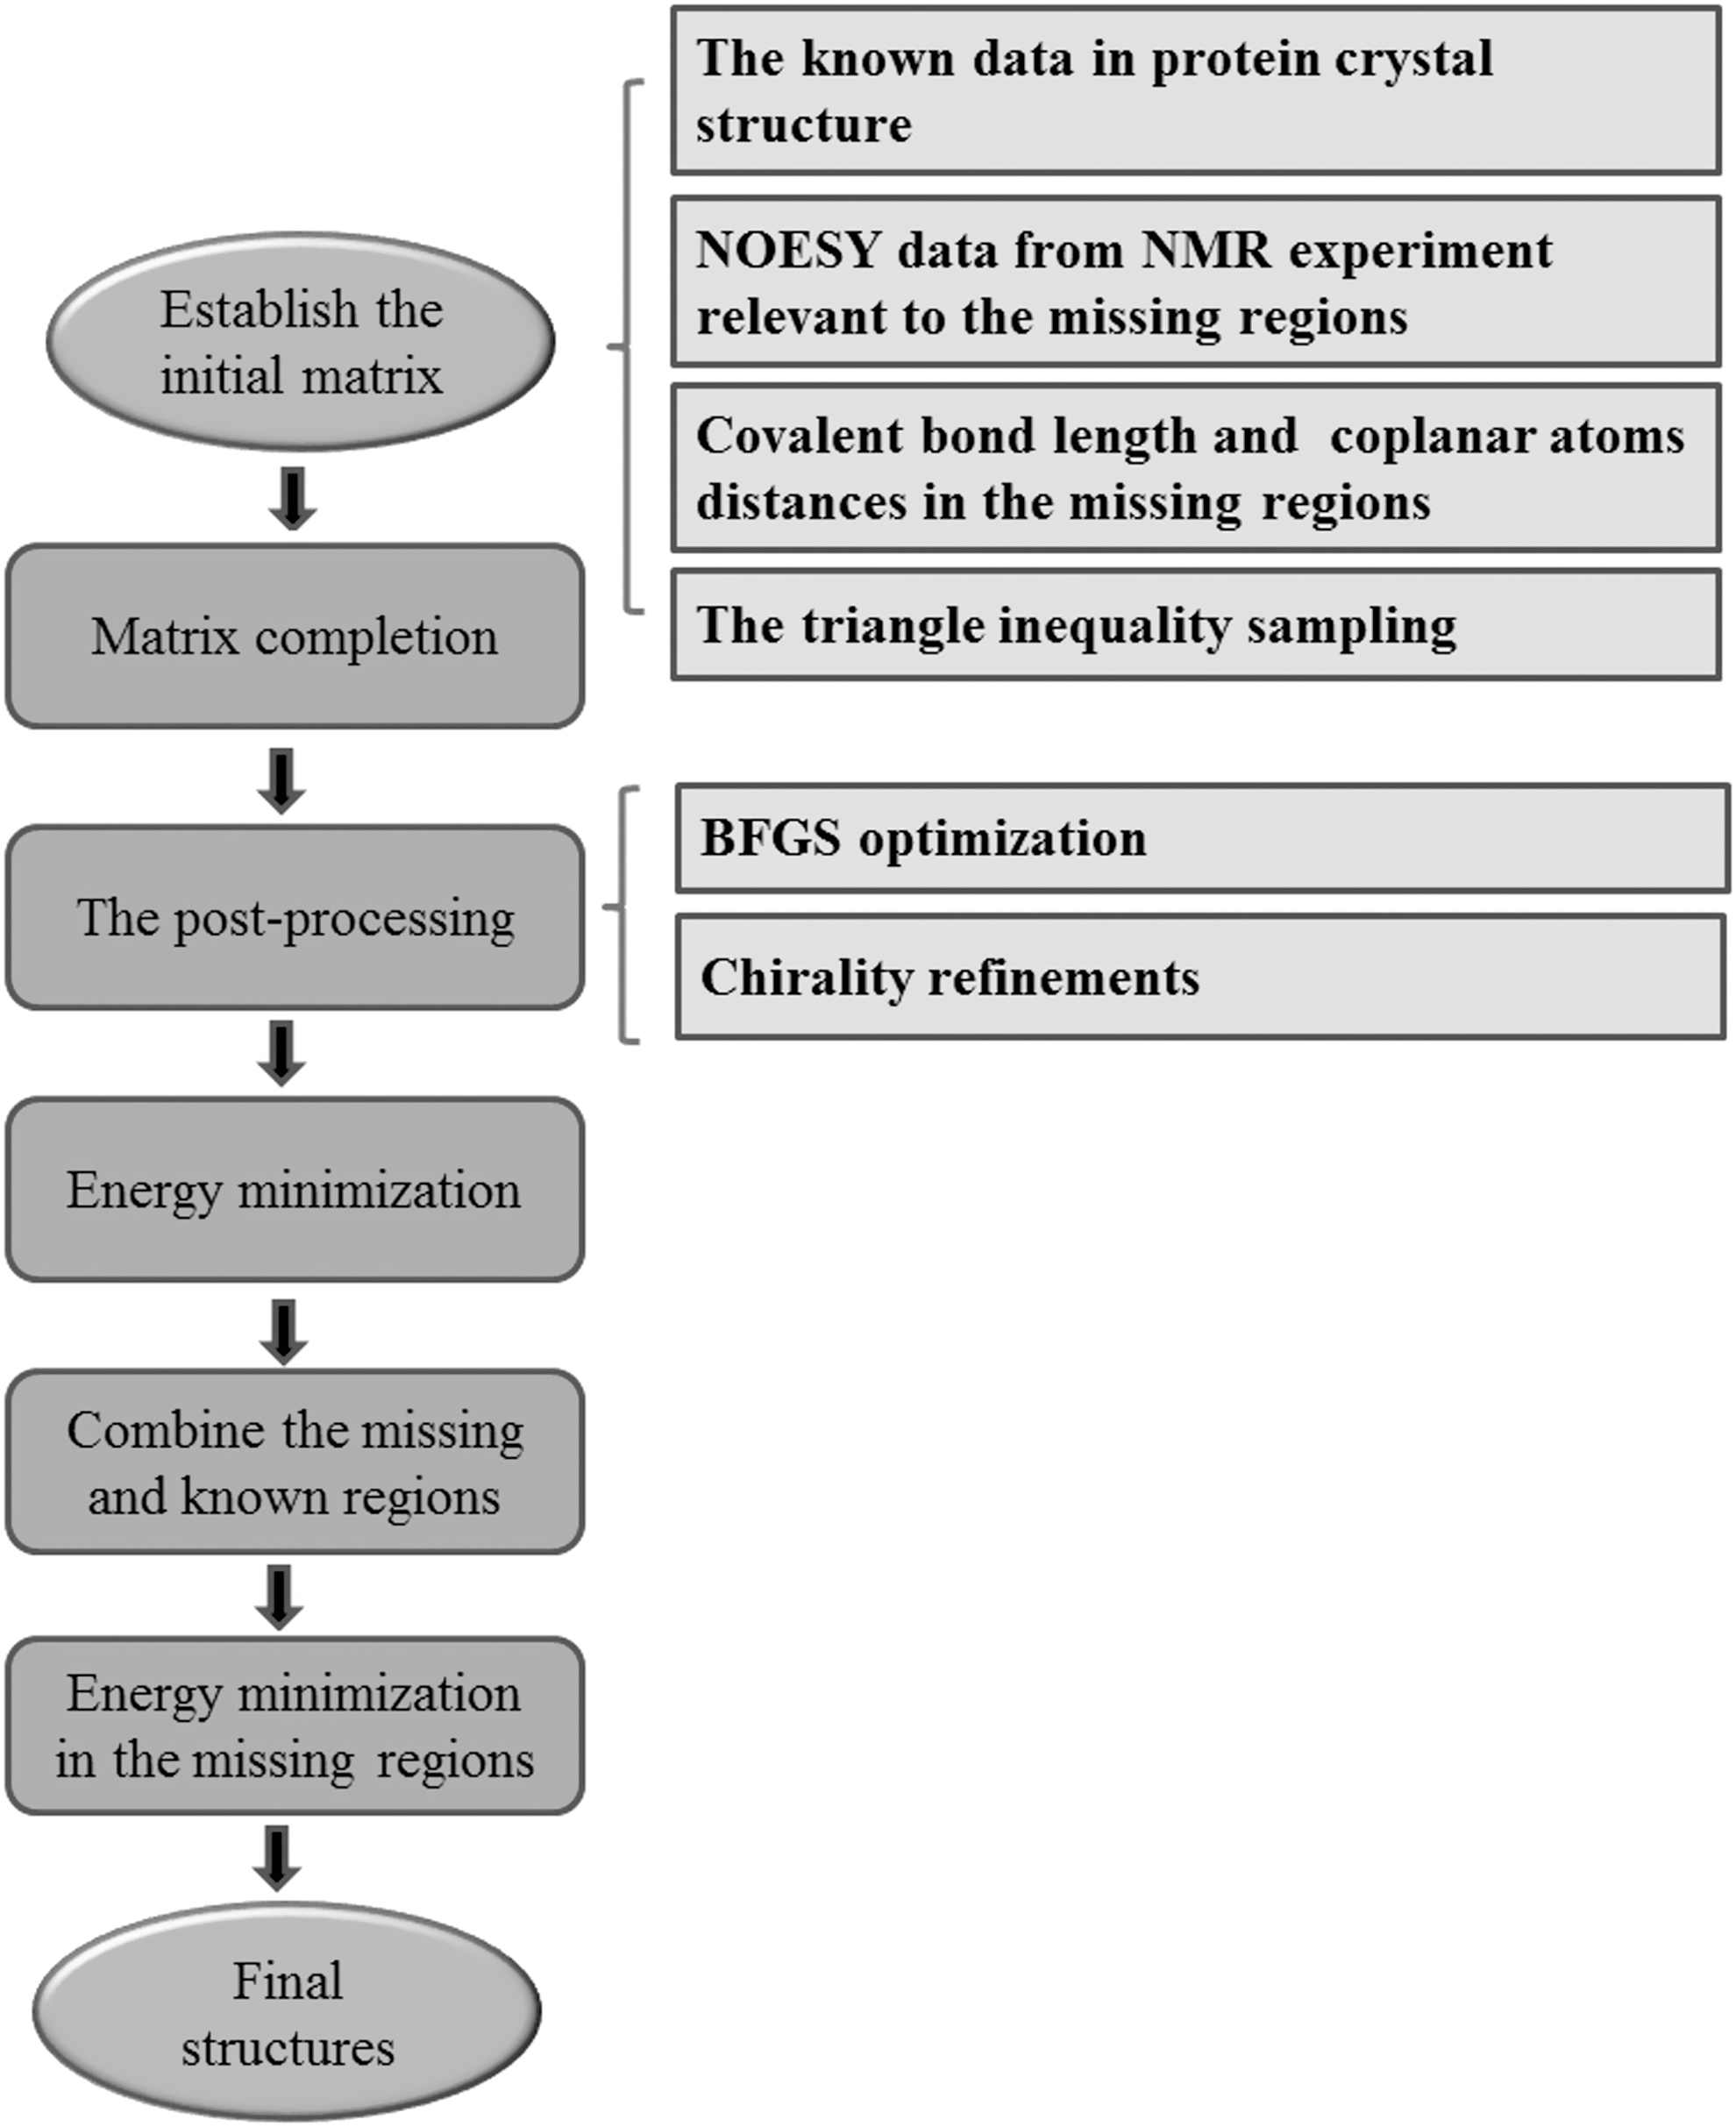
Flowchart of recovering missing regions in crystal structures.
In the end, we would like to address the reasons why not to recover the missing regions by directly connecting the corresponding regions in NMR models with XRD known structures. There are two main problems: (1) In general, the NMR models heavily depend on the reconstruction algorithms and hence not accurate enough compared with the XRD data; (2) The conditions for the NMR measurements and XRD measurements are different: XRD method needs to crystallize the protein sample, then the atomic model can be deduced from the electron density map obtained by XRD of the crystal. However, NMR can be carried out in solution without crystallization, and it is not a “microscope with atomic resolution” like XRD; instead, it provides part of the short distances of hydrogen atoms, which is used as constrained conditions for protein structure optimization. It leads to the fact that the known regions between XRD and NMR cannot be quite similar to each other. As a result, it is improper to directly superimpose the NMR models with XRD known structures for recovering the missing regions.
3. Results and Discussion
To evaluate the performance of our method, a set of 10 X-ray/NMR structure pairs of proteins with the same sequences is picked from PDB, as listed in Table 1. The missing locations in 10 test protein XRD structures contain both terminal regions and internal regions. In Table 1, we list the sequence ranges related to the known residues and the missing residues in XRD structures for each protein in the last two columns, respectively. The sequence and sequence location of the missing residues are shown in Figure 2. The NMR distance data associated with missing residues are obtained from the Database Of Converted Restraints (DOCR) database in the NMR Restraints Grid (Doreleijers et al., 2003, 2005), a server for parsing the NMR experimental data in PDB.
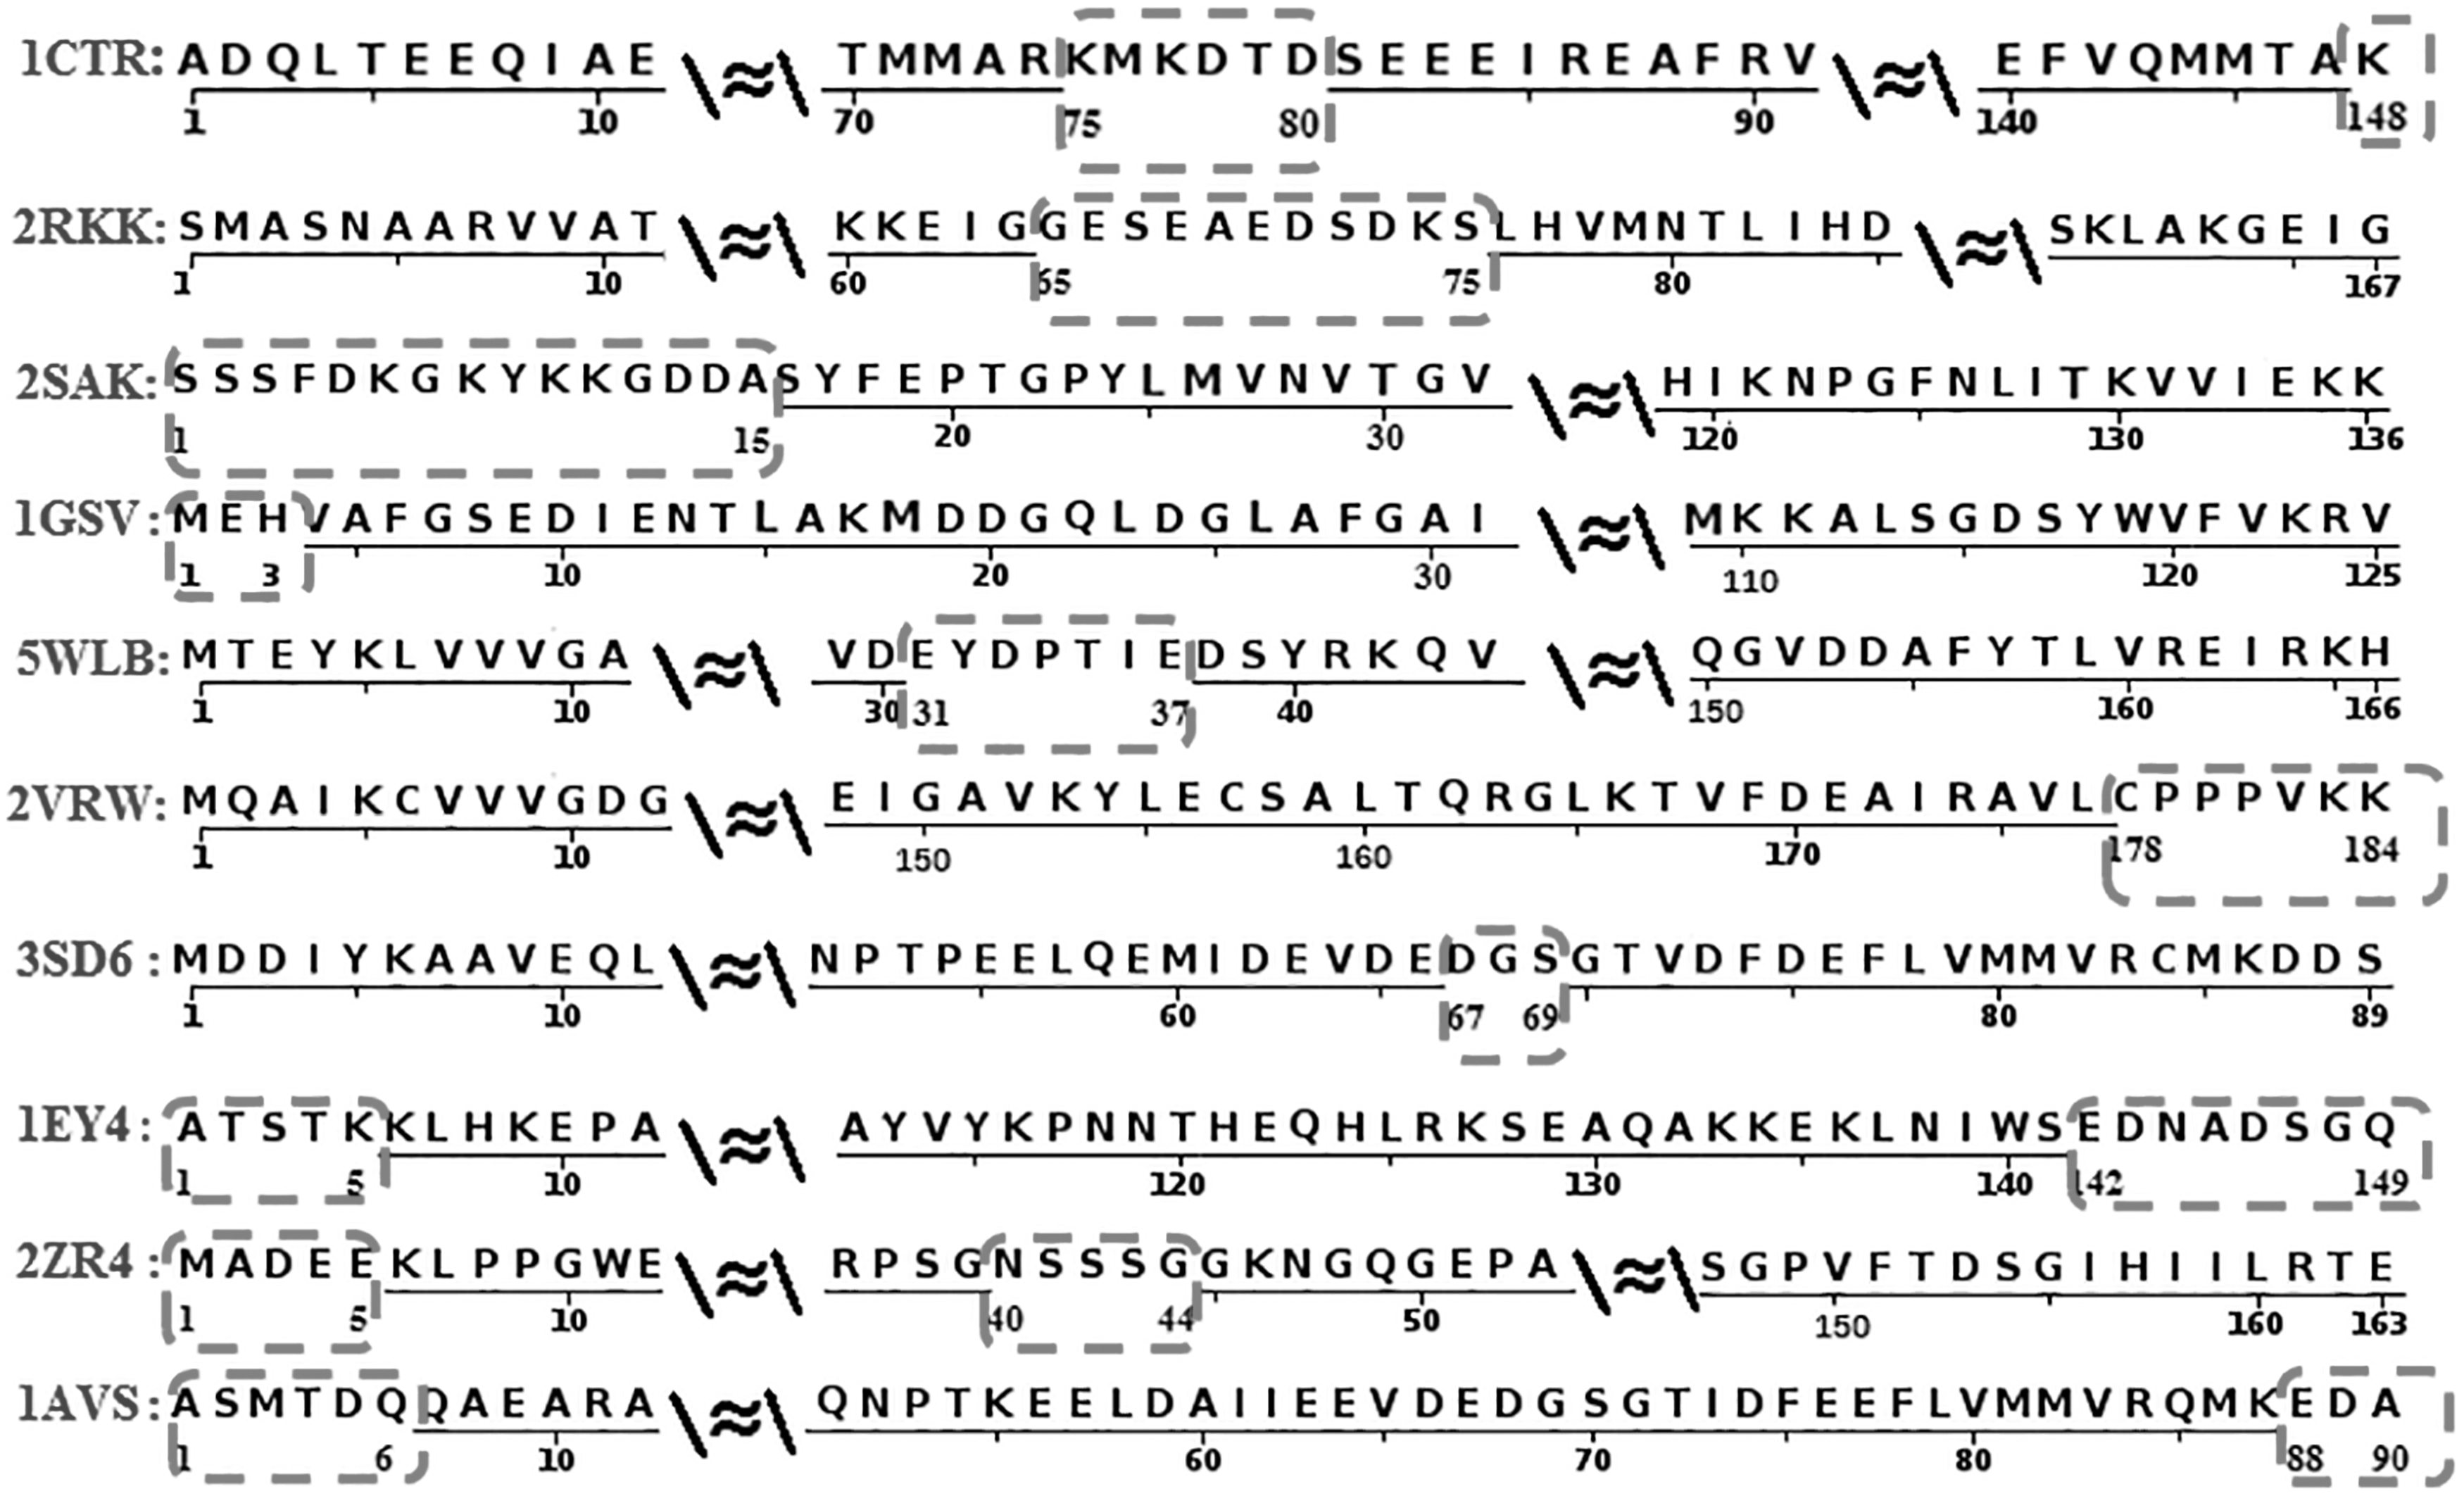
The diagrammatic sketch of the missing residues for 10 test proteins. The red dotted frame indicates the missing residue sequence.
Ten X-Ray/Nuclear Magnetic Resonance Structure Pairs
NMR, nuclear magnetic resonance; PDB, Protein Data Bank.
The evaluation criterion is as follows: the missing region should have some similarity to the NMR structure while the known structures stay almost unchanged. As a result, we compute the root-mean-square deviation (RMSD) values for the missing regions and known regions separately. For the known regions, we take the XRD structure as the reference; for the missing regions, we take the NMR structure as the reference. Besides, we also evaluate our method using MolProbity, where a comprehensive score named MolProbity score (MPscore) is given for characterizing the overall structural quality (Chen et al., 2010).
3.1. The comparison of root-mean-square deviation
We first calculate the RMSD based on Cα atoms (Cα RMSD) of the known region between our result and the XRD reference structure. As a control group, we use the top 5 models given by MODELLER. The results are shown in the penultimate column in Table 2, where we can see that the RMSD values for the known regions in both methods are very small and comparable with the reference XRD structures, indicating that there is no great deformation when we perform the missing region recovery.
The Comparison of Cα Root-Mean-Square Deviation for Recovery Structures Calculated by Our Method and MODELLER
RMSD, root-mean-square deviation.
Next, we take the first model of NMR structure as the reference structure and calculate the Cα RMSD values in the missing regions (except the very short part with less than three residues) for our recovered structure and the models obtained from MODELLER, respectively. We note that structures of the missing region reconstructed from our method are not unique due to the random sampling procedure when establishing the initial distance matrix before MC. However, such nonuniqueness is reasonable and consistent with the flexibility of those missing regions. Nevertheless, our method is still more accurate since it used the NMR measurement data for the same protein in contrast to using the short structure templates obtained from different proteins in MODELLER program.
To make things simple, we directly calculate each protein for five times to obtain five models so that we can directly make a comparison with the results from MODELLER. The corresponding results are listed in Column 3–6 in Table 2, and the RMSD comparison diagram for each missing structure is shown in Figure 3, where we can see that the RMSDs of our results are smaller compared with MODELLER for the vast majority of missing structures, indicating that the recovered structures by our method are more similar to NMR structure than MODELLER. Although this result seems natural, we emphasize that the recovered missing regions from our method are still quite different from the original NMR structures, which can be seen from the big RMSD values between our results and the NMR references. The reason lies in the fact that the NMR measurement conditions cannot be exactly the same as XRD measurement conditions even for the same protein. Such big gaps between our reconstructed missing regions and the NMR references also indicate that it is not proper to directly connect the missing regions in NMR model to the XRD structures.
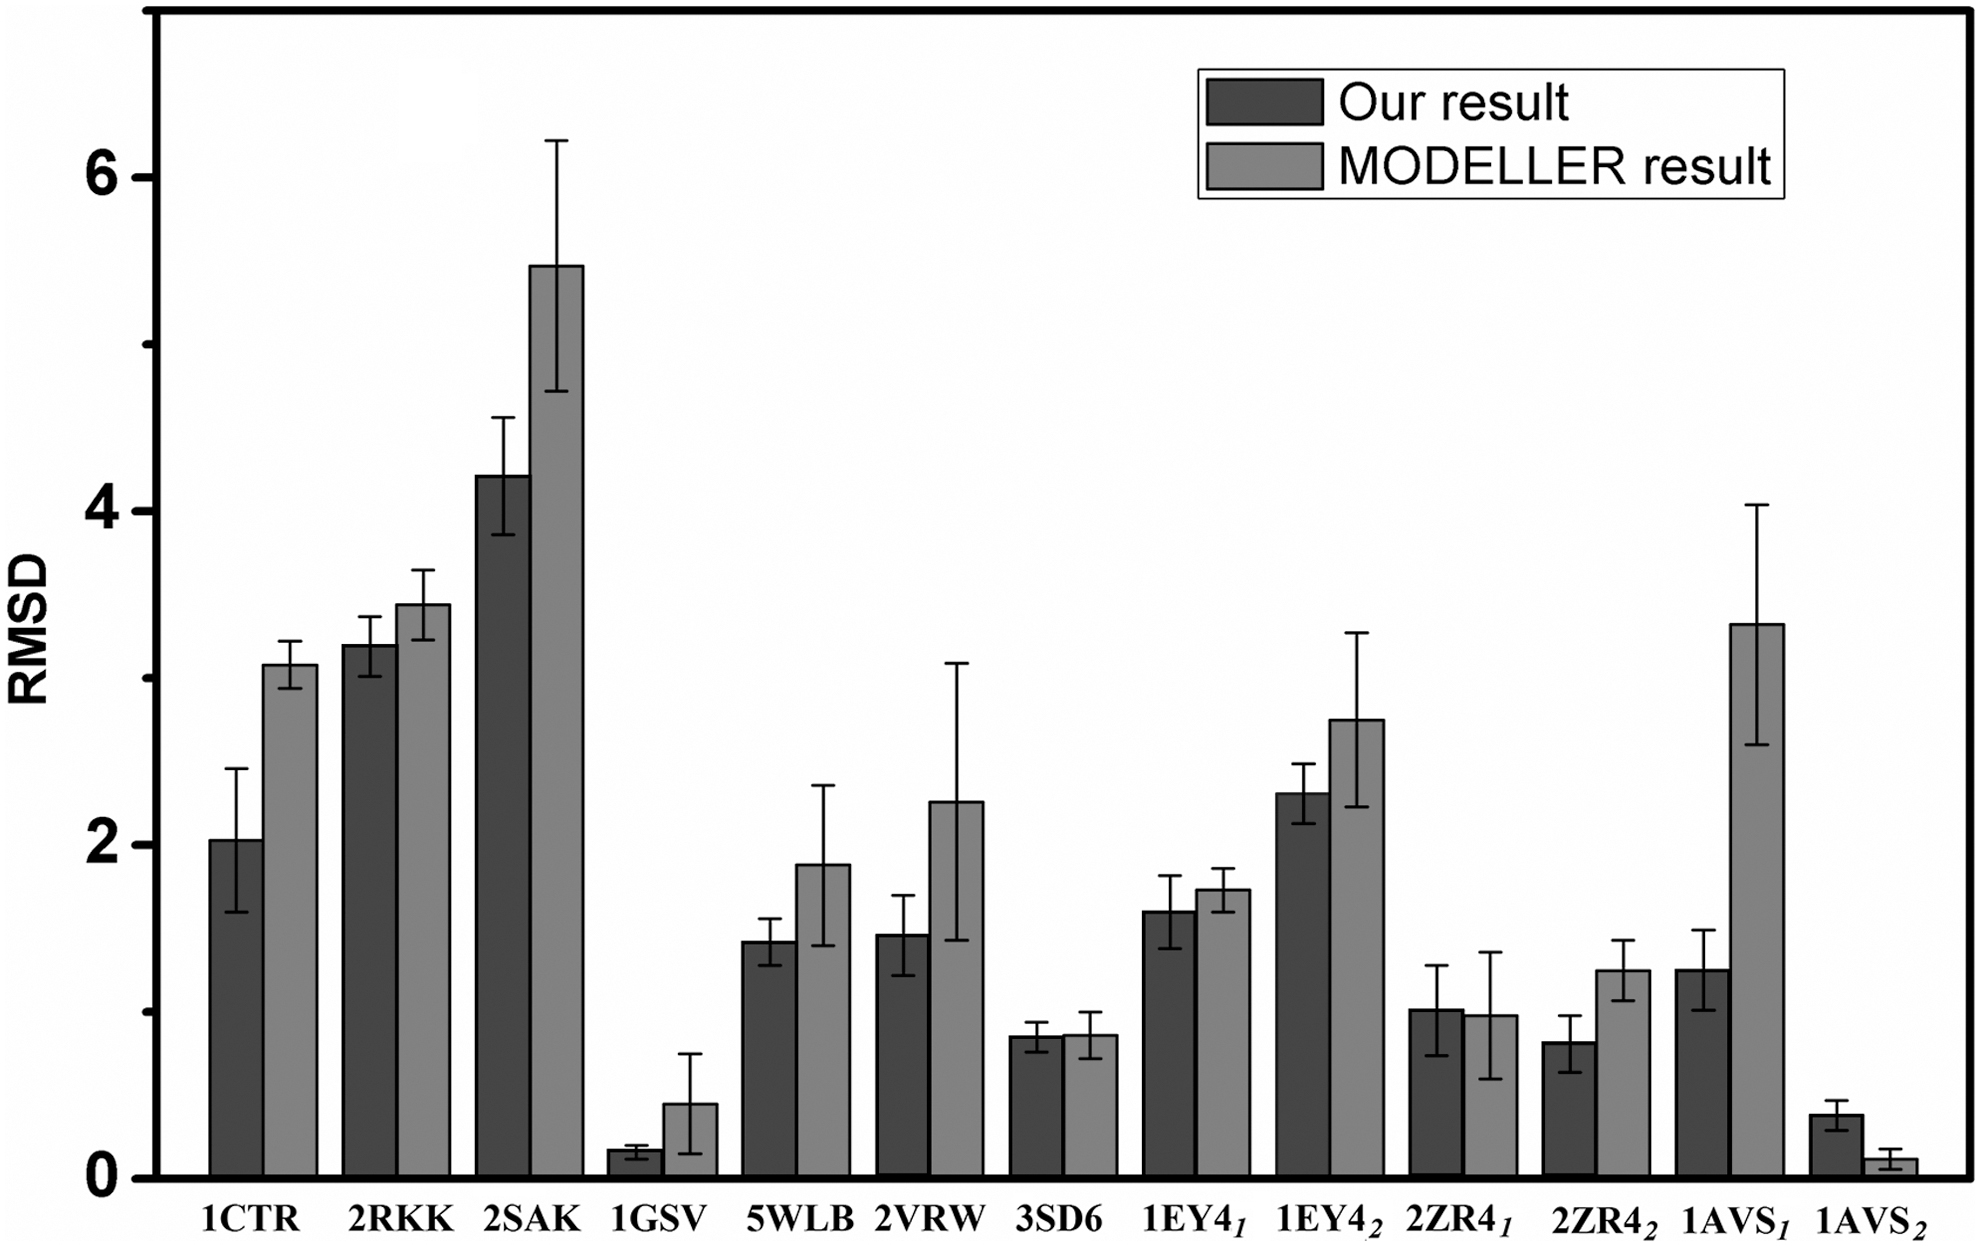
The RMSD comparison of our result (black) and MODELLER result (grey) with the first model of NMR structure. NMR, nuclear magnetic resonance; RMSD, root-mean-square deviation.
In the end, we show the recovered 3D structures taking PDB entries 2RKK, 2SAK, 3SD6, and 1EY4, in which the missing structures of 2RKK and 3SD6 are located in internal regions and those of 2SAK and 1EY4 are located in terminal regions in Figure 4. In Figure 4, we can clearly see that the missing loops reconstructed from our method clearly have more similar orientations to the NMR structure than the MODELLER results. For the remaining proteins, we show them in Supplementary Figure S1.

The superimpositions of 3D structure for PDB entries 2RKK, 2SAK, 3SD6, and 1EY4. In each panel, the dark grey structure is the known regions of the protein and the first model of the corresponding NMR PDB entry in the missing regions. The light grey structures are the missing regions recovered by different algorithms:
3.2. MPscore for the recovery structures
In the previous section, we have shown that the missing regions reconstructed from our method are more similar to the NMR models since it contains more NMR measurement information than MODELLER. In this subsection, we try to analyze the structure validities using MPscore. MolProbity is a structure-validation web service that evaluates structural quality for both proteins and nucleic acids. MPscore is an important parameter in MolProbity. A better structure has a lower MPscore numerically. To estimate our results further, we evaluate the top five models of our structures, MODELLER structures, and NMR structures by calculating MPscores, as listed in Table 3. To look more intuitively, we drew the MPscore diagram for 10 proteins in Figure 5. We can see in Figure 5 that the MPscores for our results are always obviously smaller than MODELLER results and NMR structures (only except 1CTR), indicating that our recovered structure is more reasonable.

The MPscore comparison of our structure (black), MODELLER structure (dark grey), and NMR structure (light grey).
The Comparison of MPscores of Our Results, MODELLER Results, and Nuclear Magnetic Resonance Structures
In the end, we use another 10 pairs of proteins with both crystal structure and NMR data deposited in PDB to further validate our method. The procedure is as follows: The 10 crystal structures are actually without missing regions, but we hide their structures and treat the whole proteins as missing regions. Then we use our method with their corresponding NMR data to reconstruct those “missing regions” and compare with the hidden X-ray structures. The RMSDs between calculated structures and the crystal structures are listed in Supplementary Table S1. The results show that the calculated structures are consistent with the crystal structures, indicating that our method is valid for recovering the crystal structures from NMR data.
4. Conclusion
In conclusion, we have developed a simple method for recovering the missing regions in the protein X-ray crystallographic structure, by incorporating its NMR measurement data using the MC method, postprocessing, and EM refinement. By calculating the RMSD values for the known structure we confirm that our method preserves the known regions in the X-ray crystallographic structure well; by calculating the RMSD values for the missing regions we show that our method has embedded the NMR measurement properties into the missing regions. In the end, we validated our method by calculating the MPscore and compared with the standard MODELLER program results and NMR structures. The results show that our structures have superior MPscores, which indicate that our recovered structure is more reasonable.
Although our method is only valid for a specific group of proteins which have both XRD and NMR measurements deposited in PDB with missing regions in X-ray crystallographic structures, we emphasize that our method is highly nontrivial in studying the protein folding pathways and its functions, where the complete native structures with high precision are usually necessary.
Footnotes
Acknowledgment
The authors thank Prof. Ge Molin for valuable discussions.
Author Disclosure Statement
The authors declare that they have no competing financial interests.
Funding Information
This work was supported by the National Science Foundation (NSF) of China with the Grant No.11675014. Additional support was provided by the Ministry of Science and Technology of China (2013YQ030595-3).

References
Supplementary Material
Please find the following supplemental material available below.
For Open Access articles published under a Creative Commons License, all supplemental material carries the same license as the article it is associated with.
For non-Open Access articles published, all supplemental material carries a non-exclusive license, and permission requests for re-use of supplemental material or any part of supplemental material shall be sent directly to the copyright owner as specified in the copyright notice associated with the article.
